Figure 1-1 Rectilinear propagation of light through uniform medium. Here, the speed of light is constant with spherical wavefronts and straight rays. Note that in nonuniform medium, the speed of light is variable and rays are not straight. (Illustration developed by Leon Strauss, MD, PhD.)
Let’s assume that our light travels only in uniform media, so that we do have spherical wavefronts and straight-line rays; we will find that we can analyze the rays to understand what happens when the waves meet the interface between one uniform medium and another, and either travel into the new medium (refraction), bounce back into the first medium (reflection), or are lost as heat (absorption).
Refraction and reflection are called diffuse if the interface is so rough that the direction of the wavefronts is lost; they are called specular if there continues to be an identifiable direction of propagation of the wavefronts (Figs 1-2, 1-3).
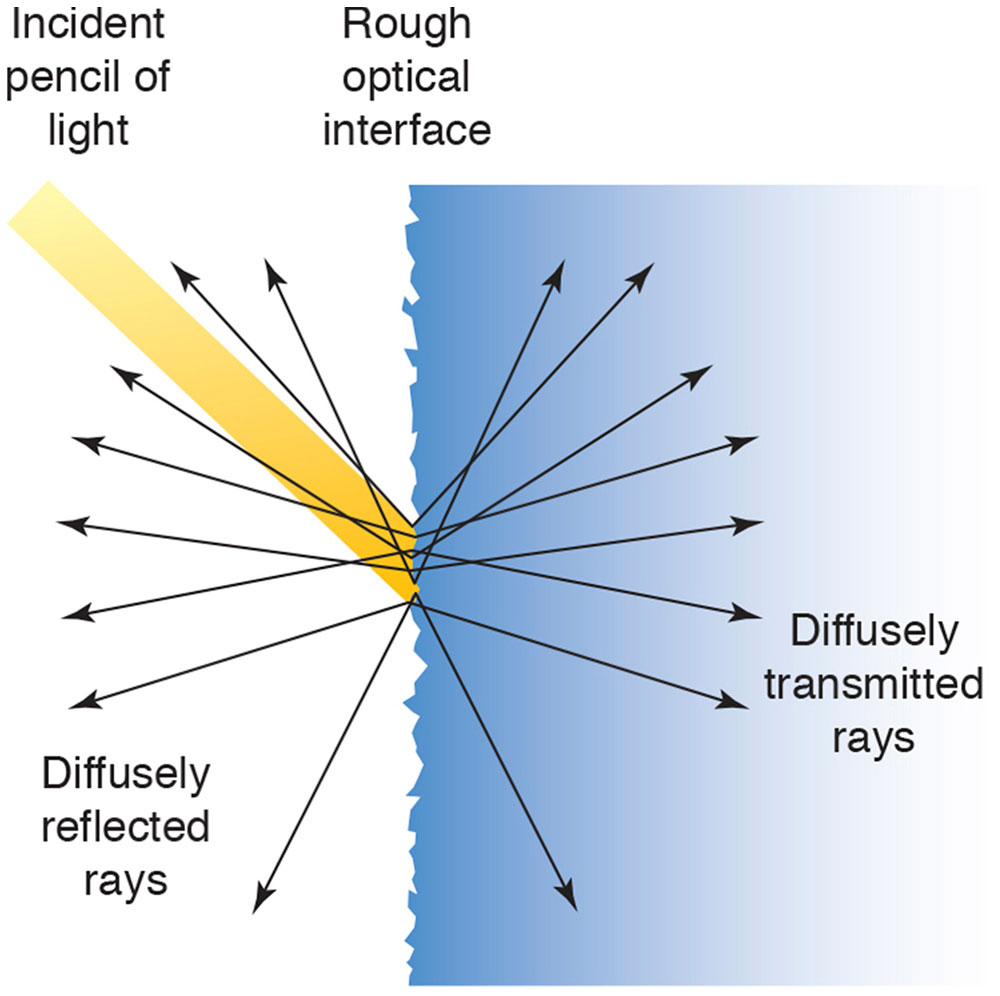
Figure 1-2 Light striking a rough surface is diffusely reflected and/or transmitted. (Illustration developed by Kevin M. Miller, MD, and rendered by C. H. Wooley.)
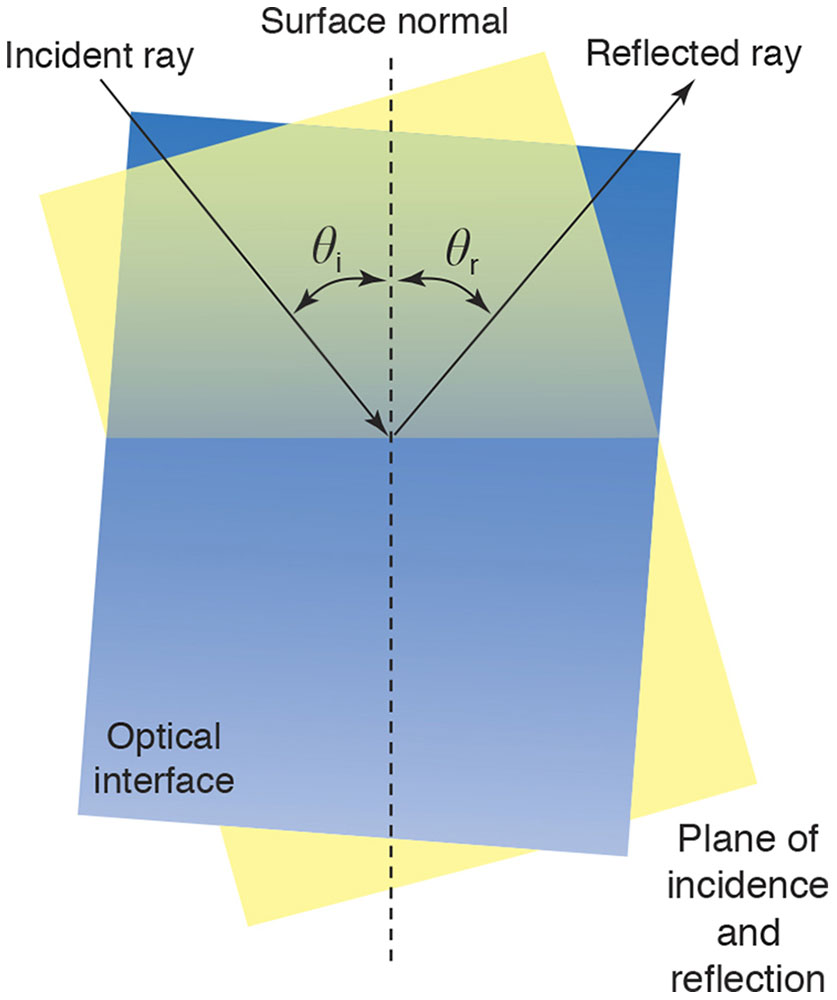
Figure 1-3 Light striking a smooth surface is specularly reflected and/or refracted. θi = angle of incidence; θr = angle of refraction. (Illustration developed by Edmond H. Thall, MD, and Kevin M. Miller, MD, and rendered by C. H. Wooley.)
If we study the behavior of these rays at refracting and reflecting surfaces, we can learn to determine how images are formed by optical systems, where they are located, and how large they are.
Point Sources, Pencils, and Beams of Light
You can think of a distant star as a point source of light, as its apparent size is so small. If we cut off a portion of the bundle of rays of light that emanate from a point source by placing an aperture in their path, the light that passes through the hole is called a pencil of rays (Fig 1-4). The rays passing just inside the edges of the aperture are called limiting rays. The rays of a pencil of light are divergent, parallel, or convergent in the direction of travel of the light (Fig 1-5). Waves of light naturally diverge from their source but can become convergent if they are redirected, for instance, by passing through a convex lens.
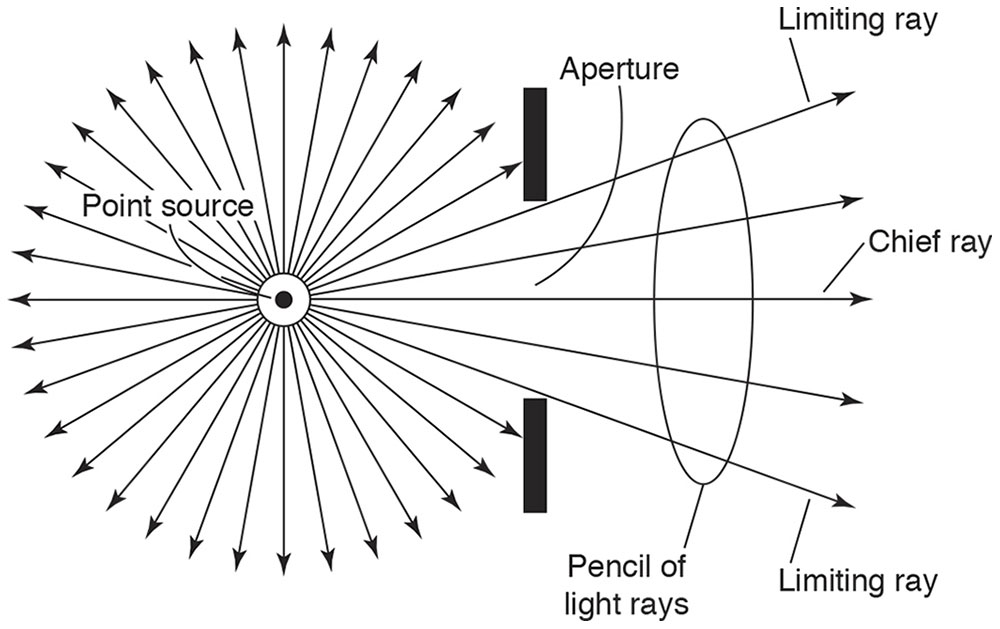
Figure 1-4 Point source of light and an aperture, creating a pencil of rays. (Redrawn from Basic and Clinical Science Course Section 2: Optics, Refraction, and Contact Lenses. San Francisco: American Academy of Ophthalmology; 1986–1987:38. Fig 1.)
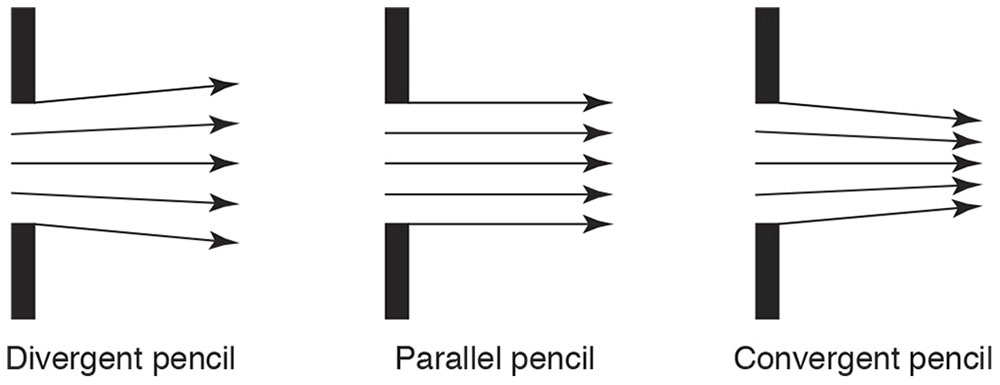
Figure 1-5 Divergent, parallel, and convergent pencils of light. (Redrawn from Basic and Clinical Science Course Section 2: Optics, Refraction, and Contact Lenses. San Francisco: American Academy of Ophthalmology; 1986–1987:39. Fig 2.)
A beam of light includes many pencils of light that arise from the points of an extended source (Fig 1-6). A light bulb and the sun are examples of extended sources of light, and the objects you see around you are extended sources of reflected light. A slide projector emits a mildly diverging beam of convergent pencils of light, each of which has been focused by a lens to converge to points on the screen across the room, forming a larger picture on the screen of the smaller picture on the slide. (See Clinical Example 1-1.)
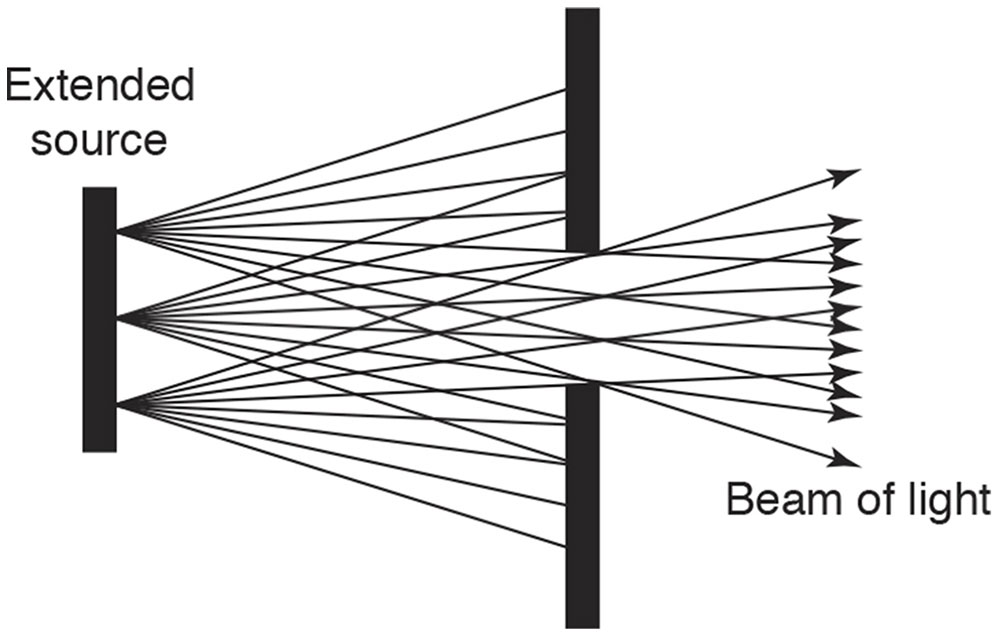
Figure 1-6 A beam of light, consisting of pencils emanating from many point sources, that is being limited by an aperture. (Redrawn from Basic and Clinical Science Course Section 2: Optics, Refraction, and Contact Lenses. San Francisco: American Academy of Ophthalmology; 1986–1987:39. Fig 3.)
Clinical Example 1-1
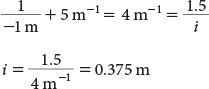
The concept of conjugate points is illustrated by retinoscopy. When performing retinoscopy, the examiner observes light emanating from the patient’s retina and passing through the patient’s pupil. Because the examiner is observing the light at the patient’s pupil, the examiner’s retina is conjugate with the patient’s pupil (Fig 1-7A). At the point of neutrality in the refraction, the patient’s retina is conjugate with the peephole of the retinoscope (Fig 1-7B). Adjustment for the distance between the examiner and the patient (working distance) makes the patient’s retina conjugate with optical infinity (Fig 1-7C). (Retinoscopy is covered in detail in Chapter 3, Clinical Refraction.)
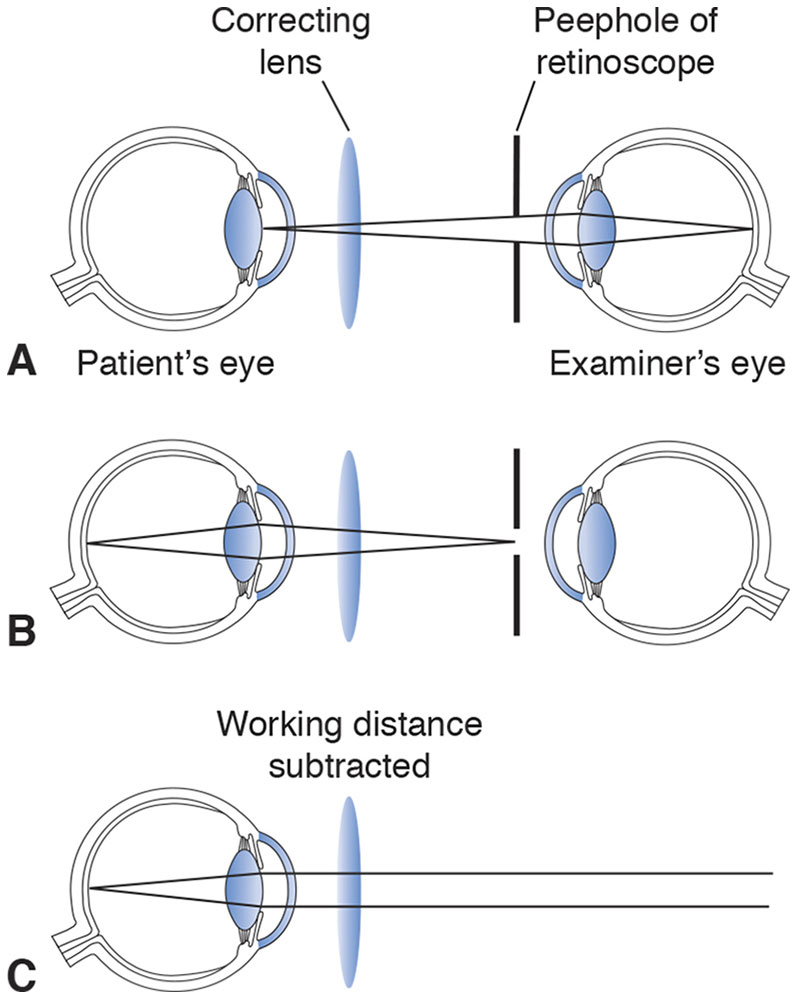
Figure 1-7 A, In retinoscopy, the examiner’s eye is conjugate with the patient’s pupil. B, At the point of neutrality, the patient’s retina is conjugate with the retinoscope peephole. C, With the working distance subtracted, the patient’s retina is conjugate with optical infinity. (Illustration developed by Kevin M. Miller, MD, and rendered by C. H. Wooley.)
Another example of conjugacy is demonstrated by direct ophthalmoscopy. When the ophthalmoscope is focused to compensate for the refractive error of the examiner and that of the patient, the 2 retinas are conjugate (Fig 1-8). An image of the patient’s retina is present on the examiner’s retina and vice versa. However, the patient does not “see” the examiner’s retina, because it is not illuminated by the ophthalmoscope light and because this light is so bright.
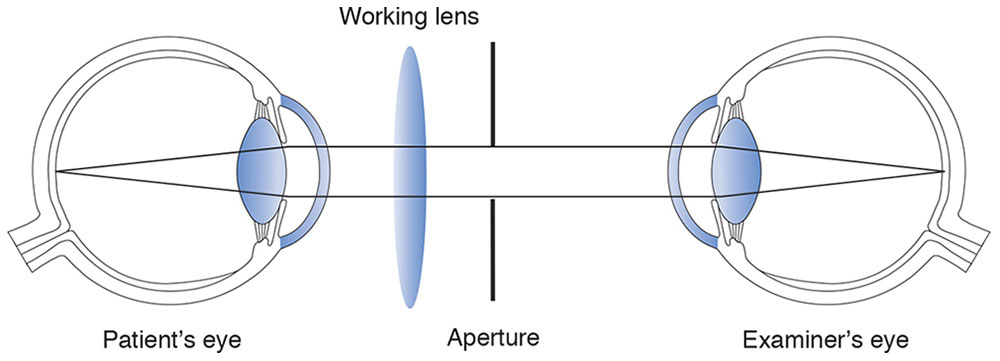
Figure 1-8 Conjugacy in direct ophthalmoscopy. (Illustration developed by Kevin M. Miller, MD, and rendered by C. H. Wooley.)
Object Characteristics
Objects may be characterized by their location with respect to the imaging system and by whether they are luminous. If an object point such as a candle flame produces its own light, it is called luminous. If it does not produce its own light, it can be imaged only if it is reflective and illuminated.
Image Characteristics
Images are described by characteristics such as magnification, location, quality, and brightness. Some of these features will be discussed briefly.
Magnification
Three types of magnification are considered in geometric optics: transverse, angular, and axial. The ratio of the height of an image to the height of the corresponding object is transverse magnification (Fig 1-9):
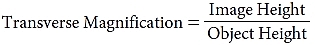
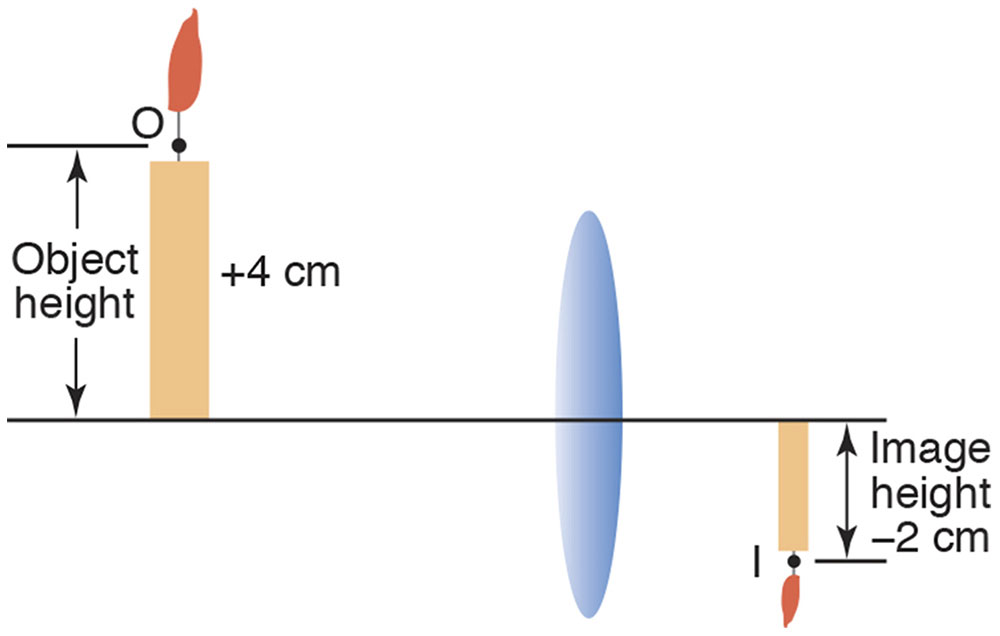
Figure 1-9 Object height (O) and image height (I) may be measured from any pair of off-axis conjugate points. (Illustration developed by Edmond H. Thall, MD, and Kevin M. Miller, MD, and rendered by C. H. Wooley.)
To calculate transverse magnification, we compare the height of an object (ie, the distance an object extends above or below the optical axis) to that of its conjugate image (ie, the distance its image extends above or below the axis). Object and image heights are measured perpendicularly to the optical axis and, by convention, are considered positive when the object or image extends above the optical axis and negative when below the axis.
An image is a scale model of the object. If the object or image is upright (extending above the optical axis), a positive (+) sign is used; an object or image that is inverted (extending below the optical axis) is indicated by a minus (–) sign. The transverse magnification represents the size of the image in relation to that of the object. For instance, in Figure 1-9 the object height is +4 cm and the image height –2 cm; thus, the transverse magnification is –0.5, meaning that the image is inverted and half as large as the object. A magnification of +3 means the image is upright and 3 times larger than the object.
Transverse magnification can be confused with linear magnification. Linear magnification refers to the magnification of the area of an image relative to that of an object located perpendicular to the optical axis. For example, a 4 cm × 6 cm object imaged with a magnification of 2 produces an 8 cm × 12 cm image. Both width and length double, yielding a fourfold increase in image area. The reader should also not confuse transverse magnification with axial magnification, which is measured along the optical axis and is discussed at the end of this section. Generally, the multiplication sign, ×, is used to indicate magnification. The transverse magnification of microscope objectives, for example, is sometimes expressed by this convention.
The word power is sometimes used synonymously with transverse magnification. This is unfortunate because power has several different meanings, and confusion often arises. Other uses of the word include the terms refracting power, resolving power, prism power, and light-gathering power.
Most optical systems have a pair of nodal points (Fig 1-10). Occasionally, the nodal points overlap, appearing as a single point, but technically they remain a pair of overlapping nodal points. The nodal points are always on the optical axis and have an important property. From any object point, a unique ray passes through the anterior nodal point. This ray emerges from the optical system along the line connecting the posterior nodal point to the conjugate image point. These rays form 2 angles with the optical axis. The essential property of the nodal points is that these 2 angles are equal for any selected object point. Because of this feature, nodal points are useful for establishing a relationship among transverse magnification, object distance, and image distance. (See Appendix 1.1, Quick Review of Angles, Trigonometry, and the Pythagorean Theorem, at the end of the chapter.)
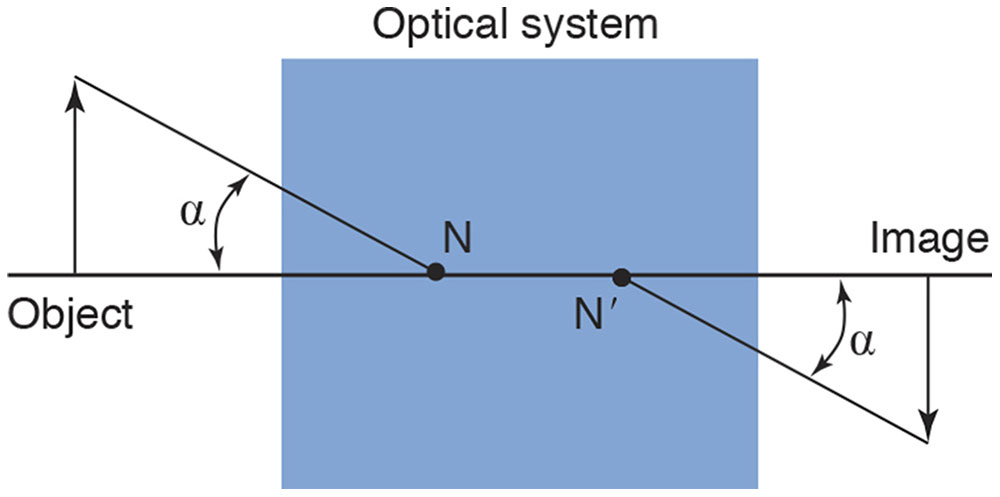
Figure 1-10 The anterior and posterior nodal points (N and N′, respectively) of an optical system. The angle subtended by the object (α) is equal to the angle subtended by the image. (Illustration developed by Kevin M. Miller, MD, and rendered by C. H. Wooley.)
Regardless of the location of an object, the object and the image subtend equal angles with respect to their nodal points.
Therefore,

Angular magnification is the ratio of the angular height subtended by an object viewed by the eye through a magnifying lens to the angular height subtended by the same object viewed without the magnifying lens. By convention, the standard viewing distance for this comparison is 25 cm. For small angles, the angular magnification (M) provided by a simple magnifier (P) is independent of the actual object size:
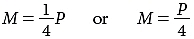
More will be said about simple magnifiers later.
Axial magnification, also known as longitudinal magnification, is measured along the optical axis. For small distances around the image plane, axial magnification is the square of the transverse magnification.
Axial Magnification = (Transverse Magnification)2
For example, if an object 4 cm in height (perpendicular to the optical axis) and 0.5 cm in length along the optical axis is imaged with a transverse magnification of 2×, the axial magnification is 4×. This produces an 8 cm × 2 cm image (4 × 2 = 8 cm height perpendicular to the optical axis and 0.5 × 4 = 2 cm length along the optical axis). This concept will be discussed in greater detail in Chapter 7.
Image Location
Another important characteristic of an image is its location. Refractive errors result when images formed by the eye’s optical system are in front of or behind the retina. Image location is specified as the distance (measured along the optical axis) between a reference point associated with the optical system and the image.
The reference point depends on the situation. It is often convenient to use the back surface of a lens as a reference point. The back lens surface is usually not at the same location as the posterior nodal point, but it is easier to locate.
Frequently, image distance is measured from the posterior principal point to the image. The principal points (discussed later in the chapter), like the nodal points, are a pair of useful reference points on the optical axis. The nodal points and principal points often overlap.
Whatever reference point is used to measure image distance, the sign convention is always the same:
By convention, when the image is to the right of the reference point, image distance is positive; when the image is to the left of the reference point, the distance is negative.
Depth of Focus
If we perform a basic imaging demonstration with a lens and focus an image of a light source on a paper, we notice that if the paper is moved forward or backward within a range of a few millimeters, the image remains relatively focused. With the paper positioned outside this region, the image appears blurred. The size of this region represents the depth of focus, which may be small or large depending on several factors. (See Clinical Example 1-2.) In the past, depth of focus was of concern only in the management of presbyopia. However, it is an important concept in refractive surgery as well.
Depth of focus applies to the image. Depth of field is the same idea applied to objects. If a camera or other optical system is focused on an object, nearby objects are also in focus. Objects within the range of depth of field will be in focus, whereas objects outside the depth of field will be out of focus.
Clinical Example 1-2
Pinholes are often placed in front of the naked eye to screen for uncorrected refractive error. Positioned over existing glasses and contact lenses, a pinhole screens for residual refractive errors. What is the depth of focus of a pinhole?
When an object is distant from a pinhole aperture, the image formed is relatively focused and remains so over a relatively long range. Thus, a pinhole creates a very long depth of focus.
Image Quality
Careful examination reveals that some details in an object are not reproduced in the image. Images are imperfect facsimiles, not exact scaled duplicates of the original object.
Consider an object 50 cm in front of a pinhole 1 mm in diameter. Paper is placed 50 cm behind the pinhole, so the magnification is –1×. A small pencil of rays from each object point traverses the pinhole aperture (Fig 1-11A and B).
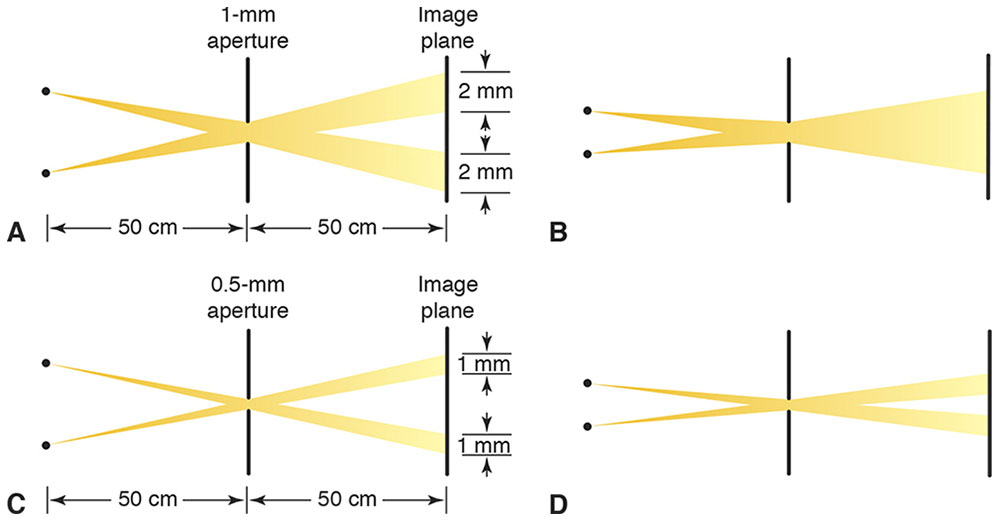
Figure 1-11 A, In pinhole imaging, a small pencil of rays from each object point traverses the aperture, producing a small spot in the image. B, If the object points are too close to each other, their images overlap. C, A smaller pinhole restricts light from a single object point to a smaller spot in the image. D, Object points can be closer together before their images overlap, and thus the image contains more detail. This analysis ignores diffraction effects. (Illustrations developed by Kevin M. Miller, MD, and rendered by C. H. Wooley.)
Each object point produces a 2-mm-diameter spot in the image. These spots are called blur circles. This term is somewhat misleading because off-axis object points technically produce elliptical spots in the image. In addition, this analysis ignores diffraction effects that make the spot larger and more irregular. Regardless, each object point is represented by a blur circle in the image. The farther the image is from the pinhole, the larger the blur circle in the image. To the extent that these blur circles overlap, the image detail is reduced (blurred).
To some extent, the loss of detail is mitigated with the use of a smaller pinhole (Fig 1-11C and D). A smaller pinhole gives a dimmer, but more detailed, image. However, the smaller the pinhole, the more that diffraction reduces image quality.
Although a smaller blur circle preserves more detail, the only way to avoid any loss of detail is to produce a perfect point image of each object point. Theoretically, if a perfect point image could be produced for every point of an object, the image would be an exact duplicate of the object. A perfect point image of an object point is called a stigmatic image. Stigmatic is derived from the Greek word stigma, which refers to a sharply pointed stylus.
Loss of detail occurs in lens and mirror imaging as well, because light from an object point is distributed over a region of the image rather than being confined to a perfect image point (Fig 1-12). Generally, lenses focus light from a single object point to a spot 10–100 µm across. This is better than a typical pinhole, but the shape of the spot is very irregular. The term blur circle is especially misleading when applied to lenses and mirrors. A better term is point spread function (PSF), which describes the way light from a single object point is spread out in the image.
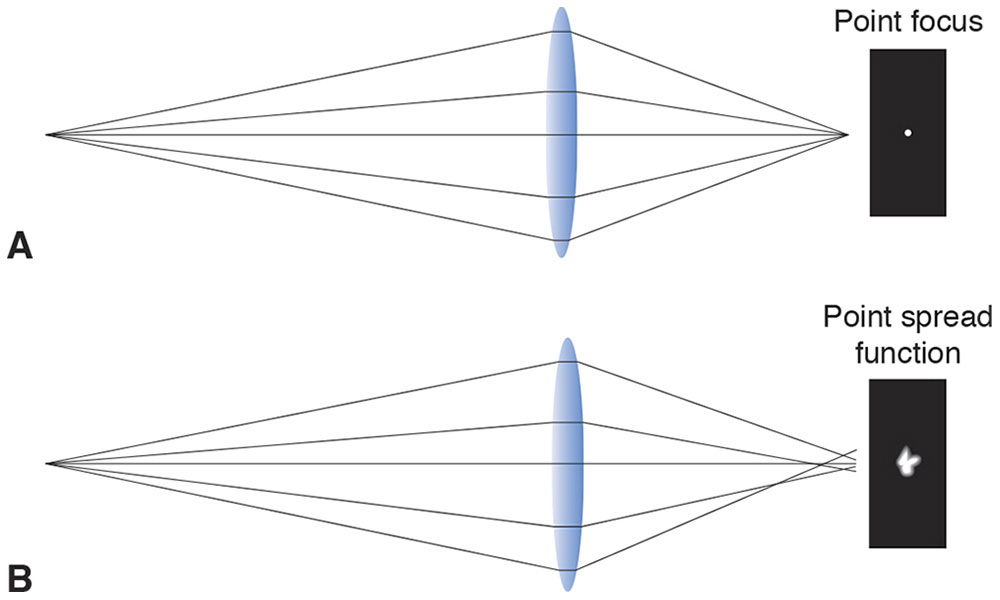
Figure 1-12 A, Textbooks often illustrate images produced by lenses as stigmatic. B, In most cases, however, the images are not stigmatic. The point spread function reveals how faithfully an imaging system reproduces each object point. (Illustration developed by Kevin M. Miller, MD, and rendered by C. H. Wooley.)
To summarize, a stigmatic image is a perfect point image of an object point. However, in most cases, images are not stigmatic. Instead, light from a single object point is distributed over a small region of the image known as a blur circle or, more generally, a PSF. The image formed by an optical system is the spatial summation of the PSF for every object point. The amount of detail in an image is related to the size of the blur circle or PSF for each object point. The smaller the PSF, the better the resemblance between object and image.
Light Propagation
An intensive investigation of light propagation was begun in the late 1500s. Numerous experiments measuring light deviation were conducted, and the data were collected and summarized as laws. These laws are described in the following sections.
Optical Media and Refractive Index
Light travels through a variety of materials, such as air, glass, plastics, liquids, crystals, some biological tissues, the vacuum of space, and even some metals. A medium is any material that transmits light.
Light travels at different speeds in different media. Light moves fastest in a vacuum and slower through any material. The refractive index of an optical medium is the ratio of the speed of light in a vacuum to the speed of light in the medium and is usually denoted in mathematical equations by the lowercase letter n. The speed of light in a vacuum is 299,792,458 m/s. This speed is approximately equal to 300 million meters per second, or 186,000 miles per second. In 1983, the Système International defined a meter as the distance light travels in a vacuum during 1/299,792,458 of a second. (This concept is discussed in greater detail in Chapter 8.) Refractive index is always greater than or equal to 1. In computations, it is often easier to work with the refractive index of a material than directly with the speed of light.
The refractive index,
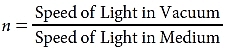
is quite sensitive to a material’s chemical composition. A small amount of salt or sugar dissolved in water changes its refractive index. Because refractive index is easy to measure accurately, chemists use it to identify compounds or determine their purity. Glass manufacturers alter the refractive index of glass by adding small amounts of rare earth elements. Until recently, clinical laboratories screened for diabetes mellitus by measuring the refractive index of urine. Table 1-1 lists the refractive indices of various tissues and materials of clinical interest.
Table 1-1
Refractive index varies with temperature and barometric pressure, but these changes are usually small enough to be ignored. One exception is for silicone polymer. The refractive index of polymerized silicone at room temperature (20°C) differs enough from its index at eye temperature (35°C) that manufacturers of silicone intraocular lenses (IOLs) have to account for the variation.
Refractive index also varies with wavelength. As discussed in Chapter 8, physical optics regards light in the spectrum of electromagnetic waves. The visual system perceives different wavelengths of light as different colors. Long wavelengths appear red, intermediate wavelengths appear yellow or green, and short wavelengths appear blue. In a vacuum, all wavelengths travel at the same speed. In other mediums, short wavelengths usually travel more slowly than long wavelengths. This phenomenon is called dispersion.
In the human eye, chromatic dispersion leads to chromatic aberration. If yellow wavelengths are focused precisely on the retina, blue light will be focused in front of the retina and red light will be focused behind the retina. (See Clinical Example 1-3.)
Some media, such as quartz, are optically inhomogeneous. That is, the speed of light through the material depends on the direction of light propagation through the material.

Figure 1-13 Chromostereopsis is demonstrated by this illustration of red and blue print on a black background. The illustration is not very dramatic unless rendered on a computer monitor or projected onto a screen. (Illustration developed by Kevin M. Miller, MD, and rendered by C. H. Wooley.)
Clinical Example 1-3
You may notice that red objects appear nearer than blue objects when they are displayed against a black background (Fig 1-13). This effect stands out in slide presentations that are rich in red and blue text and is known as chromostereopsis. It occurs because the human eye has approximately 0.5 D of chromatic aberration. Even individuals with red-green color blindness can observe the effect. To bring red print into focus, the eye must accommodate. To bring blue print into focus, the eye must relax accommodation. As a result, red print appears closer than blue print. The accommodative effort required to bring the various pieces of a chromatic image into focus imparts a 3-dimensional quality to the image.
Law of Rectilinear Propagation
The law of rectilinear propagation states that light in a homogeneous medium travels along straight-line paths called rays. The light ray is the most fundamental construct in geometric optics. Of particular note, rays traversing an aperture continue in straight lines in geometric optics. As stated earlier, a bundle of light rays traveling close to each other in the same direction is known as a pencil of light.
The law of rectilinear propagation is inaccurate insofar as it does not account for the effect of diffraction as light traverses an aperture (see Chapter 8). The basic distinction between physical and geometric optics is that geometric optics ignores diffraction because it is based on the law of rectilinear propagation. For clinical purposes, diffraction effects are rarely important. However, in situations for which diffraction effects are significant, geometric optics does not fully describe the image.
Optical Interfaces
The boundary between 2 different optical media is called an optical interface. Typically, when light reaches an optical interface, some light is transmitted through the interface, some is reflected, and some is absorbed, or converted to heat, by the interface. The amount of light transmitted, reflected, and absorbed depends on several factors.
Law of Reflection (Specular Reflection)
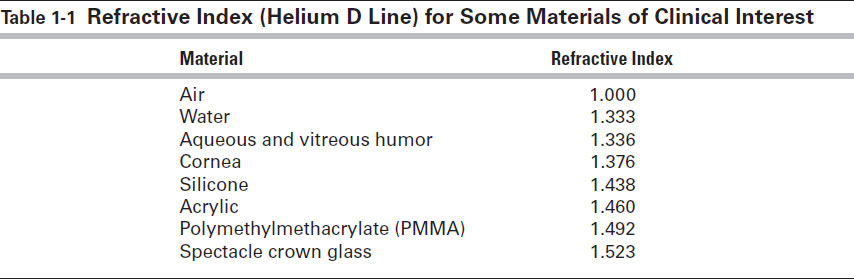
In specular reflection, the direction of the reflected ray bears a definite relationship to the direction of the incident ray. To express a precise relationship between incident rays and reflected rays, it is necessary to construct an imaginary line perpendicular to the optical interface at the point where the incident ray meets the interface. This imaginary line is a surface normal (Fig 1-14). The surface normal and the incident ray together define an imaginary plane known as the plane of incidence and reflection. The angle formed by the incident ray and surface normal is the angle of incidence, θi. This is not the angle between the incident ray and the optical interface. The reflected ray and the surface normal form the angle of reflection, θr.
Figure 1-14 The law of specular reflection. The angle of reflection (θr) is equal to the angle of incidence (θi) and lies in the same plane (in this case the plane of the paper) that contains the incident ray and the “normal” perpendicular to the surface. n1 = refractive index of initial medium; n2 = refractive index of reflecting medium. (Illustration developed by Edmond H. Thall, MD, and Kevin M. Miller, MD, and rendered by C. H. Wooley.)
The law of reflection states that the reflected ray lies in the same plane as the incident ray and the surface normal (ie, the reflected ray lies in the plane of incidence) and that θi = θr.
The amount of light reflected from a surface depends on θi and the plane of polarization of the light. The general expression for reflectivity is derived from the Fresnel equations, which are beyond the scope of this text. The reflectivity at normal incidence is simple and depends only on the optical media bounding the interface. The reflection coefficient for normal incidence is given by

The reflection coefficient is used to calculate the amount of light transmitted at an optical interface if absorption losses are minimal.
Law of Refraction (Specular Transmission)
In specular transmission, the transmitted ray’s direction bears a definite relation to the incident ray’s direction. Again, a surface normal is constructed, and the angle of incidence and the plane of incidence and transmission are defined just as they were for reflection (Fig 1-15). The angle formed by the transmitted ray and the surface normal is the angle of refraction, also known as the angle of transmission. The angle of transmission, θt, is preferred by some authors because the symbol for angle of refraction, θr, might otherwise be confused with that of the angle of reflection, θr.
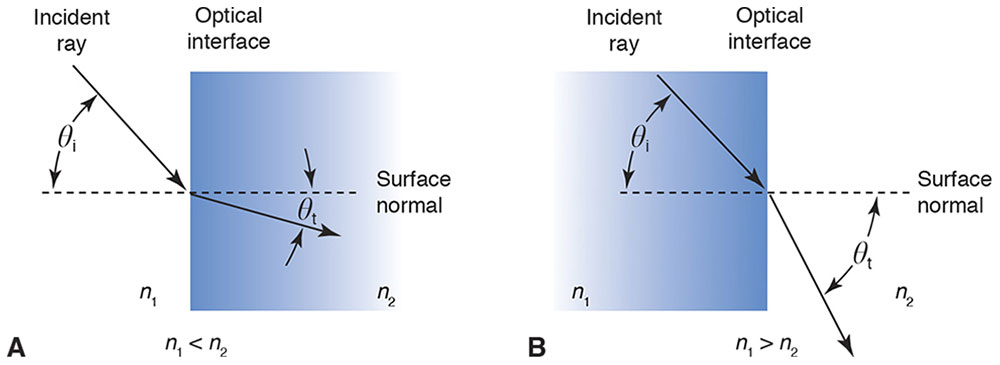
Figure 1-15 Light moving from a lower index to a higher one bends toward the surface normal (A), and that from a higher to a lower index bends away from the surface normal (B). (Illustration developed by Edmond H. Thall, MD, and Kevin M. Miller, MD, and rendered by C. H. Wooley.)
At the optical interface, light undergoes an abrupt change in speed that, in turn, usually produces an abrupt change in direction. The law of refraction, also known as Snell’s law in honor of its discoverer, states that the refracted, or transmitted, ray lies in the same plane as the incident ray and the surface normal and that
ni sin θi = nt sin θt
where
ni = refractive index of incident medium
θi = angle of incidence
nt = refractive index of transmitted medium
θt = angle of transmission (or refraction)
When light travels from a medium of lower refractive index to a medium of higher refractive index, it bends toward the surface normal. Conversely, when light travels from a higher to a lower refractive index, it bends away from the surface normal (Clinical Example 1-4; see Fig 1-15).
Clinical Example 1-4
Imagine you are fishing from a pier and you spot a “big one” in front of you a short distance below the surface of the water. You don’t have a fishing rod, but instead you are armed with a spear (Fig 1-16). How should you throw the spear to hit the fish?
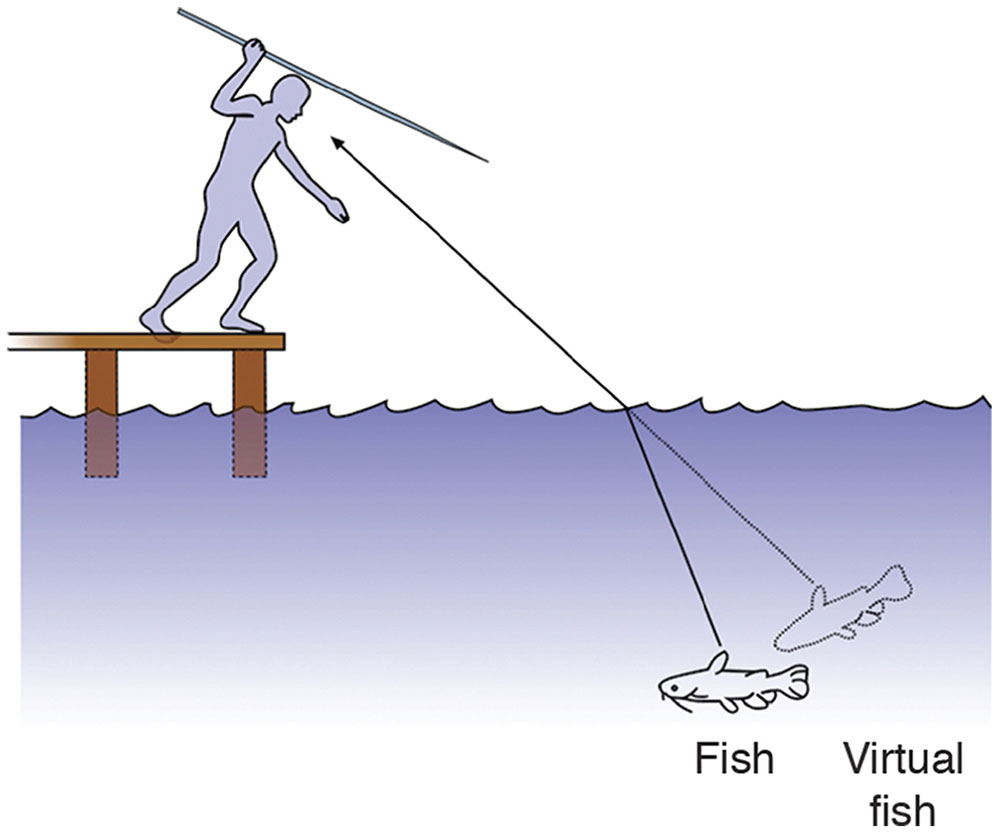
Figure 1-16 The fisherman must throw the spear in front of the virtual fish to hit the actual fish. (Illustration developed by Kevin M. Miller, MD, rendered by Jonathan Clark, and modified by Neal H. Atebara, MD.)
From your knowledge of Snell’s law, you know that the fish is not where it appears to be. If you throw the spear at the fish, you will certainly miss it. What you have to do is throw the spear in front of the virtual fish, the one you see, to hit the real fish.
Normal Incidence
Normal incidence occurs when a light ray is perpendicular to the optical interface. In other words, the surface normal coincides with the ray. If the interface is a refracting surface, the ray is undeviated. Light changes speed as it crosses the interface but does not change direction. If the surface reflects specularly, rays and pencils of light will be reflected back along a 90° angle to the surface.
Total Internal Reflection
Total internal reflection (TIR) occurs when light travels from a high-index medium to a low-index medium and the angle of incidence exceeds a certain critical angle. Under these circumstances, the incident ray does not pass through the interface; all light is reflected back into the high-index medium. The law of reflection governs the direction of the reflected ray.
Figure 1-17A shows a light ray traveling from a high-index medium (spectacle crown glass) into a low-index medium (air). In this situation, the transmitted ray bends away from the surface normal, and thus the angle of transmission exceeds the angle of incidence. As the angle of incidence increases, the angle of transmission increases to a greater degree. Eventually, the angle of transmission equals 90°. At this point, the ray grazes along the optical interface and is no longer transmitted (Fig 1-17B).
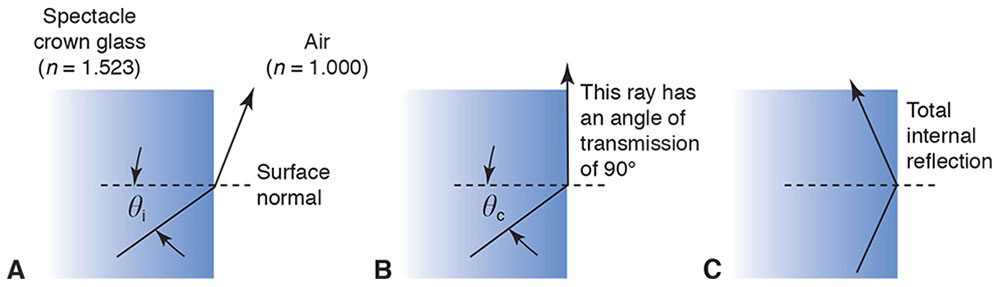
Figure 1-17 A, When light travels from a high-index medium to a low-index medium, it bends away from the surface normal. B, At the critical angle, θc, the refracted light travels in the optical interface. C, Beyond the critical angle, all light is reflected by the interface. In A and B, light is also reflected by the interface (not shown). (Illustration developed by Kevin M. Miller, MD, and rendered by C. H. Wooley.)
The critical angle is the angle of incidence that produces a transmitted ray 90° to the surface normal. The critical angle, θc, is calculated from Snell’s law:
ni sin θc = nt sin 90°
The sine of 90° is 1; thus,
ni sin θc = nt
Rearranging gives

So, the angle of transmission is 90° when the angle of incidence is
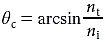
In the current example, ni = 1.000 and nt = 1.523, so the critical angle is 41.0°.
What happens when the angle of incidence exceeds the critical angle? As Figure 1-17C shows, the angle of transmission increases as the angle of incidence increases, but the angle of transmission cannot exceed 90°. Consequently, refraction cannot occur. Indeed, Snell’s law has no valid mathematical solution (in real numbers) when the critical angle is exceeded. Instead, the incident ray is 100% reflected.
TIR is a rather curious phenomenon. Consider light traveling from spectacle crown glass to air. If the angle of incidence is 10°, the light transmits easily as it crosses the interface. However, if the angle of refraction is 45°, the interface becomes an impenetrable barrier! The interface is transparent to some rays and opaque to others. Physicists have devoted considerable attention to this phenomenon.
TIR has great practical value. In the early 1600s, it was difficult to make a good mirror. The best surfaces could specularly reflect only about 80% of incident light, and the rest was diffusely reflected, which made these surfaces nearly useless as imaging devices. However, TIR is just that—total. When TIR occurs, 100% of the light is reflected. In the past, often the only way to make a practical mirror was to use internally reflecting prisms. Today, TIR is still used in prisms within binoculars, slit lamps, and operating microscopes, for example. Clinically, TIR is a nuisance when clinicians are trying to examine the anterior chamber angle. (See Clinical Example 1-5.)
Clinical Example 1-5
Total internal reflection (TIR) makes it impossible to view the eye’s anterior chamber angle without the use of a contact lens. Light from the angle undergoes TIR at the air–cornea interface (technically, the air–tear-film interface) (Fig 1-18A). Light from the angle never escapes the eye. Using a contact lens to eliminate the air at the surface of the cornea (Fig 1-18B) overcomes the problem. Light travels from the cornea (or coupling gel) to the higher-index contact lens. TIR never occurs when light travels from a medium of lower index to one of higher index, so light enters the contact lens and is reflected from the mirror. TIR does not occur at the front surface of the contact lens because the angle of incidence is less than the critical angle.
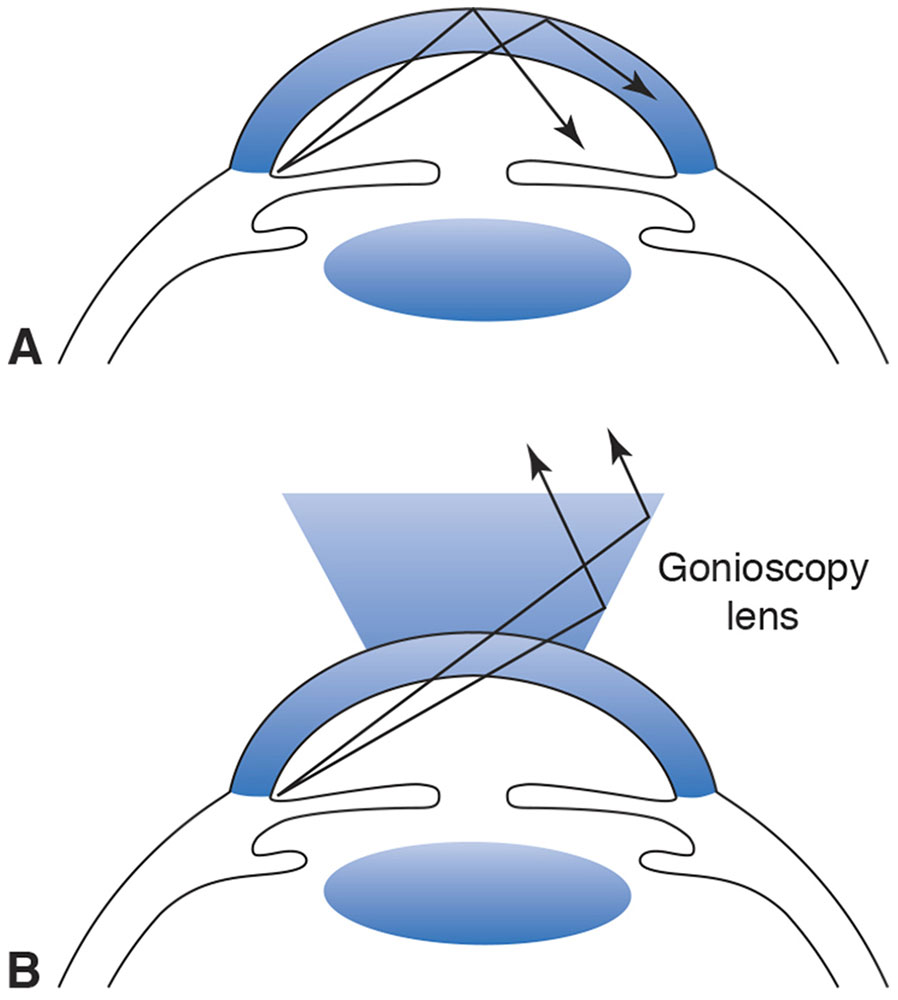
Figure 1-18 A, Light from the anterior chamber angle undergoes total internal reflection (TIR) at the air–tear-film interface. B, A contact lens prevents TIR and allows visualization of the angle structures. (Illustration developed by Kevin M. Miller, MD, and rendered by C.H. Wooley.)
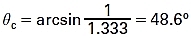
Assuming the refractive index of the tear film on the front surface of the cornea is 1.333, the critical angle for the air–tear-film interface is
From trigonometry, we can estimate the angle at which light rays from the trabecular meshwork strike the air–tear-film interface. The situation is illustrated in Figure 1-19 using average anatomical dimensions. We ignore the effect of the back surface of the cornea because this surface has relatively little power and we are performing only a rough calculation. From basic trigonometry,
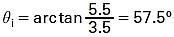
Interestingly, this rough calculation shows that θc is exceeded by only a few degrees. When the cornea is ectatic (as in some cases of keratoconus), the angle of incidence is less than θc and the angle structures are visible without a gonioscopy lens.
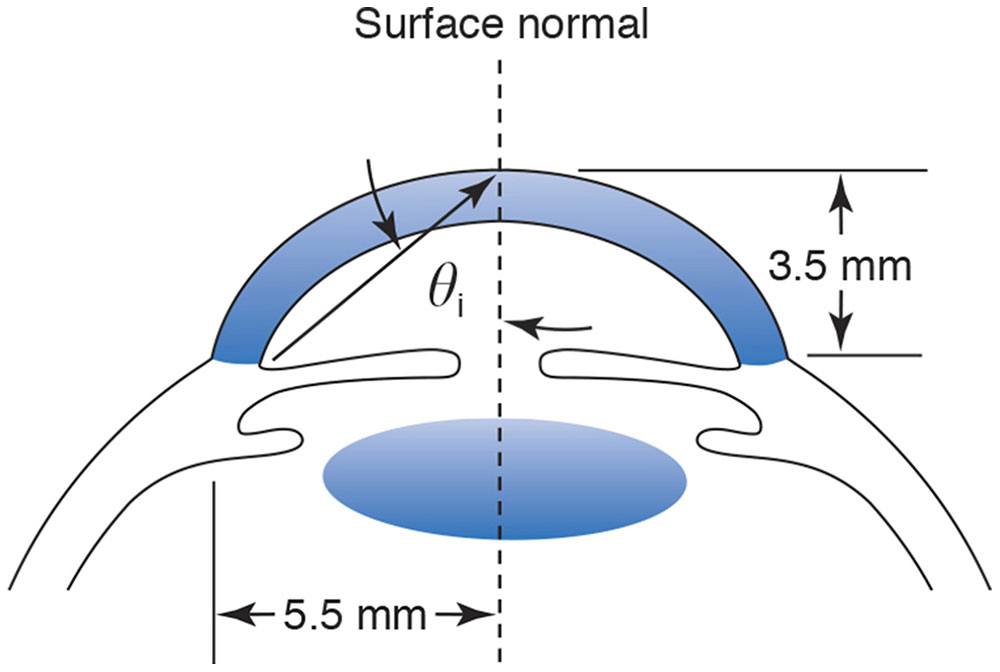
Figure 1-19 Average anatomical dimensions of the anterior segment. (Illustration developed by Kevin M. Miller, MD, and rendered by C. H. Wooley.)
Dispersion
With the exception of a vacuum, which always has a refractive index of 1.000, refractive indices are not fixed values. They vary as a function of wavelength. In general, refractive indices are higher for short wavelengths and lower for long wavelengths. As a result, blue light travels more slowly than red light in most media, and Snell’s law predicts a greater angle of refraction for blue light than for red light (Fig 1-20).
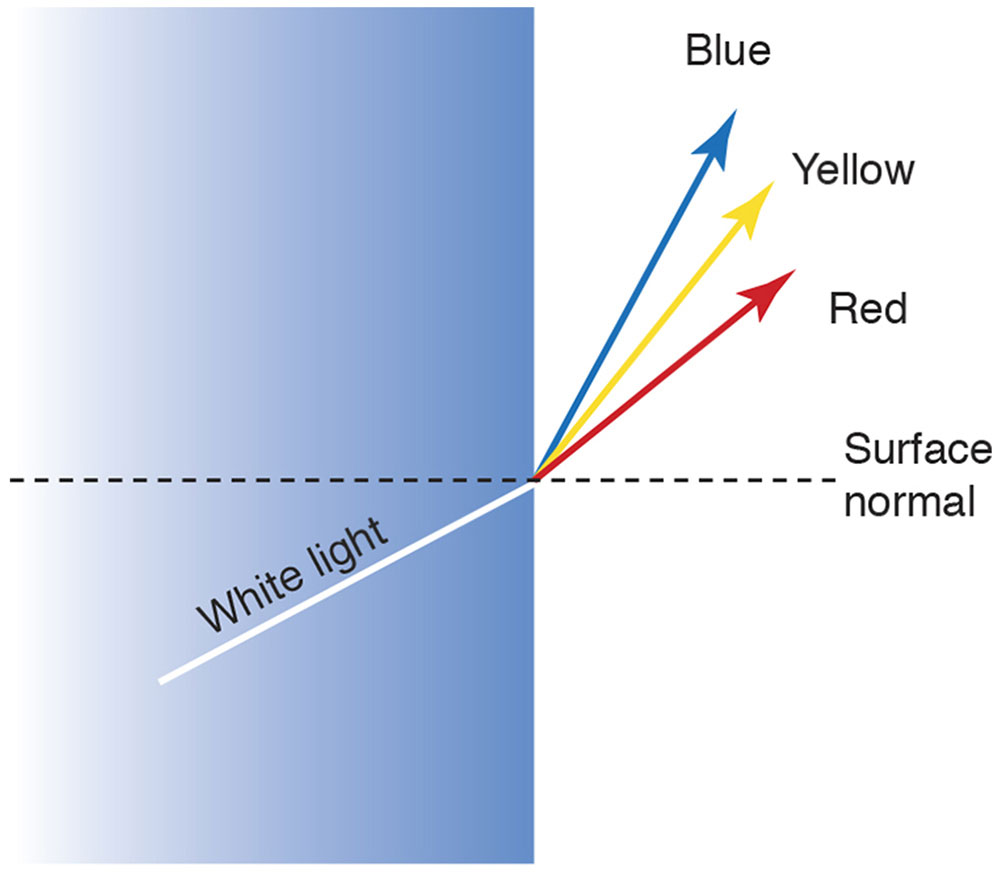
Figure 1-20 Chromatic dispersion. (Illustration developed by Kevin M. Miller, MD, and rendered by C.H. Wooley.)
The Abbe number, also known as the V-number, is a measure of a material’s dispersion. Named for the German physicist Ernst Abbe (1840–1905), the Abbe number V is defined as

where nD, nF, and nC are the refractive indices of the Fraunhofer D, F, and C spectral lines (589.2 nm, 486.1 nm, and 656.3 nm, respectively). Low-dispersion materials, which demonstrate low chromatic aberration, have high values of V. High-dispersion materials have low values of V. Abbe numbers for common optical media typically range from 20 to 70.
Reflection and Refraction at Curved Surfaces
For the sake of simplicity, the laws of reflection and refraction were illustrated at flat optical interfaces. However, most optical elements have curved surfaces. To apply the law of reflection or refraction to curved surfaces, the position of the surface normal must be determined because the angles of incidence, reflection, and refraction are defined with respect to the surface normal. Once the position of the surface normal is known, the laws of refraction and reflection define the relationship between the angle of incidence and the angles of refraction and reflection, respectively.
Although there is a mathematical procedure for determining the position of the surface normal in any situation, the details of it are beyond the scope of this text. For selected geometric shapes, however, the position of the surface normal is easy to determine. In particular, the surface normal to a spherical surface always intersects the center of the sphere. For example, Figure 1-21 shows a ray incident on a spherical surface. The incident ray is 2 cm above, and parallel to, the optical axis. The surface normal is found with the extension of a line connecting the center of the sphere to the point where the incident ray strikes the surface. The angle of incidence and the sine of the angle of incidence are determined by simple trigonometry.
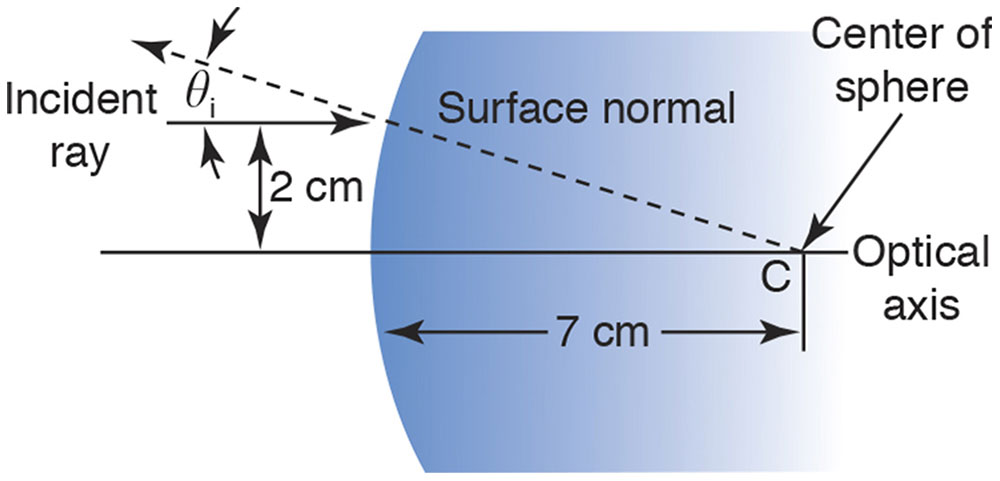
Figure 1-21 A ray 2 cm above and parallel to the optical axis is incident on a spherical surface. The surface normal is found by connecting the point where the ray strikes the surface to the center of the sphere (point C). The angle of incidence is found using similar triangles and trigonometry (arctan 2/7 = 16.6°). (Illustration developed by Edmond H. Thall, MD, and Kevin M. Miller, MD, and rendered by C. H. Wooley.)
The Fermat Principle
The mathematician Pierre de Fermat posited that light travels from one point to another along the path requiring the least time. Both Snell’s law of refraction and the law of reflection can be mathematically derived from the Fermat principle. This principle is summarized below and further detailed in Appendix 1.2 at the end of this chapter.
Suppose that the law of refraction were unknown, and consider light traveling from a point source in air, across an optical interface, to some point in glass (Fig 1-22). Unaware of Snell’s law, we might consider various hypothetical paths that light might follow as it moves from point A to point B. Path 3 is a straight line from A to B and is the shortest total distance between the points. However, a large part of path 3 is inside glass, where light travels more slowly. Path 3 is not the fastest route. Path 1 is the longest route from A to B but has the shortest distance in glass. Nevertheless, the extreme length of the overall route makes this a fairly slow path. Path 2 is the best compromise between distance in glass and total path length, and this is the path light will actually follow.
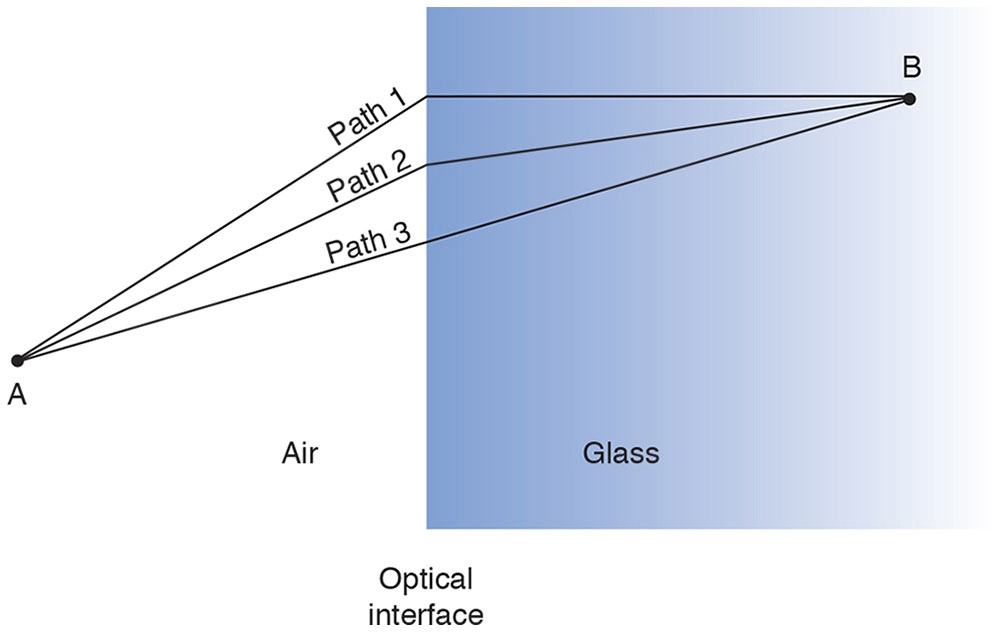
Figure 1-22 Light traveling from points A to B follows only path 2 because it requires the least time. Light does not travel along either path 1 or path 3. (Illustration developed by Edmond H. Thall, MD, and Kevin M. Miller, MD, and rendered by C. H. Wooley.)
Using mathematics beyond the scope of this text, it can be shown that the optimal path is the one predicted by Snell’s law. Thus, Snell’s law is a consequence of the Fermat principle.
Figure 1-23 shows light from an object point traveling along 2 different paths to the image point. According to the Fermat principle, the time required to travel from object to image point (or, alternatively, the optical path length, OPL) must be exactly identical for each path or the paths will not intersect at the image point.
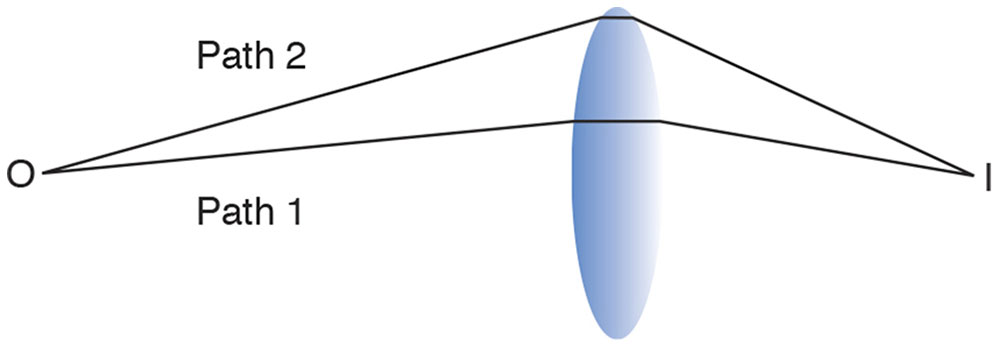
Figure 1-23 Light traveling the shorter distance from object (O) to image (I) point traverses a thick part of the lens. Light traveling the longer path 2 goes through less glass. If the lens is properly shaped, the greater distance in air is perfectly compensated for by the shorter distance in glass, and the time required to travel from object to image is identical for both paths. (Illustration developed by Edmond H. Thall, MD, and Kevin M. Miller, MD, and rendered by C. H. Wooley.)
Pinhole Imaging
The pinhole camera is the earliest (c. 400 BC) known imaging device. Creating your own pinhole camera is an easy and worthwhile exercise. You can make a viewing screen by taping a piece of waxed paper to a simple frame cut out of poster board or the backing of a pad of paper. Another method is to create a pinhole near the middle of a fairly large opaque material such as a large index card.
In a dark room, light a candle, hold the pinhole about 30 cm (≈1 foot) from the candle, and place the screen about 30 cm behind the pinhole. You should observe an inverted image of the flame on the screen.
There is an image anywhere behind the pinhole, so a pinhole camera requires no focusing. However, the image is often too faint to be observed. Increasing pinhole size brightens but also blurs the image.
If you replace the pinhole with a +8.00 D spherical convex trial lens, the image is much brighter but appears in only one location behind the lens. In fact, you will probably have to adjust the distance between the lens and screen to get a clear image. Lenses overcome the main disadvantage of pinhole imaging—faint images—but sacrifice the main advantage—no need to focus. For lenses, image location is crucial.
Locating the Image: The Lensmaker’s Equation
Increase the distance between the candle and lens to about 1 m (≈1.1 yard). You must move the screen closer to the lens to see a brighter, smaller image. Move the lens closer to the candle and the image is farther away from the lens.
The situation is shown schematically in Figure 1-24. The optical axis is an imaginary but well-defined line determined by rotational symmetry of the lens. The vertices V and V′ are the intersections of the axis with the lens surfaces. More important, the principal points P and P′ are major reference points used to define several other variables. Point P is the object principal point and P′ the image principal point. Object distance, o, is measured from P to the object, and image distance, i, is measured from P′ to the image (Fig 1-25). Note that the principal points are not the same as the vertices and do not even have to be “inside” the lens.
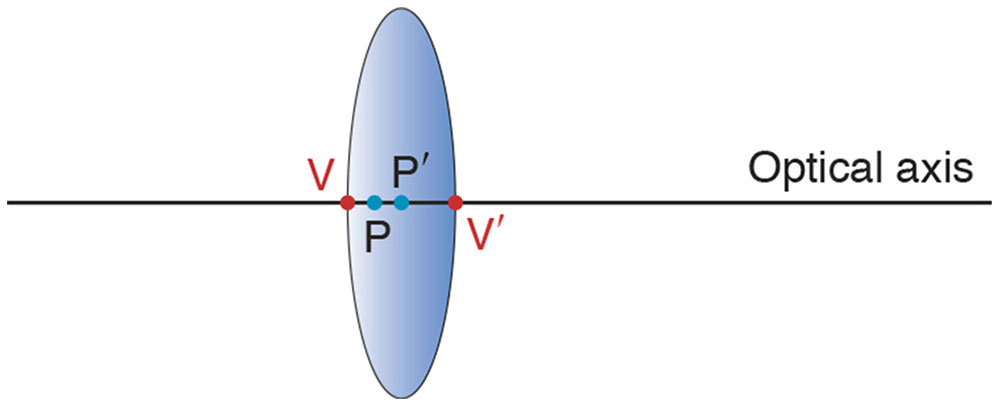
Figure 1-24 The optical axis is an imaginary but well-defined line defined by the lens’s symmetry. The vertices V and V′ are the points of intersection of the axis with the lens surfaces. In general, the principal points P and P′ do not coincide with the vertices. (Illustration developed by Edmond H. Thall, MD.)
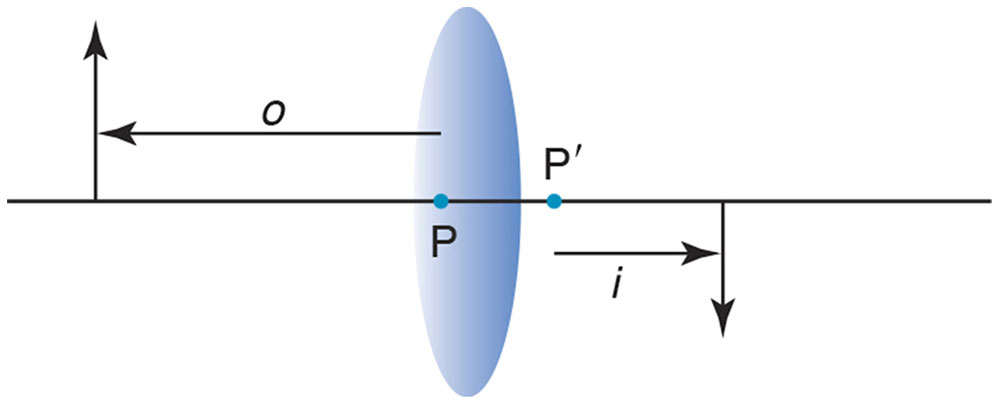
Figure 1-25 Definition of the variables in the lensmaker’s equation. Object distance, o, is measured along the axis from P to the object, and image distance, i, is measured along the axis from P′ to the image. The positive direction is left to right. (Illustration developed by Edmond H. Thall, MD.)
The image location can be calculated using the lensmaker’s equation (discussed below):

By convention, light travels from left to right, which is the positive direction. Suppose an object is 0.50 m in front of a +6.00 D lens. Because object distance is measured from P to the object, its direction is right to left, or negative. According to the lensmaker’s equation,
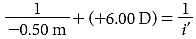
The unit diopter is a reciprocal meter, so 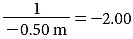 diopters
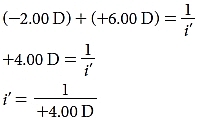
Again, because a diopter is a reciprocal meter,  meter
meter
i′ = +0.25 m
The lensmaker’s equation
The lensmaker’s equation (LME) is as follows:
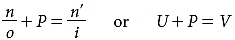
where the ratio n/o is the reduced object vergence (U) and the ratio n′/i is the reduced image vergence (V). The concepts of vergence and reduced vergence are discussed in detail in the section Ophthalmic Lenses.
The LME is one of the most important equations in ophthalmology. Unfortunately, it is also one of the most misused equations in ophthalmology.
Fundamentally, the LME says 2 things. First, the location of the image depends on the location of the object. Consider a specific example wherein the refractive index of a glass rod is 1.5 and the radius of curvature is 0.1 m. Suppose an object is in air with n = 1.0. The LME becomes
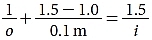
or
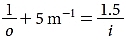
Note the units of reciprocal, or inverse, meters. Suppose the object is 1 m in front of the lens. Object distances are negative, so
Thus, the image is 37.5 cm behind the refracting surface.
Second, the LME establishes a relationship between the shape of the refracting surface and its optical function. The radius of the spherical refracting surface affects the image characteristics. The refractive power (or simply power) of a spherical refracting surface is

To demonstrate the significance of power, consider 2 spherical refractive surfaces, both constructed from glass rods (n = 1.5). Suppose that 1 refracting surface has a radius of 10 cm, as in the previous example, and the other has a radius of 20 cm. If an object is 1 m in front of each surface, where is the image? As shown in the previous example, the first surface has a power of 5.0 D and produces an image 37.5 cm behind the surface. The second surface has a power of 2.5 D and forms an image 1 m behind the refracting surface. Notice that the second surface has half the power, but the image is more than twice as far behind the refracting surface.
Refractive power, strictly speaking, applies to spherical surfaces, but the cornea is not spherical. In general, every point on an aspheric surface is associated with infinitely many curvatures. There is no such thing as a single radius of curvature. The sphere is a very special case: a single radius of curvature characterizes the entire sphere. A single radius can characterize no other shape, and refractive power should not be applied to a nonspherical surface.
In addition, power is a paraxial concept; thus, it applies only to a small area near the optical axis. Power is not applicable to nonparaxial regions of the cornea. In the paraxial region, imaging is stigmatic (ie, paraxial rays focus to a common point). Even for spherical surfaces, rays outside the paraxial region do not focus to a single point. That is, away from the paraxial region, rays do not focus as predicted when the LME is used.
For further information about first-order optics and the lensmaker’s equation, see Appendix 1.2 at the end of the chapter.
Ophthalmic Lenses
In this section, we build upon the basic principles of first-order optics to show how both simple lenses and complex optical systems are modeled. We also demonstrate how imaging problems are solved.
Vergence
We begin by considering the concept of vergence. Light rays emanating from a single object point spread apart and are referred to as divergent. Light rays traveling toward an image point, after passing through an optical lens, come together and are referred to as convergent. If rays are diverging, the vergence is negative; if rays are converging, the vergence is positive. Consider a lens placed close to an object point (Fig 1-26A). The lens collects a large fraction of the light radiating from the object point. When the lens is moved away from the object point, it collects a smaller portion of the light radiated by the object point. The rays that reach the lens are less divergent than they were when the lens was closer to the object (Fig 1-26B). Close to the object point, the light is more divergent; farther from the object point, the light is less divergent. Similarly, close to an image point, light is more convergent; farther from the image point, light is less convergent.
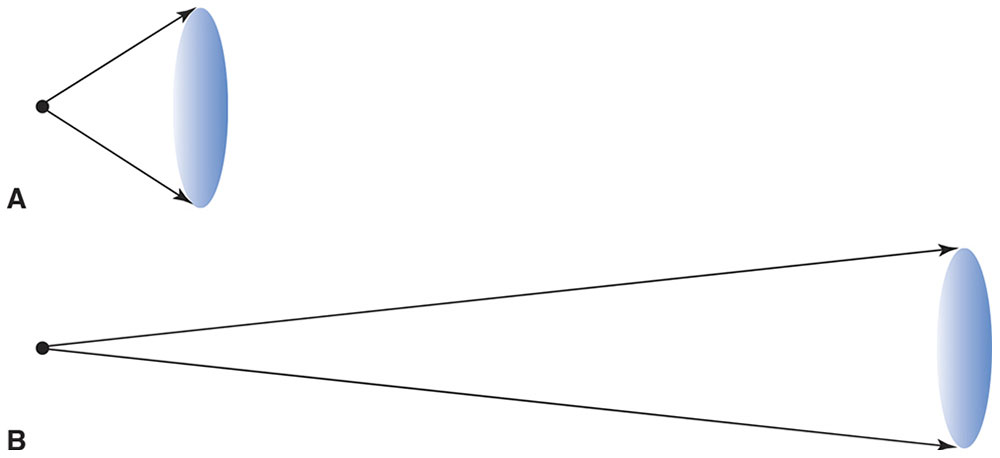
Figure 1-26 A, Close to an object point, light is strongly divergent, so a lens placed close to the object point collects a large fraction of the light radiated from the point. B, Farther from an object point, light is much less divergent, so a lens collects a much smaller portion of the light radiated by the object point. (Illustration developed by Kevin M. Miller, MD, and rendered by C. H. Wooley.)
Vergence is inversely proportional to distance from the object or image point. Vergence is the reciprocal of the distance. The distances used most often in ophthalmology are 4 m, 2 m, 1 m, 0.5 m, 0.33 m, 0.25 m, and 0.2 m. For convenience, the reciprocal meter (m–1) is given another name, the diopter (D). The reciprocals of these distances are, respectively, 0.25 m–1 (or 0.25 D), 0.5 m–1 (or 0.5 D), 1 m–1 (or 1 D), 2 m–1 (or 2 D), 3 m–1 (or 3 D), 4 m–1 (or 4 D), and 5 m–1 (or 5 D).
As light travels away from an object point or toward an image point, its vergence constantly changes. To calculate the vergence of light at any point, one must know the location of the object or image point. Conversely, if one knows the vergence at a selected point, the position of the object or image point can be determined.
Reduced Vergence
Reduced vergence is vergence multiplied by the refractive index of the medium. This term is confusing because reduced vergence is numerically larger than vergence. For example, 1 m in front of an image point, light traveling in glass (n = 1.5) has a vergence of +1.0 D but a reduced vergence of +1.5 D. Confusing or not, however, the term reduced vergence is too well entrenched to be changed.
The LME can be interpreted in terms of reduced vergence. Light from an object point diverges, but the degree of divergence decreases as the light moves farther from the object point. Eventually, the light encounters the refracting surface, and just as it reaches the surface, it has a reduced vergence of n/o. The refracting surface suddenly changes the light’s vergence by an amount equal to its power. As the light leaves the refracting surface, it has a reduced vergence of (n/o) + P, but because the light is converging to an image point, this must equal n′/i.
Calculations using the LME are inconvenient because they involve reciprocal distances. Vergence is a way to simplify the calculations. By means of reduced vergence, the LME,

can be written in a very simple form:
U + P = V
where U is reduced object vergence and V is reduced image vergence.
Consider an object in air 50 cm in front of a +5 D refracting surface with n = 1.5. Where is the image? Light diverging from the object has a negative vergence. When the light reaches the lens, it has a reduced vergence of –2 D. The lens adds +5 D, for a final reduced vergence at the lens of +3 D. The plus sign indicates that the light converges as it leaves the lens. Dividing the reduced vergence by the index of the glass gives a vergence of +2 D, so the image is 50 cm behind the refracting surface.
The most common mistake in working with vergence calculations is ignoring the negative sign for divergent light. One way to avoid this mistake is to deal with the signs first, rather than with the numbers. For example, to solve the previous problem, many people would begin by converting distance to diopters—that is, the object is 50 cm from the lens, so the vergence is 2 D. After this conversion has been performed, it is easy to forget about the minus sign. It is better to deal with the sign first. In this problem, begin by noting that light diverges from the object and has a negative value; then write down the negative sign and convert distance to vergence (–2 D). Always write the sign in front of the vergence, even when the sign is positive, as in the preceding example (+5 D and +3 D). If you encounter difficulties with a vergence calculation, check the signs first. The problem is most likely a dropped minus sign. (See Clinical Example 1-6.)
Clinical Example 1-6
Imagine you are having a difficult time outlining the borders of a subretinal neovascular membrane on a fluorescein angiogram. You pull out a 20 D indirect ophthalmoscopy lens and use it as a simple magnifier. If you hold the lens 2.5 cm in front of the angiogram, where is the image?
Light from the angiogram enters the 20 D lens with a reduced vergence of
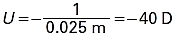
It exits the lens with a reduced vergence of
–40 D + 20 D = –20 D
The light is divergent as it exits the lens; thus, the virtual image you see is on the same side of the lens as the angiogram. It is located (1/20 D) = 0.05 m = 5 cm in front of the lens. Because the image is twice as far from the lens as is the object, the transverse magnification is 2×.
Thin-Lens Approximation
The LME concerns a single refracting surface, but, of course, lenses have 2 surfaces. According to the LME, when light from an object strikes the front surface of a lens, its (reduced) vergence changes by an amount equal to the power of the front surface, Pf. The vergence continues to change as the light moves from the front to the back surface; this is known as the vergence change on transfer, Pt. The back lens surface changes the vergence by an amount equal to the back-surface power, Pb. Thus,
The powers of the front and back lens surfaces are easily calculated, but the vergence change on transfer is difficult to calculate. However, because the vergence change on transfer is small in a thin lens, it is ignored to arrive at the thin-lens approximation. The total lens power is the sum of the front- and back-surface powers. Thus,

This is the thin-lens equation (TLE). Although the TLE and LME appear to be the same, there is an important difference. In the LME, P is the power of a single surface; in the TLE, P is the combined power of the front and back surfaces.
For example, if a +5 D thin lens has water (n = 1.33) in front and air in back and an object is 33 cm in front of the lens, where is the image? Light from the object strikes the lens with a reduced vergence of (–1.33/0.33 m) = –4 D. The lens changes the vergence by +5 D, so light leaves the lens with a vergence of +1 D, forming an image 1 m behind the lens.
The transverse magnification is the ratio of reduced object vergence to reduced image vergence. In the preceding example, the magnification is –4×, indicating that the image is inverted and 4 times as large as the object.
Lens Combinations
Most optical systems consist of several lenses. For instance, consider an optical system consisting of 2 thin lenses in air. The first lens is +5 D, the second lens is +8 D, and they are separated by 45 cm. If an object is placed 1 m in front of the first lens, where is the final image and what is the transverse magnification?
In paraxial optics, the way to analyze a combination of lenses is to look at each lens individually. The TLE shows that the first lens produces an image 25 cm behind itself with a magnification of –0.25. Light converges to the image and then diverges again. The image formed by the first lens becomes the object for the second lens. The image is 20 cm in front of the second lens; thus, light strikes the second lens with a vergence of –5 D and forms an image 33 cm behind the second lens. The transverse magnification for the second lens alone is (–5 D/3 D) = –1.66. The total magnification is the product of the individual magnifications –1.66 × –0.25 = 0.42.
It is absolutely essential to calculate the position of the image formed by the first lens. Only after locating the first image is it possible to calculate the vergence of light as it reaches the second lens.
Any number of lenses can be analyzed in this way. Locate the image formed by the first lens and use it as the object for the second lens. Repeat the process for each subsequent lens. The overall transverse magnification is the product of the transverse magnifications produced by each individual lens.
Virtual Images and Objects
Many people find the subject of virtual images and virtual objects to be the most difficult aspect of geometric optics. Virtual images and objects can be understood with the use of a few simple rules. The trick is to not “overthink” the subject.
Consider an object 10 cm in front of a +5 D thin lens in air (Fig 1-27A). Light strikes the lens with a vergence of –10 D and leaves with a vergence of –5 D. In this case, unlike in all the previous examples, light emerges with a negative vergence, which means that light is still diverging after crossing the lens. No real image is produced. The reader can easily verify this by repeating the basic imaging demonstration with a +5 D spherical convex trial lens. Notice that an image does not appear, no matter where the paper is held.


