Color Vision
Anthony J. Adams
Wayne A. Verdon
Bruce E. Spivey
INTRODUCTION
We live in a world of objects made up of an almost infinite array of colors. Or do we? It can be surprising to learn that the world is not colored, but that our brain is responsible for generating the colors we see.
Of course, a real objective difference does exist between a red and a green apple because color is determined in large part by the composition of light that enters the eye after being transmitted through or reflected off objects. However, many properties of the human eye and brain influence the color name that we give the object. Some of the physiologic processes of color perception are now understood in terms of the way light energy is transformed and coded into color signals and the way those signals are interpreted in the visual system.
Not all humans see colors the same way. Most of us are resigned to occasional arguments about whether a carpet is beige or cream-colored. However, individual differences in color perception can be more profound and more important. Almost 10% of the male population and approximately 0.5% of the female population have defective color vision that makes it difficult for them to discriminate some colors—or at least more difficult than normal. This so-called color blindness is one of the most common of all genetic defects and has fascinated geneticists, vision scientists, and medical practitioners. Great advances have been made in understanding the genetics of normal and congenitally defective color vision. We now know the precise gene coding sequence for the rod and cone photopigments, and we understand more about variations in normal color vision and the underlying pigment changes that account for color vision defects. Very few people, perhaps 1 in 10,000, are truly color blind (that is, they see everything in shades of gray), but even the previously mentioned 10% of color-defective males and the 0.5% of color-defective females who do see color yet fail on tests of “color blindness” are likely to be precluded from engaging in certain occupations that require normal color vision (e.g., becoming policemen, firemen, pilots, or drivers).
In this chapter, we present some of the results of physiologic and psychophysical studies made on encoding color vision signals in the visual system. Further, we relate these findings to the color discrimination of normals and color defectives in an attempt to understand why there are these differences between the two groups and discuss these differences in the context of clinical testing of color vision.
The radiant energy that gives rise to the sensation of vision is a very narrow section of the electromagnetic spectrum (Fig. 1), with the wavelength of light being less than one ten-thousandth of a millimeter. The wavelength limits of visible light extend from the extreme violet end (wavelength approximately 400 nm or four ten-thousandths of a millimeter) to the extreme red part of the spectrum (wavelength 700 nm). Yet within this range, the human eye is able to distinguish many different color sensations.
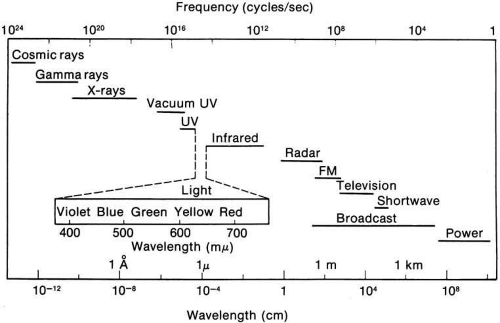 Fig. 1 The radiant energy (electromagnetic) spectrum. (Adapted from McKinley RW [ed]: IES Lighting Handbook. New York: Illuminating Engineering Society, 1947) |
Light also has particle properties and wave characteristics; the radiant energy can be considered as extremely small discontinuous particles of energy called quanta. The energy in a quantum is directly proportional to the frequency of the electromagnetic energy. Consequently, high-frequency violet light (400 nm) contains twice the energy per quantum as radiation at 800 nm.
In 1666 Isaac Newton spread the spectral components of normal white sunlight across the wall of his room by allowing a shaft of white light to pass through a small glass prism. A repetition of this simple experiment will illustrate a number of important aspects of color vision to be considered in some detail later in this chapter (Fig. 2, in color). If your vision is normal, you will note first that the ends of such a spectrum (violet and red) are quite dim compared with the middle of the spectrum (yellow and green). The fact that the middle appears to be the brightest suggests that the eye is not equally sensitive to all wavelengths. Second, as you move your eyes across the color spectrum, you will find two areas in which, for a given space (or number of nanometers), you seem to perceive more than the usual number of different colors. One of these areas is in the blue and green region; the other in the yellow region. This phenomenon suggests that the eye is able to make finer discrimination between adjacent wavelengths in certain sections of the spectrum. Third, you will probably find that the region of the spectrum that looks the least colored or most like white lies in the yellow portion of the spectrum (approximately 570 nm).
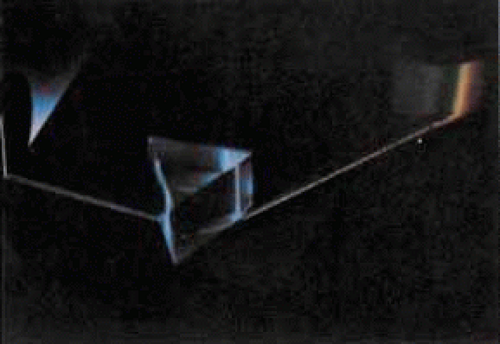 Fig. 2 A slit of white light is broken into its spectral components by a glass prism. (Fritz Goro, Life Magazine ©1944 Time Inc.) |
The foregoing are the observations of people with normal color vision. The same spectrum when viewed by many color–-vision-defective subjects will result in different observations. For example, in contrast to normal subjects, color-defective subjects may see the range of light waves that would normally be green as the brightest part of the spectrum. They may see the area that normally would be blue–green as the most like white, and they may be unable to make color distinctions in what would ordinarily be the green through red region. All of these variations in observations may be understood in terms of differences in color-vision mechanisms between normal and hereditary color defectives.
The various theories about how humans perceive color and light developed slowly. Newton’s interest in the subject did not stop at prisms. He speculated that light sets up vibrations in the optic nerves that are tuned to respond to each color. Approximately 100 years later, Thomas Young decided that to postulate the existence in the retina of an almost infinite number of receptors was to ignore some basic facts.1
If an individual had to have a very large number of color receptors—one for each color sensation—then at a particular point in the retina, where he or she is able to distinguish one colored object from another, he or she would have to have a complete set. This arrangement would call for an area so large that objects would have to be very far apart to distinguish them. Because we know that this is not the case—the eye has good resolution and can distinguish between things that are very close together—it becomes difficult to conceive of a way in which that many receptors could be piled into as small a location as is indicated by our excellent spatial resolution.
Instead, Young proposed three resonator groups responding maximally to one of three principal colors. Helmholtz, in the mid-19th century, elaborated on this theory and pointed out that although each receptor responded maximally to a particular region of the spectrum, they all responded over practically the entire spectrum.2 In such a scheme, the various color sensations would be the result of the relative strengths with which the three groups of receptors were stimulated. Color vision would thus require a limited number of receptors of different but overlapping spectral sensitivity and a neural system that compares the output of different receptor types.
Even though Helmholtz and, later Hering, proposed the elements of these requirements more than a century ago, until very recently their theoretic contributions were seen as mutually exclusive.3 Hering and Helmholtz seemed to see it this way also.
Hering proposed that there were three kinds of “catching material,” two substances providing signals about color and one signaling blackness or whiteness. The three substances were responsible for producing warm (white, yellow, red) and cold (black, blue, green) color sensations. Hering explained this in terms of a warm color being paired with cold color in each substance (yellow–blue, red–green, white–black). Light had two opposing actions: catabolism produced the warm colors, anabolism the cold colors. The theory was primarily aimed at accounting for the six distinct sensations that appeared to be paired in everyday sensations of color (e.g., a red afterimage follows exposure to green light).
De Valois and De Valois have pointed out that the long arguments and confusion about the Helmholtz and Hering theories were aided by the unfortunate fact that Hering proposed that the opponent process occurred at the receptor level.4 Today, there is considerable evidence that in the normal eye there are three separate receptor types, as Young and Helmholtz proposed, and subsequent neural pathways that compare the outputs of the different receptor types (spectrally opponent interactions), much like the organization that formed the basis of Hering’s proposal.
The presence of three cone receptors in the normal human retina is entirely consistent with the so-called trichromacy of vision that was known even before Newton’s time and quantitatively established by Maxwell.5 Maxwell’s carefully performed color-matching experiments showed that all spectral colors could be matched with some mixture of three primary colors chosen from the red, green, and blue regions of the spectrum. These and subsequent studies supported the description of the normal color vision as requiring three independent variables. With the recent advances in molecular genetics and refinement of psychophysical techniques to assess color vision, the presence of only three cone pigments is coming under scrutiny. Whether all color-normals have the same three cone pigments and whether an individual can possess more than three cone pigments are at the forefront of color science.
ANATOMY AND PHYSIOLOGY OF COLOR VISION
PHOTOPIGMENTS
The first steps of vision involve the absorption of quanta by bleachable photopigments. The photopigments are located in the outer segments of either rod or cone photoreceptors in the retina. The pigments in the cones are important for color vision. Each pigment molecule consists of a protein part, the opsin, and 11-cis retinal, a chromophore. Once the chromophore absorbs a quantum, it changes to the all-trans form. This then causes a shape change in the visual pigment molecule, which activates the pigment and initiates the phototransduction cascade, which eventually leads to the generation of visual signals that leave the eye. Whether a quantum is absorbed by a pigment, or whether the quantum retains its energy and is simply transmitted through the cone, depends on the wavelength of the quantum and on the spectral tuning property of the pigment molecule.
Human color vision can be approached by considering the three major classes of cones, designated S, M, and L. The letters are abbreviations for short wavelength-sensitive (S), medium wavelength-sensitive (M), and long wavelength-sensitive (L). The cone types refer to the broad regions of the spectrum over which each pigment absorbs. It is important to observe that the classical designations of blue, green, and red cones are no longer used because they are misleading. Although recent studies have shown that there are multiple variations within the L and M families of pigments within the color normal retina, it is still useful to consider color vision from the point of view of prototypical S, M, and L pigments.
Measurements of human M and L cone pigments are shown in Figure 3. Individual cone outer segments were sucked into a suction micropipette recording electrode. The electrode records the circulating photocurrent in the outer segments of individual photoreceptors.6 At each wavelength across the spectrum, the amount of energy is found that gives a criterion electrical response. To plot the spectral sensitivity of each cone, the inverse of this energy is plotted against wavelength. Figure 3 shows that both L and M pigments are sensitive to a broad range of wavelengths. They are certainly not sensitive to only the parts of the spectrum that we would name as red and green. The wavelengths of peak absorption of the L and M pigments are approximately 530 nm and 560 nm. The human S pigment (not shown) peaks at approximately 420 nm.
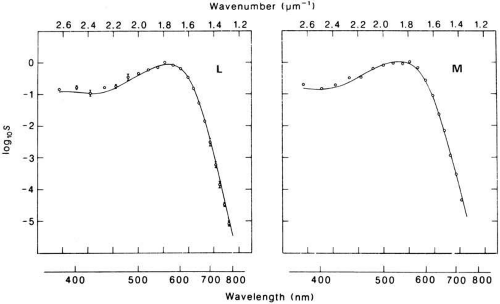 Fig. 3 Spectral sensitivity of human cones measured by the suction electrode technique. Average of five L cones (left) and a single M cone (right). The solid lines are derived from macaque monkey cones using the same technique. (Reprinted with permission from Schnapf JT, Kraft TW, Baylor DA: Spectral sensitivity of human cone photoreceptors. Nature 325: 439, 1987. Copyright 1987, Macmillan Magazines Ltd.) |
In the living eye, the spectral tuning of the cones is further shaped by the spectral absorption of the ocular media through which light must pass before reaching the retina. The principal structures that reduce sensitivity are the crystalline lens and the macular pigment (for foveal vision). The lens absorbs strongly in the UVA region, and it ultimately limits visibility at short wavelengths. As we age, the crystalline lens absorbs more and more short wavelength light and it acts as a yellow filter. Note in Figure 3 that the cone pigments themselves are quite sensitive at short wavelengths. The macular pigment, composed of lutein and zeaxanthin, is present in the central 5 degrees of the retina and it has a peak absorption at 460 nm.7 Macular pigment absorbs very little light at wavelengths shorter than 400 nm or longer than 520 nm, hence it too appears yellow (giving the macula lutea its name).
Figure 4 shows the best estimates of the human cone spectral sensitivities in the living eye.8,9 Average estimates for lens and macular pigment absorptions have been used. To generate a set of so-called fundamental curves such as these, a number of measurements are usually considered. Importantly, the proposed curves must be consistent with human color vision, particularly color-matching behavior (discussed later). In addition, the fundamentals should be consistent with physiological measurements such as suction electrode studies, microspectrophotometric estimates of human cones, and human dichromatic color vision. Note that the sensitivity to short wavelengths appears reduced compared to the pigment curves in Figure 3. As discussed previously, this is caused by the media absorption. The relative heights of the curves reflect the relative numbers of each cone type in the normal trichromatic eye.
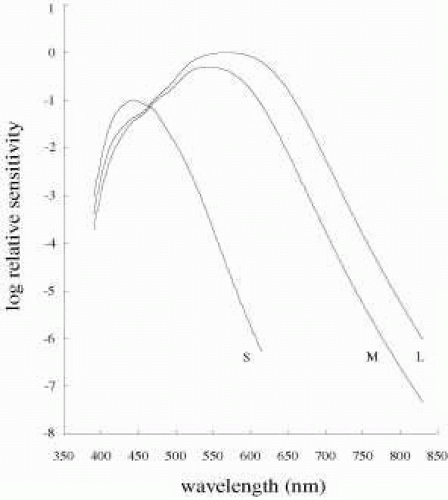 Fig. 4 Estimates of human cone fundamentals underlying normal color vision. The heights of the curves reflect the relative numbers of S, M, and L cones. Data are based on normal trichromatic color matching data, and on data from dichromats and blue cone monochromats. The optical density of cone pigments and the lens and macular pigment absorptions have all been taken into consideration in generating these fundamentals. Data are energy-based. From the tabulated data of Stockman and Sharpe (http://www.cvrl.ioo.ucl.ac.uk/). (Stockman A, Sharpe LT, Fach CC. The spectral sensitivity of the human short-wavelength cones. Vision Res 39, 2901–2927, 1999; Stockman A, Sharpe LT. Spectral sensitivities of the middle- and long-wavelength sensitive cones derived from measurements in observers of known genotype. Vision Res 40, 1711-1737, 2000.) |
CONES AND CONE ARRAYS
The principle of univariance states that information about a photon’s energy or wavelength is lost once it is absorbed by a photopigment molecule.10 This crucial fact means that each cone is color blind. In other words, an individual cone can signal an increase or decrease in activity but it cannot distinguish whether the change in activity results from a wavelength shift or an intensity change. How then can an array of color-blind receptors provide information about the wavelength content of a stimulus? The answer is that each of the three cone types has a different response to the stimulus because of its spectral sensitivity, and by comparing the outputs from different cone types, a second-order neuron can separate out a change in wavelength from a change in intensity. For example, at constant luminance, a wavelength shift from 500 nm (green) to 490 nm (blue) will increase stimulation of S cones while decreasing stimulation of M and L cones. If the S, M, and L signals are compared, the direction of the wavelength shift can be discerned. However, an intensity change of a 500 nm light will increase (or decrease) the stimulation of all three cone types. Therefore, comparing outputs from cones or arrays of cones is essential for color vision.
M and L cones are morphologically indistinguishable, and they comprise more than 90% of all cones. S cones, however, tend to be fatter than the other cone types, particularly in the region of the inner segment, and they make up less than 10% of the 5 million cones in a human eye.11. There are approximately twice as many L cones as M cones, although individual variation occurs within the color normal population.12,13 Overall, the ratio of S:M:L is approximately 1:5:10.
S cones are absent from the central 20 minutes of arc of the central foveola. This S–cone-free zone corresponds to the size of a 20/80 letter. The S cones do not contribute to detailed visual resolution, and their absence from this small central region allows optimal L and M cone packing, thereby maximizing spatial sampling.14 The consequence to color vision is that color normals are tritanopic for very small stimuli centered on the fovea. The density of S cones is greatest at 1 to 2 degrees from the fovea. Figure 5 shows the cone distributions and the S cone mosaic in a donor human eye. The density of L and M cones declines steeply away from the fovea. Although overall cone density is by far greatest at the fovea, cones are present across the entire retina.
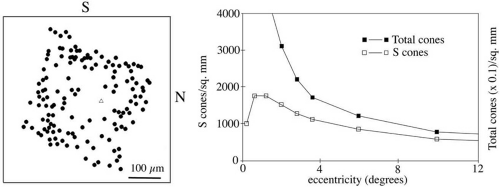 Fig. 5 A: Locations of individual S cones in human retina. The center of the foveola is indicated by a triangle. The central 100μm is devoid of S cones. S, superior; N, nasal. B: Distributions of S cones and of L plus M cones across the retina. The peak density of S cones is at approximately 1 to 2 degrees eccentricity. The cone density scale for L and M cones is compressed by a factor of 10 relative to the scale for S cones. (Redrawn from Curcio CA, Allen KA, Sloan KR, Lerea CL, Hurley JB, Klock IB, Milam AH: Distribution and morphology of human cone photoreceptors stained with anti-blue opsin. J Comparative Neurol 312: 610-624, 1991. Copyright © 1991 Wiley-Liss, Inc., A Wiley Company. Reproduced with permission of John Wiley and Sons, Inc.) |
Recently adaptive optics has allowed direct visualization of the human cone mosaic. The technique compensates for aberrations of the eye, allowing previously unattainable spatial resolution. Combined with selective bleaching (using colored lights to differentially bleach cone populations) the mosaic of S, M, and L cones has been revealed.13 Figure 6a shows an image of the retina centered close to the fovea. Figure 6b shows a pseudo color image in which individual S, M, and L cones are colored blue, green, and red. Statistical analysis reveals that in humans S, M, and L cones appear randomly distributed15.
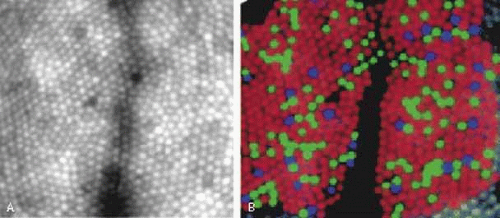 Fig. 6 A: Adaptive optics image of the retinal cone mosaic 1 degree nasal to the fovea. The retina was illuminated with 550 nm light. Approximately 50 images were averaged. The small circles are individual cone outer segments. B: Pseudo color image of the retinal cone mosaic. The colors red, green, and blue represent the locations of individual L, M, and S cones respectively. The subject and retinal region shown correspond to Figure 6A. Individual cone types were assigned using selective bleaching experiments. (From http://www.opt.uh.edu/research/aroorda/. The images were taken at the University of Rochester and are provided courtesy of Austin Roorda and David Williams.) |
HORIZONTAL CELLS
Horizontal cells are laterally connecting interneurons at the outer plexiform layer of the retina. They make synaptic connections with photoreceptors and bipolar cells. Two types of horizontal cell have been described in primate retina. H1 connects to L and M cones, but rarely S cones. H2 connects selectively to S cones and to L and M cones. Figure 7 shows a schematic of the circuitry in primate retina.16 Horizontal cells provide the lateral connections that create the center-surround receptive field (RF) structure of the bipolar cells. In lower vertebrates, for example fish, horizontal cells are chromatically opponent.17 This means that the horizontal cell hyperpolarizes to some wavelengths and depolarizes to other wavelengths. In contrast to this, intracellular recordings from primate retina clearly show that horizontal cells hyperpolarize to all wavelengths, and they therefore do not carry a chromatically opponent signal.18 No experiments have shown that H1 cells make cone-specific connections to just M cones or just L cones. H1 connections to L and M appear random, and this implies that the RF surround of midget bipolars should have a mixed L+M spectral response.
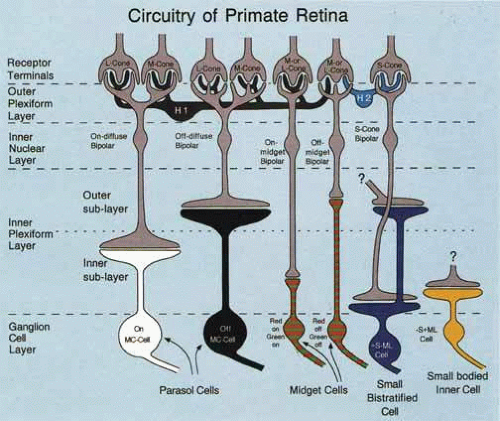 Fig. 7 Simplified circuitry of primate retina. The major retinal cell types and their connections are shown. Cones are designated as S, M, or L. Diffuse bipolars and midget bipolars are each present as ON and OFF types. A special S cone bipolar cell is shown. Ganglion cells are of the parasol (MC), midget (PC), or small bistratified (S cones, KC) types. (Reprinted from Lee BB: Receptors, channels and color in primate retina. In Backhaus WGK, Kliegl R, Werner JS (eds): Color Vision: perspectives from different disciplines. Berlin: Walter de Gruyter, 1998:79–88. Copyright 1998. Reproduced with permission of Walter de Gruyter Gmbtl & Co. KG.) |
BIPOLAR CELLS
The bipolar cells convey signals from photoreceptors to the ganglion and amacrine cells. Primate bipolar cells provide the first stage of separation of signals into the PC (parvocellular), MC (magnocellular), and KC (koniocellular) pathways. The pathways are named after specific target layers of the lateral geniculate nuclei. The three pathways are largely parallel with different anatomical connections and functional properties. With regard to color vision, the PC pathway appears to carry the red–green opponent signal and the KC pathway appears to carry the blue–yellow opponent signal. The MC pathway carries the luminance, or chromatically nonopponent, signal and it is not considered to play a role in color processing (for a review, see reference #).
Bipolar cells have a center-surround RF structure, with horizontal cells providing the connections by which the RF surround is constructed. There are three broad classes of primate bipolar cell. Diffuse bipolars synapse directly to multiple cones, and they feed to the chromatically nonopponent MC ganglion cells. Midget bipolars over much of the retina synapse directly to a single cone. This creates a “private line” from a single cone to a single midget bipolar to a single midget (PC) ganglion cell. Intracellular recording from a midget bipolar has shown strong red–green opponency.20 Therefore, midget bipolars have a RF center mechanism that has a spectral sensitivity of whatever single cone type feeds its center. The RF surround mechanism is expected to have a spectral sensitivity of L+M, because H1 cells connect to L and M indiscriminately, although experimental determination of this is still lacking. A third class of bipolar cell is the S-cone bipolar,21 which makes selective connections to S cones. Bipolar connections are shown in Figure 7.
Each foveal cone connects to at least four bipolar cells, an on diffuse, an off diffuse, an on midget, and an off midget (for a review see22). The on varieties respond with depolarization to increases in quantal absorptions in the receptive field center, and the off varieties respond by hyperpolarizing to increases in quantal absorptions in the RF center. On and off cells synapse at different sublayers of the inner plexiform layer.
AMACRINE CELLS
There are at least 40 types of amacrine cells, and they modulate the signal transferred between the bipolar and ganglion cells. There is no evidence for cone specificity in amacrine cells, that is, amacrine cells that receive input from just one of the three cone types. In macaque retina, the most studied amacrine cells are AI spiking amacrine cells and AII amacrine cells. Both types receive input from L and M cones and they have a spectral sensitivity similar to the photopic luminosity curve.20 No amacrine cell has shown chromatic opponency and no amacrine cell has revealed a strong S-cone input. The role of amacrine cells in color vision is still unclear.
GANGLION CELLS
We know more about the properties of ganglion cells than about most other retinal cell types. Extracellular techniques can be used to record ganglion cells’ action potentials. There are three major anatomical types of ganglion cell in primate retina, corresponding to the three bipolar types. Parasol ganglion cells project to the magnocellular layers of the LGN, and they are considered the anatomical substrate of the MC cells. These ganglion cells are spectrally nonopponent. Some properties of PC and MC ganglion cells are given in Table 1.
TABLE 1. Properties of PC and MC Ganglion Cells in Macaque Monkey Retina | ||||||||||||||||||||||||||||||||||||||||
|---|---|---|---|---|---|---|---|---|---|---|---|---|---|---|---|---|---|---|---|---|---|---|---|---|---|---|---|---|---|---|---|---|---|---|---|---|---|---|---|---|
| ||||||||||||||||||||||||||||||||||||||||
Midget ganglion cells project to the parvocellular layers of the LGN and they are considered to be the anatomical counterparts of PC cells (Fig. 7). These cells provide the substrate for red–green spectral opponency. In the central 10 degrees of the retina, each midget ganglion cell receives input from a single midget bipolar, which, in turn, receives input from a single L or M cone. The RF center is therefore cone-specific. Spectral opponency of the ganglion cell would ensure whether the RF surround, which is presumably established by outer retina circuitry,23 receives mixed inputs from L and M cones, or whether the surround somehow receives input from the single cone type that is not represented in the RF center. Whether the RF surround has a mixed L and M input or whether it receives input from a single cone type is an area of current debate.24,25
A third ganglion cell type, named small bistratified ganglion cells, underlies blue–yellow opponency. These cells have been recognized in macaque and human retinas.26 They receive a direct input from the S-cone bipolar at their innermost tier and input from an OFF bipolar cell at the outermost tier (Fig. 7). The OFF bipolar cell connects to L and M cones. Therefore, this cell type responds with an increased firing rate to blue increments of light filling the RF and by reduced firing to yellow increments (blue-ON-yellow-OFF). The center and surround of the RF are the same size, so this cell type shows no spatial opponency. More recently, newly identified small populations of ganglion cells have been shown to receive S-cone input.27 These ganglion cells may help to clarify the sources of the S-OFF signal and thereby help to complete the picture of retinal circuitry for the S-cone pathways.
LATERAL GENICULATE NUCLEUS
Ganglion cells project to one of the two lateral geniculate nuclei, where they synapse. Each LGN is a 12-layered structure with four layers of small cells (parvolayers) and two layers of large cells (magnolayers). Each of the six layers has a sublayer of cells called the koniocellular layer (Fig. 8). This anatomical arrangement reveals a corresponding functional separation.
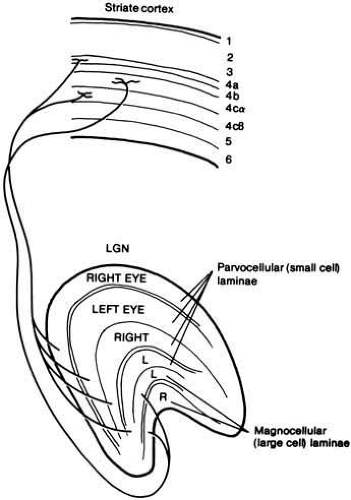 Fig. 8 Connections between the left lateral geniculate nucleus (LGN) and striate cortex (V1) of macaque monkey. LGN layers 1 and 2 are magnocellular laminae and layers 3 through 6 are parvocellular laminae. Spectrally opponent cells in the parvo layers project to striate layers 4cβ or 4a. Magno layers project to 4cα. (Adapted from Lennie P: Recent developments in the physiology of color vision. Trends in Neurosciences 7:243, 1984). Each of the 6 layers has a koniocellular sublayer that carries S cone signals to target layers I and III in primary visual cortex. |
Magnocellular LGN
Parasol retinal ganglion cells project to the MC layers of the LGN. Magnocells are spatially opponent but show no spectral opponency. Most of the cone input to these cells comes from L and M cones, although S cones do appear to contribute to both the receptive field center and surround.19 The spectral sensitivity of MC layers approximates the photopic luminosity function.
Koniocellular LGN
Small bistratified ganglion cells (those serving the S cone pathways) synapse in the KC layers of the LGN. The KC path has blue–yellow spectral opponency but little or no spatial opponency.
Parvocellular LGN
Approximately 80% of ganglion cells project to the parvocellular layers of the LGN. PC LGN cells are spatially and spectrally opponent. Their spectral opponency comes from antagonistic L and M cone inputs to the center and surround of their receptive fields. Although these cells demonstrate strong color opponency, they also show spatial opponency to luminance stimuli, ie, stimuli that vary in intensity but not color.4 Therefore it is highly unlikely that these cells are devoted to color processing alone.
The color responses of cells can be determined in a number of ways. A particularly useful characterization can be made by modulating a stimulus along different directions in color space and determining which color direction most excites a particular cell. The color space shown in Figure 21 (shown later) demonstrates this principle. The preferred color direction for a cell provides a signature, and it is possible to deduce from the signature which cone types input to a given cell.28 The LGN cells’ preferred directions in color space cluster into three groups. In general, KC cells respond best to isoluminant stimuli that modulate the S cone signals. PC cells respond best to isoluminant stimuli that modulate L and M cones without a change in S-cone stimulation. And finally, MC cells respond best to luminance (brightness) modulations.
Perceptually, humans can identify red, green, blue, and yellow colors that contain no trace of any other color. These are termed unique hues. A goal of the neurophysiology of color is to explain the cellular basis of color perception. The LGN PC pathway is the best candidate for red–green perceptual opponent color vision, and the KC pathway is the best candidate for blue–yellow perceptual opponency. However, the neurophysiological responses of both these pathways do not correlate well to our red–green and blue–yellow color vision. In other words, those stimuli that we perceive as unique hues do not correspond precisely to the preferred colors of the LGN MC and KC pathways. Therefore, we look to the visual cortex for another stage of color processing that might help explain the difference between the perceptual axes and the cells’ signature axes.
STRIATE CORTEX
The destinations of the retinocortical pathways PC, MC, and KC, are separate in primary visual cortex, or V1. PC cells project to layers IVcβ, MC to IVcα, and KC to layers I and III. At this stage, the signals from these pathways become mixed with the result that V1 cells do not show the clustering of signature color responses into the discrete groups of LGN cells.29 Rather, optimum responses can be found to almost any direction in color space. The majority of V1 inputs come from color-coded cells, so it is not surprising that V1 cells show some color selectivity. However, it is not clear whether a given cell is coding color per se, or whether its color tuning is a byproduct of, for example, spatial processing. Cortical cells are found with color preferences that correspond to unique hues. Furthermore, cortical cells show responses that are more narrowly tuned to colors than LGN and ganglion cells, and the more precise tuning appears more consistent with perceptual data.
BEYOND STRIATE CORTEX
There is much clinical evidence for a color center in the human brain.30,31 Reports show that lesions in certain brain areas can leave an individual in a colorless world, even though other visual attributes may be relatively intact, such as spatial vision, motion perception, and so on. The condition is referred to as cerebral achromatopsia. A number of attempts have been made to identify the area involved. In humans, functional magnetic resonance imaging (fMRI) suggests that the temporal lobe is involved in color processing.32 Clinical studies are consistent with this location. The evidence in macaque monkey is somewhat confused. Initial studies implicated the area V4 as being the color center,33 but not all researchers find the high incidence of color-selective cells.34 There certainly seems to be a chromatic organization beyond striate cortex, although the exact transformations and connections are not fully elucidated.
PSYCHOPHYSICAL ESTIMATES OF THE SPECTRAL SENSITIVITIES OF CONES
The earliest evidence about the spectral sensitivities underlying color vision comes from psychophysical experiments. The psychophysical studies that have been most useful in identifying the basic color mechanisms have in the main followed one of two approaches.
The first approach involves the measurement of spectral sensitivities of human color defectives known as dichromats. Based on the assumption that these people lack one of the normal subject’s three mechanisms and further that (like normal subjects) they also lack the S cone mechanism for very small targets at the fovea, it has been assumed that the dichromat’s sensitivity at the central fovea is determined largely by one mechanism. The protanope (lacking L cones) was assumed to have only the M cone mechanism, and the deuteranope only the L cone mechanism. Willmer and Hsia and Graham used this approach to identify two mechanisms with broad overlapping spectral sensitivities that peaked at about 540 and 580 nm (Fig. 9).35,36 These results are essentially in accord with the analysis made by Pitt of the color-matching functions of dichromats.37 Later, Blackwell and Blackwell measured the S cone mechanism in blue-cone monochromats, color-blind subjects who lack functional M and L cones.38 These monochromats had a peak sensitivity at 440 nm.
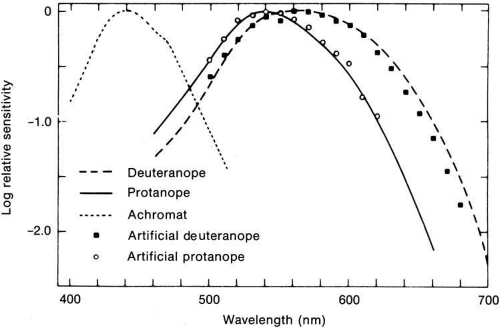 Fig. 9 Human foveal spectral sensitivities of three types of color-defective humans (curves). The data points are from normal subjects made temporarily color defective by immediate previous exposure to intense colored light and follow closely the curves from color-defective humans. The curves and data points probably reflect the spectral sensitivities of three kinds of cone systems. (Data from Willmer EN: A physiological basis for human colour vision in the central fovea. Doc Ophthalmol 9:235, 1955; Blackwell H, Blackwell O: Rod and cone receptor mechanism in typical and atypical congenital achromatopsia. Vision Res 1:62, 1961; Brindley GS: The effects on colour vision of adaptation to very bright lights. J Physiol [London] 122:332, 1953) |
The second approach involves the use of chromatic adaptation of normal subjects. It is based on the assumption that the sensitivity of one or two of the normal trichromat’s mechanisms can be reduced by exposure to certain colored backgrounds, leaving the remaining mechanisms relatively more sensitive to determine spectral sensitivity. Such experiments identify color mechanisms peaking at about 540 and 570 nm, agreeing reasonably with the functions found in dichromats.35,39
Undoubtedly, the most extensive application of the chromatic adaptation technique has been applied by Stiles.40,41,42,43 He measured threshold responses to spectral lights against relatively low-intensity monochromatic backgrounds and isolated a number of spectral sensitivity curves (π mechanisms). Three of the mechanisms peaked at 440, 540, and 580 nm and probably reflect the activity of the S, M, and L cones, respectively. Using a similar technique but with more intense colored backgrounds, Wald basically confirmed the Stiles results.44 Wald argued that his three functions were estimates of the absorption spectra of the cone pigments and that three of Stiles’ π mechanisms also were measures of the sensitivity of the cone mechanisms.
Color defectives and chromatic adaptation have each played an important role in the psychophysical inference of the cone spectral sensitivities in humans. At first glance it may seem surprising that we are able to measure the spectral sensitivity of a receptor type in color normal subjects, given that almost all second-order and subsequent neurons receive inputs from more than one cone type. The reason we can achieve relative isolation is that a strongly colored field will differentially adapt various cone types leaving one type substantially more sensitive than the others (see later). In the absence of strong chromatic adaptation, when a neutral (white) adapting field is used, the spectral sensitivity of the eye to increments reveals the antagonistic interaction between cones that characterize the opponent stage of color processing.45,46,47
NORMAL PERCEPTION OF COLORS
Trichromacy and color opponency brought together by a Zone model of color vision
In the latter part of the nineteenth century, Ewald Hering proposed an opponent color theory to account for the appearance of colors.3 Hering observed that a colored light cannot simultaneously elicit the appearance of red and green. The same is true for blue and yellow. In some way, red and green are opposite (or opponent) hues and blue and yellow are opposite hues. This idea eventually led to models of color vision in which the three cone types constituted the first, trichromatic stage, as postulated by Young and Helmholtz, to account for color mixture data, and a second opponent-processing stage, postulated by Hering to account for the opponent appearance of colors. Such a two-stage model (or “zone model”) incorporating these two different lines of thinking about color vision, it was hoped, would account for more color vision data than either one alone.
A simplified version of a zone model is shown in Figure 10. The model does not represent realistically the anatomical connections of the retina. The main features are the opposition (indicated by a minus sign) of S cone signals with a combination of L and M cone signals to generate a blue–yellow opponent channel, the opposition of L with M cone signals (with an input from S cones in the same direction as L signals) to generate the red–green opponent channel, and a luminance channel which sums (plus sign) the outputs of L and M cones.
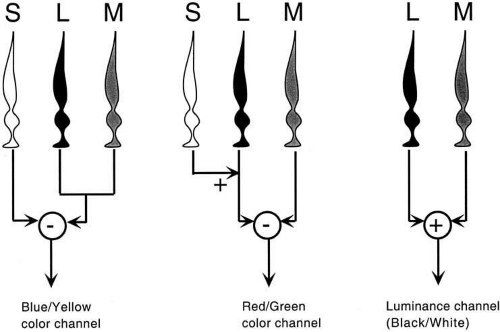 Fig. 10 A simplified zone model for color vision, showing how cone outputs (the first zone) are combined in a second zone to produce the color opponent signals. S cone signals oppose L and M signals to generate a blue–yellow opponent signal. L signals (with an S input) oppose M signals to generate a red–green opponent signal. L and M signals combine additively to generate a luminance signal. The diagram is not anatomically correct, and it simplifies numerous details. |
It is important to understand that the model is based on psychophysical evidence and the three identified channels are not necessarily identical to specific neural substrates. For example, luminance signals could be carried by different neural “streams” to the cortex and the stream responsible for color perception might change, depending on the spatial or temporal frequency of the visual stimuli or other stimulus factors. Similarly, the two color opponent channels of the model may share features with the responses of certain retinal ganglion cell types, but there are some important differences between color opponency in ganglion cells and perceptual opponency.
HUE CANCELLATION EXPERIMENTS AND COLOR OPPONENCY
More than 50 years after Hering put forward his ideas on opponent colors, Hurvich and Jameson measured the coloring power of spectral lights.48 They reasoned that if a light appeared red and there is a red–green color opponent channel, the redness could be canceled out by adding green to it. The amount of green required to neutralize the red would reflect the strength of the redness. By adding green light to red light, eventually a chromatic mixture could be made that contained neither redness nor greenness. The result would be a light that appeared unique yellow. Similarly, if there is a blue–yellow opponent channel, blue light could be used to cancel yellow and so on. Hurvich and Jameson determined hue cancellation functions for spectral lights of various wavelengths. The observer was provided with a 1-degree test stimulus consisting of a mixture of a monochromatic test wavelength and one of four fixed wavelength cancellation stimuli. The cancellation stimuli were close to the unique hues, red, green, blue, or yellow. For each test wavelength, the subject’s task was to adjust the intensity of one of the cancellation stimuli until the target appeared to be neutral between blue and yellow (unique red or unique green), or neutral between red and green (unique yellow or unique blue). The resulting curves, shown in Figure 11, are called hue cancellation or chromatic valence functions. In the Figure, if the subject used blue to neutralize the yellowness in a test wavelength, the value is negative because it opposes the yellow value that is plotted as a positive value (subjects never tried to use both blue and yellow to neutralize). Similarly, the value of red used is plotted as positive and green is negative. This was for the convenience of visualizing the data.
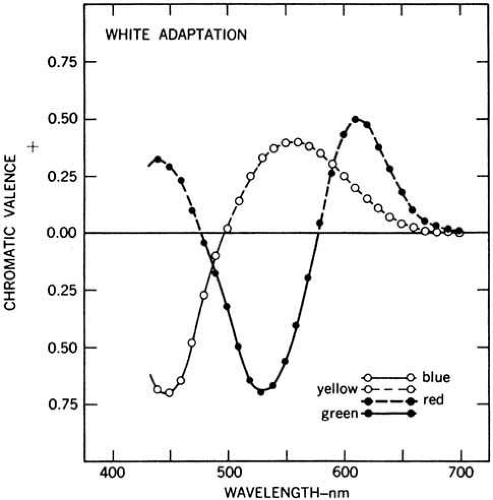 Fig. 11 Chromatic valence functions for the CIE standard observer. Observers view a monochromatic test light to which is added one of the four unique hues (blue, green, yellow, and red). The task of the observer is to adjust the intensity of the unique hue to make the test light appear either neutral between blue and yellow or neutral between red and green. At each test wavelength, a positive red value means the observer added green to neutralize the color. A negative green value means red was added. Similarly, a positive yellow means blue was added and a negative blue value means yellow was added. The curves show the relative amounts of red, green, blue, and yellow perceived in each wavelength of the spectrum. They also show that no wavelength is perceived to simultaneously contain both red and green, or both blue and yellow. For example, a 600-nm light, which appears “orange,” required the observer had to add green light to cancel the red component of the stimulus and blue light to cancel its yellow component. (From Wyszecki G, Stiles WS: Color science. Concepts and methods, quantitative data and formulae. New York: John Wiley and Sons, 1982. Copyright © 1982 Wiley-Liss, Inc., A Wiley Company. Reproduced with permission of John Wiley and Sons, Inc.)
Stay updated, free articles. Join our Telegram channel
Full access? Get Clinical Tree
 Get Clinical Tree app for offline access

|