Visual Adaptation
James N. Ver Hoeve
CONCEPTS OF ADAPTATION
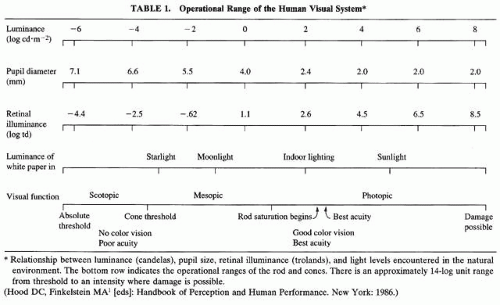
The visual system maintains exquisite sensitivity to small changes in light intensity across an enormous range of illumination levels. Natural lighting conditions under which vision is possible, for example, bright sunlight and starlight, can differ in intensity by a factor of 100 million, or 108Table 1 Laboratory studies show that the full operational range of the human visual system approaches a factor of one trillion (14 log units, or 1014). It must be remembered that for any background level, the light reflected from illuminated objects typically differs by less than a factor of 100.1,2 Indeed, the human visual system is capable of detecting local changes in brightness (i.e., “contrast”) of less than 1% (10-2). Thus a central problem faced by the vertebrate visual system is how to signal relatively small changes in luminance without being overwhelmed if the “input signal” increases several million-fold, as is likely over the course of a day.2,3 Visual adaptation refers to the action of mechanisms within the visual pathway that serve to maintain visual sensitivity under a wide range of illumination conditions.
 |
To achieve a large dynamic operational range, numerous adaptive changes take place within the visual pathway. The pupil controls, to a limited extent, the amount of light entering the eye. Two anatomically distinct retinae in the form of separate rod and cone photoreceptor systems are specialized for functioning in low or high ends of the operational range, respectively. Within the outer segment of the photoreceptor, the phototransduction cascade is regulated by background illumination level. The density of visual pigment within the outer segments of the photoreceptors is altered by background level and plays a significant role in determining sensitivity. Postreceptoral neural circuitry integrates and filters the output of the photoreceptors.
In general, all adaptation mechanisms reduce the response to light when background level is increased and, conversely, increase sensitivity when illumination is reduced. When background light level is low, the pupils dilate, the low threshold rod photoreceptors engage, and enhanced neural integration occurs across photoreceptors. At high background levels, pupillary constriction, activation of the cone photoreceptors, and reduced neural integration decrease the response to light. When adapted to low background levels, sensitivity is high, but with the cost of reduced spatial acuity and absent color vision. When adapted to high background levels, sensitivity to small changes in light is reduced with the benefit of increased spatial resolution and the ability to see color.
Impairment of adaptation mechanisms produces a loss of the ability to detect brightness differences (and hence the details of objects) under certain background light levels. The result is similar to the loss of image detail in an underexposed or overexposed photograph. An individual with congenital stationary night-blindness sees well in daylight but is unable to discriminate objects at twilight. Conversely, an individual with a cone dystrophy may be incapacitated by photophobia and poor acuity under daylight conditions, whereas vision in dim light is relatively unaffected. This chapter reviews the phenomenon of visual adaptation, its basic mechanisms, and its impairment in clinical disorders.
ADAPTATION PHENOMENA
Usually, we are unaware that adaptation mechanisms are profoundly altering our visual sensitivity. Moving a short distance away from this page may decrease retinal illuminance by a factor of 10 (1 log unit), yet the perceived brightness of the page and the contrast of the letters on the page remain relatively constant. We become aware of the limits of our visual adaptation mechanisms when faced with large, abrupt changes in background light level. An oft-cited example is that experienced on entering a dark theater on a bright afternoon. After some minutes of sitting in apparent darkness, the silhouettes of other theatergoers gradually appear. With further adaptation, some detail of faces may emerge. However, at low illumination levels, it would still be impossible to read the program. When first entering the theater, the differences in luminance contained in the retinal image initially could not be detected because the visual system was adapted to a high background level and therefore signals only large changes in brightness. After the visual system has adapted to the lower background level within the theater, sensitivity increases and thus the ability to signal much smaller changes in brightness. The process of adaptation to darkness takes about 40 minutes to complete, although a substantial improvement in vision occurs after about 10 minutes. These values reflect the recovery times of the rod and cone systems, respectively.
Once adapted to darkness, abrupt re-exposure to bright light results in a dazzling veil of brightness that also obliterates image detail. The dark-adapted visual system becomes highly sensitive to small changes in light. On stepping back outside from the theater, all light levels present in the image generate a maximal response, hence the differences in brightness needed to identify an object cannot be detected. After a much shorter time than for dark adaptation, sensitivity is adjusted, allowing perception of the brightness differences within the image.
Clinically, dark adaptation, or “bleaching” adaptation is the most frequency used method for assessing adaptation. Dark adaptation tracks the recovery of sensitivity in darkness following exposure to bright light, that is, a light sufficiently intense to convert the visual pigments to their bleached, or colorless form. Total dark adaptation is the state of highest sensitivity to light, which is attained only after about an hour in total darkness. Light adaptation refers to changes in visual system response properties as background illumination increases. As background illumination increases, color vision and spatial and temporal resolution improve dramatically; however, the threshold to detect faint lights becomes greatly elevated. The total dark-adapted eye is so sensitive that just several quanta can be reliably detected by a human observer.
SITES OF ADAPTATION
PUPIL
The pupillary aperture provides the first stage of sensitivity regulation by regulating the amount of light entering the eye. Pupil diameter, although contributing to the optimization of vision when background light level is changed, is grossly insufficient to account for the range adaptation present in the visual system. When specifying the amount of light energy present in the retinal image, the troland (Td), a luminance unit weighted by the area stimulated is used:
(1)
Td = L × A
where L is luminance (in candelas per square meter, or cd × m-2), and A is the area of the pupil (in square millimeters). Table 1 shows various useful relationships among luminance, retinal illuminance, pupil size, and visual function. Moving from complete darkness into bright light might cause the human pupil to constrict from 7 mm to 2 mm (Table 1). However, the ratio of the areas is less than 10 for these two pupil sizes. Hence, pupillary aperture can regulate the amount of light entering the eye only by about one log unit. This is grossly insufficient to account for the 14 log unit range of the visual system. In addition, it is apparent from Table 1 that above about 4.5 Td, the pupil has reached maximum constriction and thus can provide no additional regulation of light across the upper 4 log units of photopic luminance.
Several other observations of the pupillary response to light are of note. Pupillary response has a temporal course that does not precisely follow many documented psychophysical changes in sensitivity. Pupillary constriction begins about 200 msec after light onset and peaks at about 1 second.4 Complex changes in psychophysical thresholds occur within this time period5 (see section on temporal changes), implying the operation of adaptation mechanisms entirely independent of the pupil. In some instances, pupillary control mechanisms may actually impede adaptation. For example, following adaptation to high background levels, the pupil may remain constricted for some time after illumination decreases, during which time it can be shown that sensitivity continues to increase. Conversely, on entering a darkened area, the pupil dilates much faster than regeneration of visual pigment. Pupillary mechanisms enhance the light-gathering ability of the eye during the initial stages of dark adaptation, before the much slower biochemical changes within the photoreceptors begin to increase sensitivity. Thus, although the pupil makes important contributions to the adaptation process, regulation of the amount of light entering the eye provided accounts for only a small portion of the large dynamic range of the visual system.
DUPLEX RETINA
Duplex retinae contain separate, and largely independent, rod- and cone-mediated systems. These separate classes of photoreceptors are specialized for low and high levels of background lighting, respectively. The duplex retina thus greatly extends the operational range of the visual system. Table 1 shows the relationship between luminance in candelas per square meter (cd × m-2) and retinal luminance (Td), across the functional range of the human visual system. The dimmest light levels (approximately the lowest 3 log units on the scale, from absolute threshold to cone thresholds) are responded to exclusively by the rod-mediated, or scotopic, system. The entire operational range of the rods (ending at rod saturation) spans 8 log units. The brightest light intensities (approximately the upper 5 log units, from rod saturation to an intensity where damage possible) are responded to exclusively by the cone-mediated, or photopic, system. The entire operational range of the cones is 11 log units. The region of overlap between the scotopic and photopic function is referred to as mesopic,6
How do these two classes of photoreceptor alter sensitivity with ambient light level? First, the clinician ought to note the different wavelength sensitivities of the two systems and the distribution of photoreceptors in the retina. The absorption spectra of the rods and the three cone types is shown in Figure 1. These psychophysically determined curves are in excellent agreement with the measured spectra of the photoreceptor pigments. The sensitivity of the human observer to scotopic and mixed-cone stimulation is shown in Figure 2.
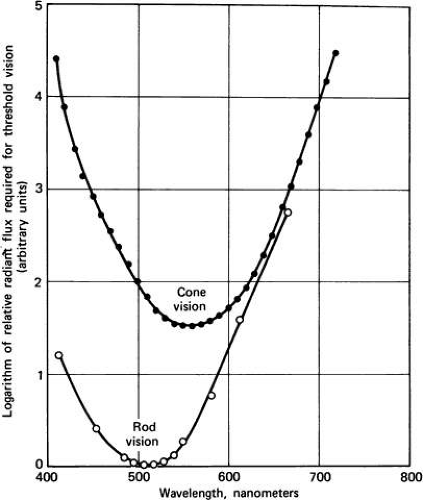 Fig. 1. Estimated sensitivity of rod and cone systems for different wavelengths of light. These curves are based on the results of various psychophysical experiments. The reader ought note greater overall sensitivity of the rod system and the difference in the maximal sensitivity (lowest threshold) as a function of wavelength for the two systems. The rod system is most sensitive to wavelengths of approximately 500 nm. The cone system is most sensitive to wavelengths of about 560 nm. (Geldard F: The Human Senses. 2nd ed. New York: Wiley, 1972.) |
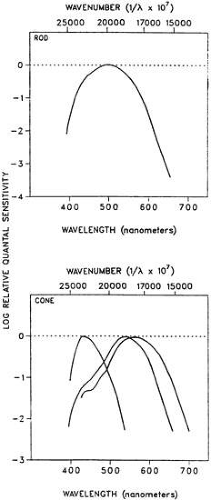 Fig. 2. Estimated absorption spectra of the rod (top) and the three cone photopigments. These curves are derived from human psychophysical experiments. All curves are normalized to their own maxima. (Based on data from Smith VC, Pokorny J: Spectral sensitivity of the foveal cone photopigments between 400 and 500 nm. Vision Res 15:161, 1975; presented in Hood DC, Finkelstein MC: Sensitivity to light. In Boff KR, Kaufman I, Thomas JP [eds]: Handbook of Perception and Human Performance, pp 1–5, 66. New York: Wiley, 1986.) |
At the most sensitive wavelength, around 510 nm, scotopic (rod) sensitivity is more than 1.5 log units more sensitive than the most sensitive photopic (cone) wavelength, approximately 530 nm (see Fig. 2). Understanding the effects of wavelength on sensitivity is necessary to predict sensitivity under dark-adapted conditions (see subsequent discussion).
The distribution of rods and cones varies considerably across the retina. Thus, the retinal location of the visual stimulus is critical for predicting the effects of adaptation. Figure 3 shows that the density of long- and medium-wavelength cones (sensitive to the red or green regions of the spectrum, respectively) drops off exponentially with distance from the fovea.7 Short-wavelength sensitive cones are distributed throughout the retina but spare the fovea. Rods are absent fovea, reach a peak density in the midperiphery, and greatly exceed cone density in the periphery. Therefore, both wavelength and retinal location of the stimulus are important factors in determining sensitivity to light and the state of adaptation. Clinical studies of dark adaptation typically present test stimuli at the 10 to 20 degrees eccentric to the fovea. At this eccentricity, rod density is at a maximum so that dark-adapted sensitivity may be measured at low backgrounds. However, cones are still plentiful at this distance from the fovea, thus assessment of cone sensitivity is not precluded at this eccentricity (see Fig. 3).
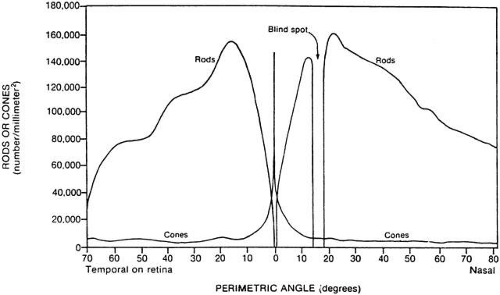 Fig. 3. Density of rods and cones across the retina. Cone density is greatest at the fovea and declines rapidly with eccentricity, although cones are present across the entire retina. Rods are absent in the fovea, reach peak in a parafoveal ring, and greatly outnumber cones in the periphery. (Osterberg G: Topography of the layer of rods and cones in the human retina. Acta Ophthalmol Suppl 6:1, 1935.) |
In animals with a different proportion of rods and cones than in humans, the scotopic and photopic ranges may be altered. For example, the cat has a rod/cone ratio approximately 100 times greater than humans and its rod system responds over the lower five log units of background levels whereas its cone system subserves adaptation over the upper three log units.2
Pigments
Photosensitive pigments consist of an opsin protein bound to the chromophore, retinal, which is derived from Vitamin A. There are four major visual pigments, one for the rods and one for each of the cone types: short-wavelength sensitive, medium-wavelength sensitive, and long-wavelength sensitive. Photopigment molecules are embedded in discs that make up the outer segment of the photoreceptor. There are approximately 1000 discs per rod photoreceptor. Each rod disc membrane can incorporate about 10,000 molecules of rhodopsin. Thus, there are about 1015 rhodopsin molecules in an eye, affording tremendous light-gathering capacity. One molecule of rhodopsin can be bleached by only one quantum of light. Once in the bleached, or transparent state, the molecule cannot capture any additional photons until it has regenerated. Bleached rhodopsin has a half-life of 5 minutes. Thus a 50% chance exists that a bleached rhodopsin molecule will have returned to the unbleached state at the end of a 5-minute interval. The depletion of photopigment by increased background level of illumination directly decreases system sensitivity. Although photopigment density is a significant factor in determining sensitivity changes across the operational range of the visual system, its role, particularly in the rod system is much smaller than originally thought (see section on mechanisms).
PHOTOTRANSDUCTION CASCADE
Light activation of visual pigment molecules located in the outer segments of the photoreceptors initiates a series of enzymatically catalyzed events that lead to the generation of a graded potential in the photoreceptors and eventually to an action potential in the optic nerve. The basic stages in phototransduction have been reviewed extensively.8,9,10 Briefly, absorption of a photon of light transforms rhodopsin, the purplish visual pigment of the rods, from its 11-cis form to a colorless, or “bleached,”all-trans form. The change in the pigment characteristics result from conformational changes in the opsin molecule on absorption of a quanta. Light-activated rhodopsin interacts with the G-protein, transducin, causing the release of guanosine diphosphate and binding to guanosine triphosphate. Transducin-bound GTP then activates cyclic guanosine monophosphate (cGMP) phosphodiesterase (PDE) resulting in the hydrolysis of cGMP to 5′-GMP. A decrease in cGMP levels caused by PDE activation results in closure of membrane channels thus decreasing the otherwise continuous inward flow of Na+ and Ca2+ ions that takes place when the photoreceptor is in the dark. The gating of the “dark current” by light produces a graded hyperpolarization of the photoreceptor. Once initiated, the reaction must be quenched. This is accomplished at least partly through the actions of rhodopsin kinase and arrestin. The hyperpolarized photoreceptor cell membrane influences second-order neurons (bipolar cells) by controlling release of the neurotransmitter glutamate from the synaptic terminal of the photoreceptor. The graded release of glutamate results in either a hyperpolarization or depolarization of the postsynaptic neuron, depending on whether the synapse is sign preserving or sign inverting.10 Although homologous mechanisms are believed to exist for cone transduction, they have been studied less extensively.
LIGHT ADAPTATION
There is obvious evolutionary advantage to be able to determine rapidly whether a pattern of light is a predator or prey independently of changes in illumination due to weather or time of day. In this section, the physical limitations inherent in the task of detecting patterns of light reflected from surfaces are considered in more detail.
The relationship between the illuminant and the light reflected from an object can be expressed as:
(2)
L = ρ(x,y) × E,
where L, the luminance variation in a scene, is the product of E, the intensity of the of the local illuminant, and ρ(x,y), which describes the reflectivities of the objects under view. That the relationship is multiplicative means that the contrast of illuminated objects is independent of the illuminant. Luminance contrast is defined as the difference between the maximum (Lmax) and minimum (Lmin) luminance weighted by their sum:
(3)
C = (Lmax – Lmin)/(Lmax + Lmin)
Applying this to the reflectivities [ρ(x,y)], of an illuminated object, we see that the contrast between any two points in the image is constant and thus independent of changes in the intensity of the illuminant, E.
140ý
(4)
(ρ(xi,yi) × Eρ(xj,yi) × E)/(ρ(xi,yi) × E + ρ(×j,yi) × E)= (ρ(xi,yi)- ρ(xj,yi))/(ρ(xi,yi) + ρ(×j,yi))216ý
The contrast, or the ratio between the luminance of any two points in the image, remains constant when illumination level is changed. This illustrates that a change in illumination levels, for example, a cloud drifting in front of the sun, or putting on sunglasses, does not alter retinal image contrast. For example, if A = 8 × 10⁵ Td, B = 2 × 10⁵ Td, the contrast would be (A-B) ÷ (B + A) = 0.6. If a dark cloud reduces the illuminant by a factor of 10,000, that is, C = 8 and D = 2, (C-D) ÷ (C + D) = 0.6. these relationships hold only for reflected light. If light is added to patterns displayed on self-luminous objects, such as a computer monitor’s screen, contrast decreases until the difference in light levels fall below the threshold for detection, at which point the pattern is no be longer visible.
Clearly, most useful information present in an image is in the form of contrast. Thus, an ideal visual system should extract information from the reflected light ρ(x,y) × E completely independent of E, the illuminant.3 As noted, the visual system approaches this ideal by adjusting its sensitivity to vary inversely with E. When the visual system adjusts sensitivity proportionately with background level it is said to follow Weber’s law (sometimes referred to as Weber fraction, or the Weber-Fechner relation). The visual system follows Weber’s law when the slope of the smallest detectable increment (ΔI) is constant (K) across background level (I) such as
(5)
ΔI/I = K
When average background luminance is low, the visual system is highly sensitive to small differences within ρ(x,y). When background luminance is high, a larger change in luminance is required for detection.
Weber’s law’s function can be thought of as a kind of “automatic gain control.” A type of automatic gain control circuitry is built into devices such as radio and television sets to keep the output of the set constant when the transmitted signal weakens or wavers. In the visual system, the gain, or amplification of small changes in light, is large when background is low and small when the background is high. Rushton11 proposed that a gain, or amplification stage early in the visual pathway could be regulated by a negative feedback signal, the strength of which is proportionate to the background level. The existence of a feedback signal would thus serve to optimize sensitivity of the system as background changed. Models of this type are generally of the form:
(6)
R/Rmax = I/I + σ
where the output (response, R, normalized to the maximum, Rmax) divided by itself plus a semisaturation constant, σ, the half-maximal response. The output of this system moves to an equilibrium over time preserving the response to a rapid change in input. It can be shown that these kinds of feedback gain-control models can accurately predict Weber-Law behavior under various conditions (for details, see earlier studies2,12,13,14,15).
An adaptation mechanism placed early in the visual pathway allows finer changes in brightness to be encoded by the limited firing rate of the optic nerve. Without adaptation gain control mechanisms, a ganglion cell must convert the eight log units of luminance (action potentials per second) into unique firing rates.16 This would either vastly exceed physiologic limits for the ganglion cell firing rate, or result in only gross changes in contrast being signaled. A gain control mechanism placed early in the visual pathways preserves the full capacity of rate-limited neural elements to signal variations in luminance around the current average background level and thereby avoid saturation. The visual system is not unique in this arrangement. Weber’s law relationships between background level and sensitivity occur early in the other sensory pathways, including the auditory, somatosensory, thermosensory, and chemosensory systems.
The precise nature of the feedback signal remains poorly understood. Horizontal cells have been considered likely candidates.17 However, although anatomically well-situated, their physiologic properties do not appear to be consistent with a gain control mechanism.18
The photoreceptors show electrophysiologic evidence of modulating their response with background level. Published evidence suggests that the drop in calcium within a rod after light exposure due to the closure of plasma membrane channels that prevent the influx of calcium while an active pumping mechanism involving sodium and potassium and calcium rapidly remove it.10,19 The effect of calcium on phototransduction is now known to be indirect through interactions with binding proteins that play a role in recovery of the resting levels of cGMP after a flash of light and the dampening of multiple cycles of transducin activation following photoactivation of rhodopsin. These mechanisms serve the roles of amplification, or gain, and regulation.
INCREMENT THRESHOLDS
In this section, methods for studying light adaptation experimentally and their implications for clinical testing are considered. The classic psychophysical method for studying light adaptation and Weber’s law is based on increment thresholds. The general psychophysical procedure in these tasks requires an observer to detect a small test flash that is briefly superimposed on a uniform background field of intensity, I. Psychophysically measured increment thresholds are derived from a plot of the percentage of correct detections for a range different intensities of the test flash. Threshold is defined as the point at which detection exceeds chance expectations (various curve-fitting and error estimation procedures are available to improve the accuracy of threshold calculation). These experiments can yield highly reliable data and have been used to investigate how sensitivity changes with background, eccentricity, wavelength, and other variables.
Figure 4 shows the increment thresholds to detect a spot of light superimposed on a uniform field of different levels. In this type of experiment, the uniform adaptation field had been viewed by the observer for a sufficient number of minutes to ensure that threshold measurements were consistent, that is, a stable adaptation level was reached. Thresholds are plotted for a wide range of background luminance levels and for two retinal eccentricities. In Figure 4, luminance units I, are weighted by the pupil area. This unit of luminance, the troland, is defined in the section on pupillary adaptation mechanisms. Note that there are several distinct segments to this curve. At very low levels of background illumination, the just-detectable luminance of the test flash on the background is a constant, that is, ΔI = K, and therefore does not follow Weber’s law. Moreover, when background luminance is low, sensitivity is greater at the 7-degree eccentricity than when tested closer to the fovea. This is explained by the greater proportion of the highly sensitive rod versus cone photoreceptors at this distance from the fovea.
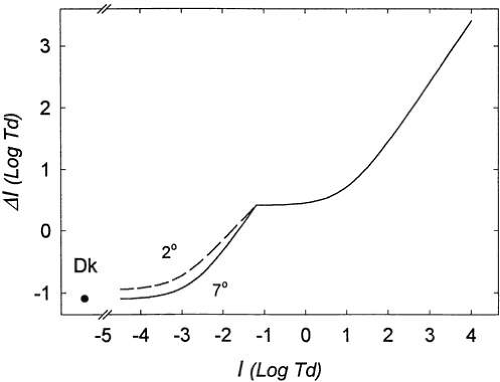 Fig. 4. Increment sensitivity as a function of background adaptation level. Two retinal test locations are shown, 2 and 7 degrees from the fovea. Threshold in the absence of a background is also shown (see text for details). |
The lower portion of the increment sensitivity curve, up to about -3 log Td for the 7-degree eccentric test in Figure 4, illustrates what Barlow20 termed “dark light.” In this range, the influence of the background light is negligible relative to the level of internal noise in the system. Potential sources of internal noise include random isomerizations of the photopigment molecules, spontaneous activity in outer segment membrane channels, and spontaneous neurotransmitter release. These internal events produce a sensation of light even in the complete absence of a background, often referred to as eigengrau, or “internal light”. This can be appreciated by carefully noting that, even in total darkness, the sensation of light is not entirely extinguished. Figure 4 also shows that whether there is no background (leftmost point), or whether the background light is less than 2 × 10⁻³ Td, threshold does not change. On the basis of this type of experiment, Barlow21 calculated that the “dark light” at absolute threshold is equivalent to about 1000 quanta/sec-1 delivered to the cornea, which after taking temporal differences and thresholds into account, predicts observed absolute threshold values of 100 quanta at the cornea.2 (After correcting for losses due to media and the probability a photon will be absorbed by a pigment molecule, it is estimated that absolute threshold requires absorption of approximately 6 quanta.)
In Figure 4 threshold begins to rise at a background level of about -3 log Td for the 7-degree eccentric test. As background level exceeds the eigengrau, threshold begins to rise. Before attaining behavior according to the tenets of Weber’s law, there is a transition zone, during which threshold rises with the square root of the background. This is referred to as the DeVries-Rose law portion of the light adaptation curve. Rose22 suggested that a slope following a square root law implied that threshold was limited by the quantal fluctuations that are inherent in any light source and limit sensitivity at these low background light levels. These relationships are shown in greater detail for the scotopic portion of the increment sensitivity curve in Figure 5.
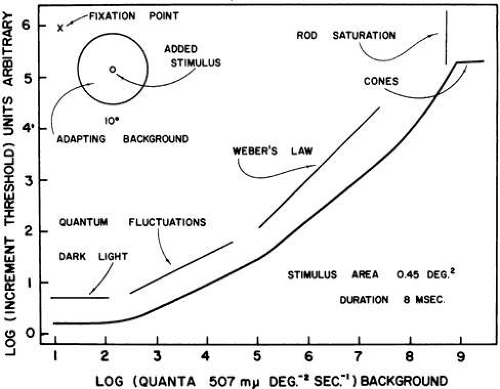 Fig. 5. Illustration of the scotopic portion of the increment sensitivity function. Three phases of the scotopic are indicated: the eigengrau or dark light portion in which intrinsic noise limits the threshold, the DeVries-Rose portion, in which noise intrinsic to quantal nature of the stimulus dominates, and the Weber portion, in which adaptation mechanisms control sensitivity. (Barlow HB: Optic nerve impulses and Weber’s Law. Cold Spring Harbor Symp Quant Biol 30:539, 1965.)
Stay updated, free articles. Join our Telegram channel
Full access? Get Clinical Tree
 Get Clinical Tree app for offline access

|