Fig. 21.1
Total cataract: when no clear lens matter was visible between the capsule and the nucleus, the cataract was defined as a total cataract
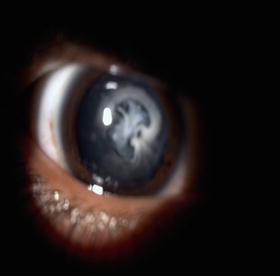
Fig. 21.2
Membranous cataract: when the capsule and organized matter were fused and formed a membrane of varying density, the cataract was defined as a membranous cataract
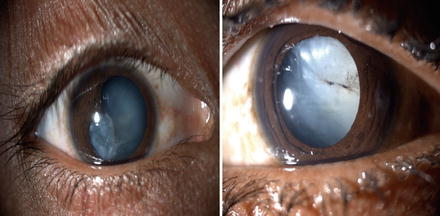
Fig. 21.3
White soft fluffy cataract: when loose cortical material was found in the anterior chamber together with a ruptured lens capsule, the cataract was defined as a white soft cataract
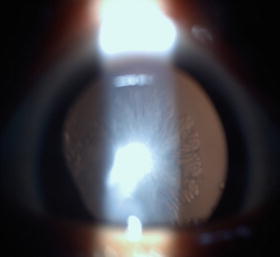
Fig. 21.4
Rosette cataract: lens with a rosette pattern of opacity was classified as a rosette type cataract
For a partially opaque lens, the posterior segment examination was carried out with an indirect ophthalmoscope and a +20 D lens. When the optical medium was not clear, a B-scan was performed to evaluate the posterior segment.
The surgical technique was selected according to morphology [10] and the condition of tissues other than the lens. Phacoemulsification was used to operate on cataracts with hard, large nuclei. With a lens that had either a white soft or rosette type of cataract, unimanual or bimanual aspiration was used. Membranectomy and anterior vitrectomy, either via an anterior or pars plana route, were performed when the cataract was membranous.
In all patients undergoing corneal wound repair, the traumatic cataract was managed in a second procedure. Recurrent inflammation was more prominent in patients who had undergone previous surgery for trauma [8, 9]. In such cases, the ocular medium will turn hazy due to condensation of the anterior vitreous unless a vitrectomy is performed. Hence, we performed a capsulectomy and vitrectomy via an anterior/pars plana route in adults.
In children younger than 2 years of age, both lensectomy and vitrectomy via a pars plana route were performed, and the same surgical procedures were used to manage the traumatic cataract. Lens implantation as part of the primary procedure was avoided in all children younger than 2 years of age.
All patients with injuries and without an infection were treated with topical and systemic corticosteroids and cycloplegics. The duration of medical treatment depended on the degree of inflammation in the anterior and posterior segments of the operated eye. The operated patients were re-examined after 24 h, 3 days, and 1, 2, and 6 weeks to enable refractive correction. Follow-up was scheduled for the third day, weekly for 6 weeks, monthly for 3 months, and every 3 months for 1 year.
At every follow-up examination, visual acuity was tested using the Snellen’s chart. The anterior segment was examined with a slit lamp, and the posterior segment was examined with an indirect ophthalmoscope. Eyes with vision better than 20/60 at the glasses appointment (6 weeks) were defined as having a satisfactory grade of vision.
During the examination, data were entered online using a specified pretested format designed by the International Society of Ocular Trauma (initial and follow-up forms), which was exported to a Microsoft Excel spread sheet. The data were audited periodically to ensure completeness. We used the Statistical Package for Social Studies (SPSS 15) to analyze the data. The univariate parametric method was used to calculate frequency, percentage, proportion, and 95 % confidence interval (95 % CI). We used binominal regression analysis to determine the predictors of postoperative satisfactory vision (>20/60). The dependent variable was vision >20/60 noted at the follow-up 6 weeks after cataract surgery. The independent variables were age, gender, residence, time interval between injury and cataract surgery, primary posterior capsulectomy and vitrectomy procedure, and type of ocular injury.
21.3 Results
Our cohort consisted of 687 patients with traumatic cataracts including 496 (72.2 %) eyes with open globe ocular injuries and 191 (27.8 %) eyes with closed globe injuries (Fig. 21.5). The mean patient age was 27.1 ± 18.54 years (range, 1–80, Table 21.1). The patients were 492 (71.6 %) males and 195 (28.4 %) females, Table 21.2.
Fig. 21.5
Distribution of patients according to BETTS
Table 21.1
Age distribution
Age | Number (n) | Percentage (%) |
|---|---|---|
0 to 10 | 155 | 22.6 |
11 to 20 | 184 | 26.8 |
21 to 30 | 90 | 13.1 |
31 to 40 | 79 | 11.5 |
41 to 50 | 95 | 13.8 |
51 to 60 | 55 | 8.0 |
61 to 70 | 24 | 3.5 |
71 to 80 | 4 | 0.5 |
Total | 687 | 100 |
Table 21.2
Gender distribution
Gender | Number | Percentage |
|---|---|---|
Female | 195 | 28.4 |
Male | 492 | 71.6 |
Total | 687 | 100 |
We analyzed several demographic factors, including origin of patient referral (Table 21.3), socioeconomic status (79 % were from a lower socioeconomic class, Table 21.4), and residence (95 % were from a rural area, Table 21.5), none of which had a significant relationship (p = 0.3) with final visual acuity. The object causing the injury (Table 21.7) and the activity at the time of the injury (Table 21.6) were also not significantly associated with satisfactory final visual acuity. Wooden sticks were the most common agent of injury (55.9 %, Table 21.7). A comparison of pre- and postoperative visual acuity showed that treatment significantly improved visual acuity (Table 21.8; Pearson’s χ 2 test, p < 0.001; ANOVA, p = 0.001). An intraocular lens was implanted in 564 (82.1 %) cases (Table 21.9). The number of surgeries required varied significantly with morphology (p = 0.000) (Table 21.10).
Table 21.3
Entry of the patients
Number | Percentage | |
|---|---|---|
Camp | 181 | 26.3 |
Door to door | 2 | 0.3 |
Other | 7 | 1.0 |
Referral | 6 | 0.9 |
School | 16 | 2.3 |
Self | 75 | 69.1 |
Total | 687 | 100 |
Table 21.4
Socioeconomic status
Number | Percentage | |
|---|---|---|
Poor | 540 | 78.6 |
Rich | 144 | 21.0 |
Very poor | 3 | 0.4 |
Total | 687 | 100 |
Table 21.5
Reporting interval according to residence
Days | Rural | Urban | Total |
|---|---|---|---|
0–1 | 157 | 15 | 172 |
2–4 | 75 | 3 | 78 |
5–30 | 198 | 3 | 201 |
More | 225 | 11 | 236 |
Total | 655 | 32 | 687 |
Table 21.6
Activity during injury
N | Percent | |
|---|---|---|
Fall | 11 | 1.6 |
Fighting | 4 | 0.6 |
Firecrackers | 5 | 0.7 |
House work | 187 | 27.2 |
Job work | 137 | 19.9 |
Other | 114 | 16.6 |
Plain walk | 14 | 2.0 |
Play | 183 | 26.6 |
Travel top | 29 | 4.2 |
Vehicular injury | 3 | 0.4 |
Total | 687 | 100.0 |
Table 21.7
Object of injury
Object | Number (n) | Percent (%) |
|---|---|---|
Ball | 6 | 9 |
Cattle horn | 16 | 2.37 |
Finger | 7 | 1.0 |
Firework | 10 | 1.5 |
Glass | 5 | 0.7 |
Iron wire | 46 | 6.7 |
Other | 58 | 8.4 |
Sharp | 8 | 1.2 |
Stone | 93 | 13.5 |
Unknown | 54 | 7.9 |
Wooden stick | 384 | 55.9 |
Total | 687 | 100.0 |
Table 21.8
Comparative visual acuity before and after treatment
Pre op vision | Posttreatment vision | Total E | ||||||||||||
|---|---|---|---|---|---|---|---|---|---|---|---|---|---|---|
Uncooperative | <1/60 | 1/60 to 3/60 | 20/200 to 20/120 | 20/80 to 20 /60 | 20/40 to 20/20 | |||||||||
Uncooperative | 7 | 1.01 | 0 | 0 | 0 | 0 | 0 | 0 | 1 | 0.14 | 2 | 0.29 | 10 | 1.45 |
<1/60 | 10 | 1.45 | 164 | 23.87 | 53 | 7.71 | 54 | 7.86 | 110 | 16.01 | 191 | 27.80 | 582 | 84.71 |
1/60 to 3/60 | 0 | 0 | 4 | 0.58 | 3 | 0.43 | 8 | 1.16 | 21 | 3.05 | 10 | 1.45 | 46 | 6.69 |
6/60 to 6/36 | 0 | 0 | 0 | 0 | 0 | 0 | 1 | 0.14 | 7 | 1.01 | 12 | 1.74 | 20 | 2.91 |
6/24 to 6/18 | 0 | 0 | 3 | 0.43 | 0 | 0 | 1 | 0.14 | 6 | 0.87 | 7 | 1.01 | 17 | 2.47 |
6/12 to 6/6 | 0 | 0 | 0 | 0 | 0 | 0 | 0 | 0 | 0 | 0 | 1 | 0.14 | 1 | 0.14 |
Total | 17 | 2.47 | 171 | 24.89 | 55 | 8.00 | 64 | 9.31 | 145 | 21.10 | 223 | 32.45 | 675 | 98.5 |
Relationship between pre- and posttreatment visual acuity  | ||||||||||||||
Table 21.9
Lens implant in relation to morphology of traumatic cataract
Morphology | No implant | Implant | Total | |||
|---|---|---|---|---|---|---|
N | % | N | % | N | % | |
Membranous | 17 | 2.5 | 67 | 9.8 | 84 | 12.2 |
Rosette | 2 | 0.3 | 6 | 0.9 | 8 | 1.2 |
White soft | 58 | 8.4 | 354 | 51.5 | 412 | 60.0 |
Total cataract | 46 | 6.7 | 137 | 19.9 | 183 | 26.6 |
Total | 123 | 17.9 | 564 | 82.1 | 687 | 100 |
Table 21.10
Number of surgeries
Number | 0–1 | 2–4 | 5–30 | More | Total |
|---|---|---|---|---|---|
1 | 128 | 58 | 181 | 216 | 584 |
2 | 39 | 19 | 18 | 19 | 94 |
3 | 5 | 1 | 2 | 1 | 9 |
Total | 172 | 78 | 201 | 236 | 687 |
All traumatic cataracts were classified according to morphology (Tables 21.11 and 21.12) and were surgically treated using morphology as a guideline (Table 21.12).
Table 21.11
Final visual outcome in relation to morphology of cataract
Final visual outcome | Morphology | Total | ||||||||
|---|---|---|---|---|---|---|---|---|---|---|
Membranous | Rosette | White soft | Total cataract | |||||||
N | % | N | % | N | % | N | % | N | % | |
Uncooperative | 3 | 0.4 | 0 | 0 | 11 | 1.6 | 5 | 0.7 | 19 | 2.7 |
<1/60 | 24 | 3.5 | 2 | 0.3 | 89 | 12.9 | 58 | 8.4 | 173 | 25.1 |
1/60 to 3/60 | 12 | 1.7 | 0 | 0 | 27 | 3.9 | 19 | 2.7 | 58 | 8.4 |
20/200 to 20/120 | 7 | 1.0 | 1 | 0.1 | 33 | 4.8 | 25 | 3.6 | 66 | 9.6 |
20/80 to 20/60 | 21 | 3.0 | 1 | 0.1 | 91 | 13.2 | 34 | 4.9 | 147 | 21.4 |
20/40 to 20/20 | 17 | 2.5 | 4 | 0.5 | 161 | 23.4 | 42 | 6.1 | 224 | 32.6 |
Total | 83 | 12.1 | 7 | 1.0 | 412 | 59.9 | 183 | 26.6 | 687 | 100 |
Table 21.12
Surgical techniques used according to morphology of cataract
Surgical technique | Morphology | Total | ||||||||
|---|---|---|---|---|---|---|---|---|---|---|
Membranous | Rosette | White soft | Total cataract | |||||||
N | % | N | % | N | % | N | % | N | % | |
Aspiration | 7 | 1 | 5 | 0.7 | 316 | 45.9 | 19 | 2.7 | 347 | 50.5 |
Lensectomy + vitrectomy | 46 | 6.7 | 0 | 0 | 60 | 8.7 | 20 | 2.9 | 126 | 18.3 |
Phaco/SICSa | 3 | 0.4 | 2 | 0.3 | 17 | 2.4 | 108 | 15.7 | 130 | 18.9 |
Delivery + vitrectomy | 28 | 4 | 0 | 0 | 20 | 2.9 | 36 | 5.2 | 84 | 12.2 |
Total | 83 | 12.1 | 7 | 1 | 412 | 59.9 | 183 | 26.6 | 687 | 100 |
Final visual outcome was found to vary according to morphology (Table 21.11) and surgical technique (Table 21.17). White soft cataracts were found to have a better prognosis and achieved significantly higher rates of positive outcome compared with other morphologies (p = 0.014) (Table 21.11).
Aspiration was performed using one or two ports in 48.6 % of the patients in the open globe group, and was significantly associated with improved visual acuity (p < 0.001, Table 21.12).
We were able to do lens implants in 82 % of cases; details are shown in Table 21.9.
In comparing open globe and closed globe groups (Table 21.13), we found significant differences in variables other than final visual outcome, including age, gender, origin of patient referral, object of injury, early reporting, urban vs. rural residence, cataract morphology, surgical technique, number of surgeries, and lens implantation.
Table 21.13
Comparative results amongst open and closed globe injuries
Parameter | Open globe | Closed globe | Total | ||||
|---|---|---|---|---|---|---|---|
No | % | No | % | No | % | p Value | |
Socioeconomic status | |||||||
Poor | 386 | 56.2 | 154 | 22.4 | 540 | 78.6 | 0.008 |
Rich | 108 | 15.7 | 36 | 5.2 | 144 | 21.0 | |
Very poor | 2 | 0.3 | 1 | 0.15 | 3 | 0.4 | |
Total | 496 | 72.2 | 191 | 27.8 | 687 | 100 | |
Entry | |||||||
Camp | 114 | 16.6 | 67 | 9.6 | 181 | 26.3 | 0.03 |
Door-to-door | 1 | 0.1 | 1 | 0.1 | 2 | 0.3 | |
Other | 6 | 0.9 | 1 | 0.1 | 7 | 1.0 | |
Referral | 15 | 2.2 | 2 | 0.3 | 6 | 0.9 | |
School | 2 | 0.3 | 1 | 0.1 | 16 | 2.3 | |
Self | 358 | 52.1 | 119 | 17.3 | 475 | 69.1 | |
Total | 496 | 72.2 | 191 | 27.8 | 687 | 100 | |
Previous surgical treatment | |||||||
No | 485 | 70.6 | 183 | 26.6 | 668 | 97.2 | 0.126 |
Yes | 11 | 1.6 | 8 | 1.2 | 19 | 2.7 | |
Total | 496 | 72.2 | 191 | 27.8 | 687 | 100 | |
Age distribution | |||||||
0 to 10 | 134 | 19.5 | 22 | 3.2 | 155 | 22.6 | 0.000 |
11 to 20 | 145 | 21.1 | 39 | 5.7 | 184 | 26.8 | |
21 to 30 | 70 | 10.1 | 20 | 2.9 | 90 | 13.1 | |
31 to 40 | 54 | 7.7 | 25 | 3.6 | 79 | 11.5 | |
41 to 50 | 52 | 7.5 | 43 | 6.3 | 95 | 13.8 | |
51 to 60 | 25 | 3.6 | 30 | 4.3 | 55 | 8.0 | |
61 to 70 | 15 | 2.1 | 9 | 1.3 | 24 | 3.5 | |
71 to 80 | 1 | 0.1 | 3 | 0.4 | 4 | 0.5 | |
Total | 496 | 72.2 | 191 | 27.8 | 687 | 100 | |
Gender | |||||||
Female | 152 | 22.1 | 43 | 6.3 | 195 | 28.4 | 0.020 |
Male | 344 | 50.1 | 148 | 21.5 | 492 | 71.6 | |
Total | 496 | 72.8 | 191 | 27.8 | 687 | 100 | |
Object of injury | |||||||
Ball | 0 | 0 | 6 | 0.9 | 6 | 0.9 | 0.031 |
Cattle horn | 6 | 0.9 | 6 | 0.9 | 12 | 1.60 | |
Cattle tail | 1 | 0.1 | 3 | 0.4 | 4 | 0.6 | |
Fire work | 6 | 0.9 | 4 | 0.5 | 10 | 1.5 | |
Other | 34 | 4.9 | 40 | 5.8 | 74 | 10.8 | |
Sharp object | 49 | 7.1 | 10 | 1.5 | 59 | 8.6 | |
Stone | 55 | 8.0 | 38 | 5.5 | 93 | 13.5 | |
Wooden stick | 312 | 45.4 | 20 | 2.9 | 54 | 7.9 | |
Unknown | 34 | 4.9 | 72
Stay updated, free articles. Join our Telegram channel
Full access? Get Clinical Tree
 Get Clinical Tree app for offline access

| ||||