Fig. 22.1
(a, b) A Lamellar (Zonular) cataract
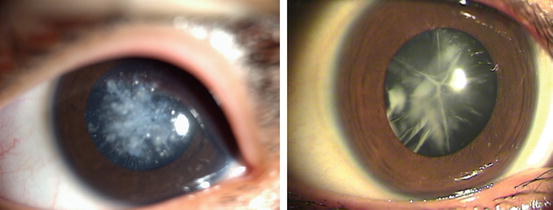
Fig. 22.2
(a, b) Floriform cataract
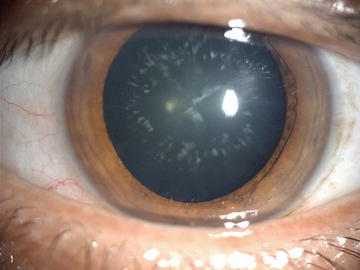
Fig. 22.3
Blue dot and sutural cataract
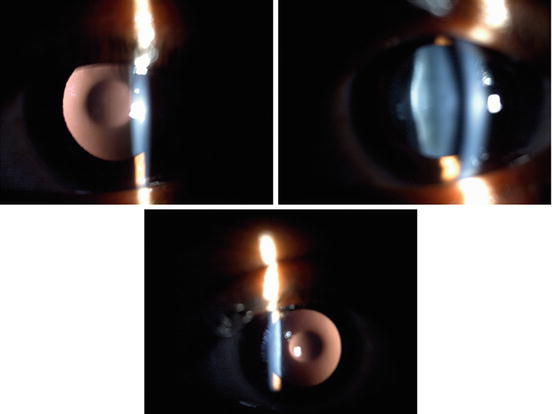
Fig. 22.4
(a–c) Lens with showing anterior and posterior lenticonus
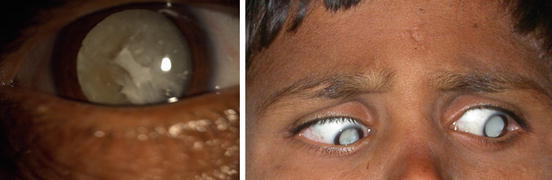
Fig. 22.5
(a, b) Neglected cataract
22.2.1 Specific for Traumatic Cases
For each patient enrolled in our study, we obtained a detailed history including the details of the injury and information on eye treatment and surgery performed to manage past ocular trauma. Data for both the initial and follow-up reports were collected using the online BETTS format of the International Society of Ocular Trauma. Details of the surgery were also collected using a pretested online form. Ocular trauma score was calculated [9].
The cases of traumatic cataract were grouped as those involving open globe versus those involving closed globe injuries. The open globe injuries were further categorized into those with lacerations versus rupture. Lacerations of the eyeball were subcategorized into eyes with perforating injuries, penetrating injuries, or injuries involving an intraocular foreign body. The closed globe group was subdivided into lamellar laceration and contusion.
Based on lenticular opacity, the cataracts were classified as total when an examiner did not observe clear lens matter between the capsule and nucleus (Fig. 22.6), membranous when the capsule and organized matter were fused and formed a membrane of varying density (Fig. 22.7), white soft cataract with a ruptured capsule when loose cortical material was found in the anterior chamber together with a ruptured lens capsule (Fig. 22.8), and rosette type cataract for a lens with a rosette pattern of opacity (Fig. 22.9). We could classify all of the cataract cases seen with this classification. Morphology was influenced mainly by the type, force, and object of injury and the time interval between the injury and examination [21].
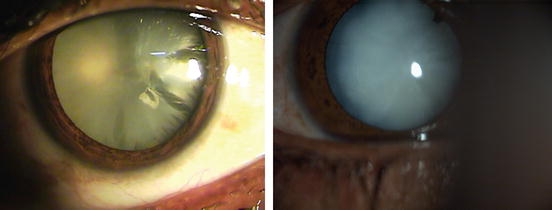
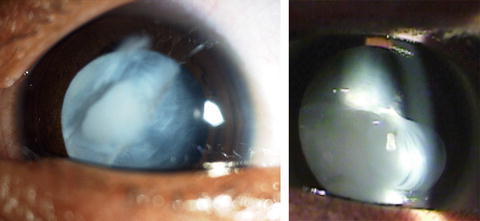
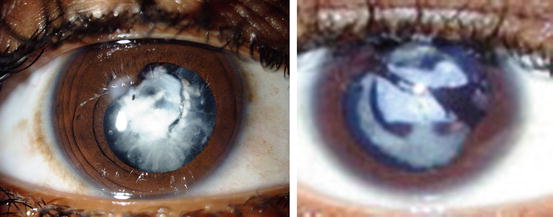
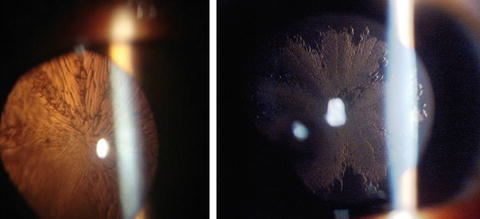
Fig. 22.6
(a, b) When no clear lens matter was visible between the capsule and the nucleus, the cataract was defined as a total cataract
Fig. 22.7
(a, b) When loose cortical material was found in the anterior chamber together with a ruptured lens capsule, the cataract was defined as a white soft cataract
Fig. 22.8
(a, b) When the capsule and organized matter were fused and formed a membrane of varying density, the cataract was defined as a membranous cataract
Fig. 22.9
(a, b) A lens with a rosette pattern of opacity was classified as a rosette type cataract
In case of globe rupture type open globe injury, wound repair was done as first stage and cataract was operated at second sitting. All steps of surgical techniques were documented in pretested online format. All traumatic cataract patients without infection were treated with systemic corticosteroids. In all patients with inflammation and membranous cataracts, primary posterior capsulotomy and anterior vitrectomy was performed [21].
The surgical technique was selected according to morphology and the condition of tissues other than the lens. Phacoemulsification was used to operate on cataracts with hard, large nuclei. With a lens that had either a white soft or rosette type cataract, unimanual or bimanual aspiration was used. Membranectomy and anterior vitrectomy, via either an anterior or a pars plana route, were performed when the cataract was membranous.
In all patients undergoing corneal wound repair, the traumatic cataract was managed in a second procedure. Recurrent inflammation was more prominent in patients who had undergone previous surgery for trauma [9, 10]. In such cases, when the ocular medium was hazy due to inflammation of the anterior vitreous, we performed a capsulectomy and vitrectomy via an anterior/pars plana route in adults.
In children younger than 1.5 years of age, both a lensectomy and vitrectomy via a pars plana route were performed, leaving the rim of the anterior capsule available for secondary lens implantation, and the same surgical procedures were used to manage the traumatic cataracts. Lens implantation as part of the primary procedure was avoided in all children younger than 1.5 years of age; these children were rehabilitated with optical correction, and secondary implantation was done after that.
All patients with injuries and without an infection were treated with topical and systemic corticosteroids and cycloplegics. The duration of medical treatment depended on the degree of inflammation in the anterior and posterior segments of the operated eye.
All children received supportive amblyopia therapy from a qualified pediatric orthoptist, and a pediatric ophthalmologist treated strabismus.
Postoperative follow-up was done according to pretested online format including vision, anterior and posterior segment findings and intraocular pressure, at proper follow-up schedule.
Glasses were prescribed as media was clear and final prescription was at 6 weeks postoperative. Patients undergone orthotic evaluation and amblyopic patients were treated with appropriate patching. Aphakic patients were rehabilitated either by glasses or by contact lenses.
22.2.1.1 Follow-Up
The operated patients were re-examined after 24 h, 3 days, and 1, 2, and 6 weeks to enable refractive correction. Follow-up was scheduled for day 3, weekly for 6 weeks, monthly for 3 months, and every 3 months for 1 year.
At every follow-up examination, visual acuity was tested according to age using the AAO guidelines. The anterior segment was examined with a slit lamp and the posterior segment with an indirect ophthalmoscope. Eyes with vision better than 20/60 at the glasses appointment (6 weeks) were defined as having a satisfactory grade of vision.
Patients developing after cataract underwent membranectomy. For children operated below the age of 1.5 years, secondary lens implantation was done after the age of 1.5 years. Patients were evaluated for stereopsis and contrast sensitivity using titmus vision tester or titmus fly test.
During the examination, data were entered online using a pretested format designed by the International Society of Ocular Trauma (initial and follow-up forms), which was exported to a Microsoft Excel spreadsheet. The data were audited periodically to ensure completion. We used the Statistical Package for the Social Studies (SPSS 17) to analyze the data. We used descriptive statistics and cross tabulation to compare the cause and effect of different variables. The dependent variable was vision >20/60 noted at the follow-up 6 weeks after cataract surgery. The independent variables were age, gender, residence, time interval between the injury and cataract surgery, primary posterior capsulectomy and vitrectomy procedure, and type of ocular injury.
We compared all of the variables for both the open and closed globe groups using various statistical tests.
22.2.2 Results
The enrolled patient group consisted of 1,305 eyes of 1,045 patients with cataract in pediatric age group, comprising 858 (65.7 %) males and 447 (34.3 %) females (Table 22.1). The mean patient age was 9.5 ± 4.7 years ranging from 0 to 18, mean 9.4. Among these eyes, 610 (46.7 %) were traumatic, and 695 (53.3 %) were congenital or developmental cataract (Table 22.2). One thousand one hundred seventeen (85.6 %) (Table 22.3) presented with diminished vision and 188 (14.4 %) presented with leukocoria.
Table 22.1
Age and sex distribution
Age (years) | Sex | |
|---|---|---|
Female | Male | |
0 to 2 | 37 | 56 |
3 to 5 | 67 | 119 |
6 to 10 | 156 | 293 |
11 to 18 | 187 | 390 |
Total | 447 | 858 |
Table 22.2
Aetiology of cataract
Type of cataract | Frequency | Percent |
|---|---|---|
Complicated | 29 | 2.2 |
Congenital | 293 | 22.5 |
Developmental | 373 | 28.6 |
Traumatic | 610 | 46.7 |
Total | 1,305 | 100.0 |
Table 22.3
Comparison of visual outcome according to aetiology
Visual acuity | Type of cataract | |||
|---|---|---|---|---|
Complicated | Congenital | Developmental | Traumatic | |
Uncooperative | 0 | 9 | 6 | 5 |
<1/60 | 20 | 66 | 66 | 201 |
1/60 to 3/60 | 3 | 61 | 65 | 69 |
20/200 to 20/120 | 2 | 17 | 50 | 46 |
20/80 to 20/60 | 3 | 128 | 92 | 94 |
20/40 to 20/30 | 0 | 5 | 30 | 53 |
20/20 to 20/16 | 1 | 5 | 62 | 140 |
Total | 29 | 291 | 371 | 608 |
Amongst nontraumatic group eyes further subdivided in congenital 293 (22.5 %), developmental 373 (28.6 %), and secondary cataract 29 (2.2 %) (Table 22.2). According to cross tabulation and statistical analysis, the demographic factors analyzed, including socioeconomic status (74.5 % were of lower socioeconomic status) and residence (92 % were from rural areas), had no significant relationship to the final visual acuity.
With regard to patient entry, 9.2 % of the patients had received primary treatment prior to reaching our center, and this was not associated with a significant difference in the final visual outcome (p = 0.2). Of the total patients enrolled, 26.4 % entered via an outreach department, and 71 % were self-referred
Among the injuries, 30 % were reported within the first 24 h, 30 % were reported within 3 days, and 33.9 % were reported within 1 month. A wooden stick was the most common object causing eye injury (51.4 %). Neither the injury-causing object (p = 0.3) nor the activity at the time of injury (p = 0.3) was significantly associated with the final visual acuity.
A comparison between pre- and postoperative visual acuities showed that treatment significantly improved the visual acuity (Table 22.4; p = 0.000, Pearson’s χ 2 test; p = 0.001, ANOVA). An intraocular lens was implanted in 1,205 cases (92.3 %) and was significantly associated with improved visual acuity (p = 0.000).
Table 22.4
Comparison of visual outcome according to preoperative visual acuity
Visual acuity (post op) | Visual acuity (preoperative) | ||||||
|---|---|---|---|---|---|---|---|
Uncooperative | <1/60 | 1/60 to 3/60 | 20/200 to 20/120 | 20/80 to 20/60 | 20/40 to 20/20 | 20/30 to 20/20 | |
Uncooperative | 7 | 13 | 0 | 0 | 0 | 0 | 0 |
<1/60 | 7 | 321 | 11 | 11 | 3 | 1 | 0 |
1/60 to 3/60 | 1 | 128 | 54 | 11 | 5 | 0 | 0 |
20/200 to 20/120 | 0 | 74 | 28 | 10 | 3 | 0 | 0 |
20/80 to 20/60 | 7 | 132 | 37 | 99 | 41 | 0 | 2 |
20/40 to 20/30 | 1 | 62 | 15 | 3 | 7 | 1 | 0 |
20/20 to 20/16 | 5 | 140 | 24 | 23 | 12 | 3 | 3 |
Total | 28 | 870 | 169 | 157 | 71 | 5 | 5 |
When we compared visual outcome between traumatic and nontraumatic group, traumatic group is doing well (Table 22.5, p = 0.000).
Table 22.5
Comparison of visual outcome amongst traumatic and nontraumatic group
Visual acuity | Cataract | |
|---|---|---|
Nontraumatic | Traumatic | |
Uncooperative | 15 | 5 |
<1/60 | 153 | 201 |
1/60 to 3/60 | 130 | 69 |
20/200 to 20/120 | 70 | 46 |
20/80 to 20/60 | 224 | 94 |
20/40 to 20/30 | 36 | 53 |
20/20 to 20/16 | 69 | 140 |
Total | 697 | 608 |
Final visual acuity following cataract surgery was >20/200 in 396 eyes (56.8 %) and ≥20/40 in 108 eyes (14.8 %) in nontraumatic group. In the traumatic group, the visual acuity was >20/200 in 334 eyes (54.6 %) and ≥20/40 in 108 eyes (14.8 %). The difference between the groups was significant (p = 0.000). In total, 296 (22.6 %) eyes had a final visual acuity ≥20/40 and 728 (57.8 %) eyes had a final visual acuity >20/200 (Table 22.4). The follow-up period ranged from 1 to 3,084 days, with a mean of 117.4 days.
We found sensory nystagmus present in 221 (17 %) eyes which caused significant difference in final visual outcome (Table 22.6, p = 0.00).
Table 22.6
Comparison of visual outcome according to presence of sensory nystagmus
Visual acuity | Sensory_nystagmus | |
|---|---|---|
No | Yes | |
Uncooperative | 13 | 7 |
<1/60 | 302 | 52 |
1/60 to 3/60 | 150 | 49 |
20/200 to 20/120 | 96 | 20 |
20/80 to 20/60 | 230 | 88 |
20/40 to 20/30 | 88 | 1 |
20/20 to 20/16 | 204 | 5 |
Total | 1,083 | 222 |
We have studied unilateral versus bilateral (Table 22.7, p = 0.000) and found better results with unilateral cases. In nontraumatic group bilateral cases have better results (Table 22.7, p = 0.000).
Table 22.7
Comparative study of visual outcome according to laterality over all category of cataract in pediatric age group
Visual acuity | Laterality | |
|---|---|---|
Bilateral | Unilateral | |
Uncooperative | 8 | 12 |
<1/60 | 76 | 278 |
1/60 to 3/60 | 98 | 101 |
20/200 to 20/120 | 59 | 57 |
20/80 to 20/60 | 187 | 131 |
20/40 to 20/30 | 29 | 60 |
20/20 to 20/16 | 59 | 150 |
Total | 516 | 789 |
We have studied cases with amblyopia in unilateral as well as bilateral cataracts, and significant difference was found in bilateral cases (Table 22.8, p = 0.000). In nontraumatic group we had 184 eyes with unilateral cataract with deprivational amblyopia vision improvement was not significant (p = 0.510).
Table 22.8
Visual outcome according to age, laterality, aetiology
No | Category | p Value | Conclusion |
|---|---|---|---|
1 | Total | 0.000 | UL better |
2 | Above five | 0.000 | UL better |
3 | Under five | 0.001 | BL better |
4 | Traumatic | 0.020 | UL better |
5 | Nontraumatic | 0.000 | BL better |
6 | Nontraumatic ≤5 | 0.000 | BL better |
7 | Traumatic ≤5 | No bilateral | NA |
8 | Nontraumatic >5 | 0.000 | BL better |
9 | Traumatic >5 | 0.061 | NA |
We have studied and compared visual outcome taking laterality into account according to age (<5/= and >5), and according to category (traumatic, nontraumatic) (Table 22.8).
We have concluded that visual outcome is better in unilateral cases if we consider all subgroups, better with bilateral cases in group ≥5 (p = 0.000) with unilateral cases in group >5 (p = 0.000). Visual outcome is better in traumatic group in unilateral (p = 0.02) and nontraumatic cases bilateral (p = 0.000).
We have also compared visual outcome for both groups ≤5 and >5 (Table 22.8), found that in case of nontraumatic cases visual outcome is better in bilateral conditions (p = 0.000) and in case of traumatic no significant difference is found (p = 0.061) (Table 22.8).
When we studied traumatic group our cohort consisted of 354 patients with traumatic cataracts, including 287 (82.6 %) eyes with open globe ocular injuries and 67 (17.3 %) eyes with closed globe injuries (Fig. 22.10). The patients included 252 (71.1 %) males and 102 (28.8 %) females. The mean patient age was 10.6 ± 4.3 years (range 0–17) (Table 22.9).
Fig. 22.10
BETTS Distribution of traumatic cataract
Table 22.9
Age and sex distribution of traumatic cases
Age group | Sex | Total | |
|---|---|---|---|
Female | Male | ||
0 to 1 | 2 | 2 | 4 |
2 to 4 | 12 | 33 | 45 |
5 to 10 | 44 | 88 | 132 |
11 to 16 | 44 | 129 | 173 |
Total | 102 | 252 | 354 |
We analyzed several demographic factors, including patient entry (p = 0.000), cases self-reported as having done well (Table 22.10), socioeconomic status (79 % were from lower socioeconomic classes), and residence (95 % were from rural areas). None was significantly related to the final visual acuity according to cross tabulation and statistical tests.
Table 22.10
Patient entry and visual outcome
Vision | Entry | Total | |
|---|---|---|---|
Self | ORD | ||
Uncooperative | 6 | 2 | 8 |
No PL | 10 | 0 | 10 |
HMPL | 36 | 16 | 52 |
1/200 to 19/200 | 39 | 28 | 67 |
20/200 to 20/50 | 66 | 29 | 95 |
≥20/40 | 94 | 28 | 122 |
Total | 250 | 104 | 354 |
Table 22.11
Activity at the time of the injury
Object | Number (n) | Percentage (%) |
|---|---|---|
Fall | 6 | 1.7 |
Making a fire | 10 | 2.8 |
Housework | 58 | 16.4 |
Employment | 20 | 5.6 |
Other | 45 | 12.7 |
Walking | 4 | 1.1 |
Playing | 195 | 55.1 |
Travelling | 12 | 3.4 |
Unknown | 4 | 1.1 |
Total | 354 | 100.0 |
The object causing the injury (Table 22.12) and the activity at the time of the injury (p = 0.3; Table 22.11) were also not significantly associated with a visual acuity at 6 weeks. A stick was the most common agent of injury (56.1 %; Table 22.12). Better outcome was achieved above 5 years (Table 22.13).
Table 22.12
Object causing the injury
Object | Number (n) | Percentage (%) |
|---|---|---|
Ball | 5 | 1.4 |
Cattle horn | 6 | 1.7 |
Cattle tail | 1 | .3 |
Finger | 3 | .8 |
Fire | 10 | 2.8 |
Glass | 4 | 1.1 |
Thorn | 12 | 3.4 |
Other | 31 | 8.8 |
Sharp object | 31 | 8.8 |
Stone | 38 | 10.7 |
Unknown | 31 | 8.8 |
Stick | 182 | 51.4 |
Total | 354 | 100.0 |
Table 22.13
Comparative study of age and visual outcome in traumatic cataract in children
Vision | Age group (years) | Total | |||
|---|---|---|---|---|---|
0 to 2 | 3 to 5 | 6 to 10 | 11 to 18 | ||
Uncooperative | 0 | 6 | 2 | 0 | 8 |
No PL | 1 | 2 | 4 | 3 | 10 |
HMPL | 0 | 11 | 23 | 19 | 53 |
1/200 to 19/200 | 0 | 7 | 30 | 29 | 66 |
20/200 to 20/50 | 2 | 14 | 41 | 37 | 94 |
≥20/40 | 1 | 5 | 32 | 85 | 123 |
Total | 4 | 45 | 132 | 173 | 354 |
A comparison of the pre- and postoperative visual acuity showed that treatment significantly improved visual acuity (Pearson’s χ 2 test, p = 0.000; ANOVA, p = 0.001; Table 22.14). Morphologically, lens ruptured with soft material in anterior chamber has done significantly better (Tables 22.15 and 22.16). Aspiration was significantly associated with improved visual acuity (p = 0.000) and was performed using one or two ports in 48.6 % of the patients in the open globe group.
Table 22.14
Pre-treatment and post-treatment vision following surgical treatment for traumatic cataract in children
Vision | Total | ||||||
|---|---|---|---|---|---|---|---|
UC | No PL | PLHM | 1/200 to 19/200 | 20/200 to 20/50 | ≥20/40 | ||
UC | 7 | 0 | 1 | 0 | 0 | 0 | 8 |
No PL | 0 | 8 | 2 | 0 | 0 | 0 | 10 |
PLHM | 0 | 4 | 48 | 1 | 0 | 0 | 53 |
1/200 to 19/200 | 0 | 1 | 48 | 16 | 0 | 1 | 66 |
20/200 to 20/50 | 1 | 3 | 64 | 22 | 4 | 0 | 94 |
≥20/40 | 2 | 0 | 83 | 32 | 6 | 0 | 123 |
Total | 10 | 16 | 246 | 71 | 10 | 1 | 354 |
Table 22.15
Morphology and visual outcome following surgical treatment for traumatic cataract in children
Vision | Morphology | Total | |||
|---|---|---|---|---|---|
Membrane | Rosette | Lens ruptured | Total | ||
Uncooperative | 1 | 0 | 6 | 1 | 8 |
No PL | 2 | 0 | 4 | 4 | 10 |
HMPL | 14 | 0 | 27 | 11 | 53 |
1/200 to 19/200 | 17 | 0 | 38 | 11 | 66 |
20/200 to 20/50 | 21 | 2 | 62 | 9 | 93 |
≥20/40 | 12 | 4 | 97 | 11 | 124 |
Total | 67 | 6 | 234 | 47 | 354 |
Table 22.16
Distribution according to morphology of cataract
Morphology | Number (n) | Percent (%) |
|---|---|---|
After cataract | 25 | 1.9 |
Ant lenticonus
Stay updated, free articles. Join our Telegram channel
Full access? Get Clinical Tree
 Get Clinical Tree app for offline access

|