and time  of a broadband light source is given by
 being the center wavelength and
  being the 3-dB optical bandwidth. The factor
  accounts for the fact that many broadband SLEDs do not have a perfect Gaussian shape but rather a flat-top spectrum. For Gaussian-shaped SLEDs, this factor is unity (
 ), while for SLEDs with a flat-top spectrum,
  .186 is typically used, i.e., there is almost a 20 % penalty in coherence length by deviating from a perfect Gaussian shape. The coherence length of the SLED specifies the theoretical limit for the axial resolution of an OCT imaging system. For example, with
  nm and
  , a coherence length
  is calculated when assuming a flat-top shape, as shown in Fig. 18.1.
Fig. 18.1
ASE spectrum (upper row, in blue) of an 840-nm SLED with ∼50-nm full width at half maximum (FWHM) optical bandwidth (EXS210022) and corresponding imaging or coherence function (lower row, in red) plotted versus optical path length difference (OPD). The half-width at half maximum (HWHM) of the coherence function shows a coherence length of 7–8 μm (in air)
The coherence function is equivalent to the autocorrelation function of an SLED, which is, according to the Wiener-Khinchin theorem, the Fourier transform of the ASE spectrum [3]. According to Parseval’s theorem, the Fourier transform of a power spectrum represents again power, which means that the coherence or autocorrelation function represents optical power in the spatial domain. It is calculated by applying the FFT to the linear ASE spectrum that has been resampled with equidistant steps in the frequency domain. The magnitude of the FFT output is the linear coherence function, and its logarithmic counterpart is calculated by 10∙log10 and not by 20∙log10, as sometimes found as well. Since the ASE power spectrum is real-valued, the Fourier transform is Hermitian and hence symmetric in space or time, as shown in Fig. 18.1.
The drop-off of the coherence function from its maximum (at zero) to 50 % is the coherence length, i.e., the coherence length is the half width at half maximum (HWHM) and not the full width at half maximum, as sometimes referred to. This can be easily verified by the example given in Fig. 18.1.
The logarithmic coherence or imaging function plotted over a wide range may reveal secondary coherence peaks at a certain optical path length difference (OPD). For the example shown in Fig. 18.1, secondary coherence peaks can be seen at an OPD of ~3 mm with a suppression of close to 40 dB. Typically, a secondary peak suppression ratio (SPSR) of 25–35 dB is needed in order to avoid OCT imaging artifacts like horizontal lines in a B-scan image. Such SPSR corresponds to a (peak-to-valley) ripple amplitude of the ASE spectrum in the range of 0.10–0.20 dB. This is achieved through an advanced SLED chip design and through high-performance antireflection coatings (ARC) at the chip facet.
The coherence function near the central peak (at zero) may reveal sidelobes when the ASE power spectrum deviates from a Gaussian shape. The example of Fig. 18.1 shows sidelobes with a suppression of ~10 dB (not considering any windowing prior to the FFT). The sidelobe suppression ratio (SLSR) is only given by the spectral shape of the SLED, and high SLSR values are needed particularly for TD-OCT systems where additional signal processing like spectral windowing is not implemented. Gaussian-shaped SLEDs have a high SLSR (i.e., no or little sidelobes), while SLEDs with a flat-top spectrum have a lower SLSR.
18.1.2 SLEDs at 400–500 nm
SLEDs in the blue-to-green spectral range are realized in the GaN material system [4]. The short emission wavelength may, in combination with broadband emission, allow for realizing SLEDs with a coherence length of 1–3 μm in air. However, due to very high absorption of blue light in hemoglobin, biomedical OCT for tissue diagnostic is rather unlikely. Instead, those sources may be deployed in nondestructive testing (NDT) or ultra-high-resolution optical coherence microscopy (OCM) systems [5]. Due to extensive work on the reliability of GaN SLEDs [6], blue SLEDs have been commercially available until very recently [7] such that OCT and OCM in this spectral region have not been explored yet. Figure 18.2 shows the electro-optic properties of high-power SLEDs in the wavelength range of 400 to 450 nm. The achievable output power and the slope efficiencies are nearly comparable with GaN single-mode laser diodes. The ASE emission spectra of the currently available SLEDs have a Gaussian shape with a typical 3-dB optical bandwidth of 4-5 nm. Similar to design efforts that were done for SLEDs at 800 to 900 nm, the ASE emission spectrum of such GaN SLEDs could be increased to achieve ultra-short coherence lengths or coherence times.
Fig. 18.2
Ex-facet output power and forward voltage of high-power single-mode 405-nm SLED as function of drive current (left). ASE emission spectra on a linear scale of SLEDs at 405, 425 and 445 nm with optical bandwidths of 4-5 nm (right)
18.1.3 SLEDs at 840 nm
Most SD-OCT systems deployed today are used for retina imaging in ophthalmology and are based on an 840-nm SLED featuring a 3-dB (FWHM) optical bandwidth of 50 nm and a 10-dB bandwidth of 80 nm. Those SLEDs are used in combination with a spectrometer that spans 80 nm and a line camera with 2,048 pixels, resulting in a wavelength resolution of ∼0.04 nm or a frequency resolution of ∼17 GHz, which then translates into an axial resolution of 7–8 μm in air (without windowing) and an imaging depth of ∼4.5 mm.
The maximum permissible exposure (MPE) limit according to laser class 1 is ∼750 μW at a wavelength of 840 nm [7]. Considering a 75:25 splitter in the OCT interferometer and an additional 2–3 dB loss in the optical train or delivery optics, the required output power of an 840-nm SLED is typically in the range of 2.5–4.5 mW.
Spectrometer-based OCT system may trade off resolution with imaging depth, for example, in anterior-chamber eye surgical systems where SD-OCT systems with an imaging depth of 8–10 mm are used. This is achieved by using a 2,048-pixel line camera in combination with a spectrometer that spans only 40 nm instead of 80 nm; hence, those systems typically use an SLED with a 3-dB optical bandwidth of 25 nm instead of 50 nm. Because of higher insertion losses in the optical train due to combining the diagnostic OCT system with the laser surgical system, SLEDs with an output power of 10–20 mW are typically needed. Similar considerations in terms of SPSR and SLSR apply here as well.
18.1.4 SLEDs at 1,060 nm
Cost-effective and high-speed InGaAs line cameras with a pixel count of 2,048, similar to silicon-based CMOS or CCD line cameras, may enable commercial SD-OCT systems based on broadband SLEDs. Due to deeper penetration into the choroid of the retina, the expected imaging range might be somewhat larger than in the 840-nm spectral range. Naturally, the axial resolution of such systems would be lower, requiring SLEDs with a 3-dB optical bandwidth of 60–70 nm and a 10-dB optical bandwidth of ∼110 nm.
The class 1 MPE limit at 1,060 nm is ∼2.0 mW and hence almost three times higher than at 840 nm. Therefore, higher power 1060-nm SLEDs (∼10–15 mW) can be used to help increase sensitivity.
18.1.5 SLEDs at 1,300 nm
Broadband SLEDs at 1,300 nm are used for NDT or other type of industrial TD-OCT systems. State-of-the-art SLEDs achieve a 3-dB optical bandwidth of up to 120 nm from a single SLED chip with a low output power of 5 mW ex-fiber, or 90–100 nm with a medium output power of 10–15 mW, or 70–75 nm with a high output power of 20–30 mW. The class 1 MPD limit at 1,300 nm is ∼15.6 mW; therefore, mainly high-power SLEDs with 20–30 mW are used in such OCT systems. As mentioned earlier, for TD-OCT systems, a good SLSR is typically required, which puts a preference on Gaussian-shaped SLEDs.
18.1.6 Combined Broadband Sources
For ultra-high-resolution SD-OCT systems, broadband light sources based on spectrally combined SLEDs are used. Those combined SLED sources are realized in the 750–900 nm range, for example, where a 3-dB optical bandwidth of 150–160 nm and a 10-dB optical bandwidth of 180 nm are achieved with a total output power of 5 mW. Such an ultra-broadband source has a coherence length of ∼2.5 μm in air and hence less than 2 μm in tissue, achieving a similar axial resolution than a fs-pulsed laser with a pulse duration of 8–9 fs.
Similar broadband sources with a 3-dB optical bandwidth of 180–200 nm at a center wavelength of 1,060 nm or 1,300 nm can be realized [9].
18.1.7 Back-Reflection Immunity of SLEDs
SLEDs can be considered a broadband source of spontaneous emission that is connected to a high-power and high-gain optical amplifier, which then generates amplified spontaneous emission (ASE) in a single optical path, i.e., without any optical resonator like a laser. However, the on-chip high-gain amplifier amplifies ASE light not only in forward direction, i.e., towards the output facet of the SLED, but also in backward direction when light from is reflected back from an optical setup, for example. A good chip design prevents the SLED from being destroyed in the presence of back-reflections (BR); however, optical BR may reduce the amount of free carriers in the active region of the SLED, resulting in reduced output power and a reduction of optical bandwidth and in a redshift of the spectrum [10]. The amount of BR that can be tolerated depends on the application and on the SLED, i.e., high-power SLEDs will generally be more sensitive to BR than low-power SLEDs. Similarly, SLEDs with a flat-top optical spectrum will show stronger spectral changes due to BR than Gaussian-shaped SLEDs. Still, a negative impact of BR on the long-term reliability of SLEDs could not be found [10], and those findings have been confirmed by various lifetime experiments over several thousands of hours.
In order to avoid any kind of impact of BR on the SLED output performance, though, an optical return loss of less than −30 dB is recommended.
18.2 Broadband and High-Speed Swept Sources
High-speed wavelength-swept laser technology offers versatile applications in optical coherence tomography (OCT) [11–13], biochemical spectroscopy [14], and fiber-optic sensing [15]. Particularly in recent years, swept laser technology has been critical in advancing OCT applications in the field of biomedical imaging and industrial imaging, imparting the advantages of real-time in vivo diagnostics and high sensitivity. To realize real-time clinical imaging and broad-base commercial deployment, compact, small, and stable swept sources are of utmost importance. To meet such demands, wavelength-flexible swept sources between 400 and 1,700 nm with sweep rates from 1 to 200 kHz can be realized in a miniaturized optical butterfly package that also allows the integration of optical reference (k-clock) interferometers or other optical reference filters for spectral calibration [16]. The salient advantages of EXALOS’ swept source technology include the following:
1.
Wavelength flexibility: currently over various spectra from 800 to 1,650 nm; potentially reaching the visible spectrum near 400 nm or the near-infrared spectrum up to 2,500 nm
2.
High phase stability: suitable for phase-sensitive applications such as Doppler OCT
3.
Ultra-stable long-term operation: enables spectral calibration with fixed remapping vectors
4.
Clean imaging performance: no secondary coherence peaks as well as sharp and narrow PSF peaks without sidelobes throughout the imaging range
5.
Symmetric bidirectional sweeps: allows high duty cycle and efficiency
6.
Customizable bidirectional or unidirectional operation
7.
Small size: optical module in 26-pin butterfly package; packaged with electronics in hard disk drive (HDD) form factor
For biomedical OCT applications, different imaging system requirements would demand an optimum combination of spectral region, sweep range, sweep frequency, coherence length, average power, and frequency calibration (k-space remapping) methods.
18.2.1 Diverse Swept Source Requirements
In the following sections, we will discuss some key requirements of swept sources before explaining the EXALOS swept source architecture and demonstrating its performance characteristics.
18.2.1.1 Wavelength Region
The selection of the proper spectral region for OCT applications depends mainly on the scattering and absorption property of the targeted biological tissue. The 840-nm spectrum has been historically used for retinal imaging due to low water absorption through the entire eye length and high scattering in the retinal layers. The 1,060-nm spectrum has been actively investigated in recent years due to a favorable combination of high penetration in retinal (choroidal) layers and better visualization in patients with hazy ocular media (e.g., cataract). The 1,310-nm spectrum is useful for imaging of the anterior chamber of the eye, for dermatology, for cardiology or for other areas due to its lower scattering and hence deeper tissue penetration. The 1,550-nm spectrum is more suitable for industrial imaging, e.g., NDT, or fiber-optic sensing but has also been investigated for the hope of deeper imaging in bone structures due to their lower water content.
To address higher-resolution SS-OCT applications with near-micrometer resolution, multiple sources can be spectrally combined in order to form an ultra-broadband swept source. The unique flexibility of the EXALOS laser architecture allows for tailored specifications at multiple wavelengths and for concatenating swept sources of different wavelengths in a synchronized master-and-slave sweep operation. Figure 18.3 shows optical spectra of five different lasers covering a wavelength range between 800 and 1,600 nm. As discussed in more detail in Sect. 18.3, the typical sweep spectrum has a rectangular shape with sharp spikes at the edges, which originates from the turning points of the resonant MEMS scanner. 10-dB sweep ranges as wide as 80 nm at 840 nm, 130 nm at 1,060 nm, 100 nm at 1,220 nm, 160 nm at 1,300 nm, and 200 nm at 1,550 nm, respectively, have been achieved.
Fig. 18.3
Spectra of swept sources in different spectral regions
18.2.1.2 Sweep Range and Axial Resolution
For Fourier domain OCT (FD-OCT), which includes both SS-OCT and SD-OCT, the spectral bandwidth defines the axial imaging resolution. Assuming a Gaussian shape for the spectral power distribution, the axial resolution (δz) is related to the 3-dB (FWHM) sweep range Δλ through the relation 0
 with λ0 being the center wavelength of the source. This is the same formula used to calculate the coherence length or axial resolution of SLEDs with Δλ being the 3-dB bandwidth of the SLED. However, the sweep range of a swept source is typically specified as the range over which the spectral power drops to −10 dB relative to the peak value. For a Gaussian-shaped spectrum, the 10-dB optical bandwidth is 1.83 times larger than the 3-dB optical bandwidth, which needs to be considered when translating the sweep range of a swept source into axial resolution.
The sweep range is typically measured using an optical spectrum analyzer (OSA), which measures average optical power but does not capture the instantaneous output power of the swept source. For sources sweeping in a nonlinear fashion like sinusoidal swept sources, the optical spectrum is given by the convolution of the instantaneous output power of the source in the wavelength domain with the sweep characteristics in the time domain. It is therefore more appropriate to measure the optical sweep range and hence the axial resolution of a swept source in the time domain and, by means of a calibration, convert the time-domain signal into the wavelength domain.
Generally, SS-OCT systems are expected to deliver an axial resolution that is comparable to SD-OCT systems based on SLEDs and spectrometers. In most cases, this means that the specified (10-dB) sweep range has to be larger than the specified (3-dB) optical bandwidth of SLEDs.
18.2.1.3 Coherence Length and Imaging Depth
In practical SS-OCT imaging implementations, the imaging depth is inherently governed by two parameters: the finite linewidth of the source δλ in wavelength or δv in frequency  , which leads to a sensitivity fall-off with imaging depth, and the spectral sampling interval (dk), which limits the observable imaging range. Assuming a Gaussian-shaped linewidth, the coherence length (l c ) is related to the dynamic or instantaneous linewidth through the relation [17]
, which leads to a sensitivity fall-off with imaging depth, and the spectral sampling interval (dk), which limits the observable imaging range. Assuming a Gaussian-shaped linewidth, the coherence length (l c ) is related to the dynamic or instantaneous linewidth through the relation [17]Similar to SLEDs, the coherence length is defined as the optical path length difference (OPD) over which the coherence or autocorrelation function drops from its maximum to 50 %. Since OCT is a reflective interrogation technique, the so-called imaging depth captures the double path in the interferometer and is therefore half the coherence length of the source, i.e., a swept source with a coherence length of 10 mm has an imaging depth of 5 mm.
Optical and Electrical PSF
In many imaging applications and in the field of Fourier optics, the term “point spread function” (PSF) is being used. In analogy to RF systems, it can be thought of the impulse response of an imaging system that is applied to an object through a convolution and that yields an image:
Applying this concept to OCT means that the OCT image (A-scan) can be thought of the convolution of the PSF of the light source with the object that is being scanned. Using an interferometer with zero OPD, the resulting image (A-scan) is the autocorrelation (coherence) function of the light source that is therefore equivalent to the “optical PSF” (PSFo).
In the theoretical analysis of FD-OCT, the electrical currents and the electrical power signals that are generated through the detection of the optical fringe signals are considered [12], [18], 19], [29]. Therefore, to describe the imaging performance of an SD-OCT or SS-OCT system, it is common to calculate the square of the magnitude after the FFT [20] or to use 20·log10 [12] when plotting the “electrical PSF” (PSFe) or when calculating the SNR and hence the system sensitivity. As a result, the coherence function or optical PSF will drop to 50% while the electrical PSF will drop by 6 dB over the specified coherence length.
To make it more challenging, the “coherence length” is a performance parameter of the source, while the “imaging depth” is a performance parameter of the SS-OCT imaging system. While most system vendors specify a minimum coherence length (amplitude fall-off) of the swept source, the imaging performance of the OCT system is given by the signal-to-noise ratio (SNR) fall-off behavior of the source and of the entire system, including linearization algorithms. It is commonly expected that the 6-dB SNR fall-off (imaging depth) is identical to the 6-dB amplitude fall-off of the source, which is most often not the case, though.
The imaging depth and hence the required coherence length or SNR fall-off is typically dictated by the application, e.g., retina OCT imaging requires an imaging depth of 3–4 mm, while anterior-chamber imaging needs an imaging depth of 7–8 mm, similar to endoscopic OCT applications where an imaging depth of 5–10 mm is often required.
In swept laser designs, many performance parameters are interrelated and may require trade-offs in order to optimize the most critical parameters. For example, a long photon lifetime is required to provide a large coherence length, and this is achieved by minimizing cavity loss and thus maximizing the number of cavity round trips for a given gain medium. A high spectral slew rate or sweep speed (expressed in nm/ns) can increase loss due to a fast-moving spectral filtering window and hence simultaneously reduce the photon lifetime, sweep range, and output power. For applications such as biometry where imaging depth is more critical than axial resolution, the sweep range or the sweep speed can be compromised to help increase the coherence length.
18.2.1.4 Secondary Peak Position and Suppression
Secondary peaks of the coherence function or PSF shall be well suppressed within the imaging range in order to not produce horizontal lines on a B-scan. A typical SNR value of a swept source near the zero delay or zero OPD is 60 dB on a 20∙log10 scale. This means that, similar to SLEDs, a secondary peak suppression of 25–35 dB (50–70 dB on a 20∙log10 scale for the electrical PSF) within the imaging range is required.
18.2.1.5 Axial Scanning Frequency (Sweep Rate)
SS-OCT has the potential to deliver faster A-scan rates compared to camera-based SD-OCT systems and therefore allows addressing the needs for certain applications. For example, in high-resolution or wide-angle retinal OCT imaging, an A-scan rate of 100–200 kHz (or even more) is desired in order to avoid motion artifacts or to allow for imaging a larger area of the retina. For example, a 200-kHz swept source could enable B-scan imaging with a width of 1,000 A-scans and 8 times averaging with a video rate of 25 fps. In cardiovascular OCT applications, the maximum allowable time for flushing and the chosen artery length for imaging define the pullback rate of the catheter, which then defines the required A-scan rate of the swept source in order to maintain a certain spatial sampling resolution during the pullback. For such applications, A-scan rates in the range of 50–100 kHz are currently required.
The A-scan frequency of SS-OCT systems directly defines the spectral sweep frequency of the laser. In swept laser designs, an excessively high sweep frequency generally compromises the sweep range, the coherence length, and the output power in addition to imposing constraints on the sweep mechanisms whether mechanical or electronic.
Similar constraints may exist on system level as higher A-scan rates require faster and hence more expensive A/D converter (ADC), faster signal processing engines, and larger data throughput towards the host. Furthermore, faster electronics typically mean larger analog bandwidths and hence lower SNR performance, higher power consumption, and lower resolution. The A-scan rate and the imaging depth in conjunction with the linearity of the swept source define the required sampling rate of the ADC. A typical sampling rate for a 100-kHz A-scan rate is 500 MSPS that provides sufficient imaging depth for most sources.
Finally, for a given MPE level, faster A-scan rates will mean fewer photons per sweep (i.e., per A-scan) and therefore lower OCT system sensitivities.
18.2.1.6 Average and Instantaneous Output Power
The swept laser power is dependent on the cavity loss, the sweep frequency, and on the gain and saturation power of the optical gain chip. Furthermore, the average sweep power also depends on the sweep duty cycle. Because the average power directly affects the SNR, one often tries to maximize output power without exceeding the safety limits for biomedical imaging (after accounting for losses through the imaging system). Typically, the average output power of a swept source is specified. However, in case the MPE limit changes over the sweep range of the laser, the instantaneous spectral output power of the laser may need to be considered as well.
18.2.1.7 Relative Intensity Noise (RIN), SNR, and OCT Sensitivity
Noise in laser sources is generally characterized by relative intensity noise (RIN) and phase noise. Phase noise defines the laser linewidth (coherence length). RIN manifests itself in the SNR, the sensitivity, and in the dynamic range of a measurement system, which are critical parameters that determine image clarity against background noise in OCT imaging. Both SNR and OCT sensitivity quantify the minimum detectable reflected optical power for an ideal sample (metal mirror). Dynamic range describes the range of optical reflectivity values detectable in OCT imaging, i.e., the capability of detecting weak signals in presence of large-amplitude signals. Typical RIN values of both SLEDs and swept sources are in the range of −125 to −145 dBc/Hz. RIN of SLEDs is measured in the frequency domain using an electrical spectrum analyzer with a high sensitivity, while RIN of swept sources is typically measured in the time domain using sampling of consecutive sweeps over a certain period of time [21].
18.2.1.8 Sweep Linearity in Frequency
The ideal swept source for OCT applications has a constant sweep speed in the frequency domain, i.e., its sweep is linear in k. The corresponding k-clock signal will then have a constant frequency during the sweep. However, most high-speed swept sources exhibit some nonlinear sweep behavior with respect to optical frequency and therefore require a recalibration of the interferometric fringe patterns in k-space before the inverse Fourier transform can be applied in order to extract accurate spatial-domain (depth ranging) information. It is therefore useful to provide the k-clock signal as an integral part of the swept laser.
Nonlinear sweep in k also means that the sweep speed and hence the k-clock frequency varies over the sweep time of the laser. Depending on the amount of sweep nonlinearity, faster sampling rates of the ADCs and larger analog bandwidths of the receivers need to be considered. Additionally, fast-varying k-clock frequencies (strong frequency modulation) may challenge the acquisition electronics when direct k-clocking is employed.
18.2.1.9 Duty Cycle
In SS-OCT two types of duty cycles are of interest: the duty cycle of the swept source and the duty cycle for the OCT imaging. The duty cycle of the source describes the amount of time the laser spends for the wavelength sweep relative to the sweep period. The sinusoidal and bidirectional swept sources from EXALOS have a high duty cycle of 80–100 %, for example. Lower duty cycles translate into faster sweep times or slew rates and hence into higher fringe frequencies, which require faster sampling rates. The duty cycle for the OCT signal processing describes the percentage of the actual sweep time of the laser that is used for the generation of an A-scan. For example, the duty cycle of the laser might be 100 % but the duty cycle used for OCT signal processing is actually only 75 % of the sweep time because 25 % of the sweep time will be discarded for certain reasons.
18.3 Swept Source Architecture
EXALOS has developed a miniature external-cavity swept laser based on a micro-optic integrated platform that allows for compact embodiments, performance flexibility, field reliability, and economy of scale (Fig. 18.4). This laser architecture integrates a broadband semiconductor optical amplifier (SOA) gain chip, a high-speed resonant 1D micro-electro-mechanical system (MEMS) scanning mirror, and a proprietary diffraction grating on a temperature-controlled optical bench inside a 26-pin butterfly package (Fig. 18.5). In the category of longitudinal multimode lasers, this is a truly self-contained compact packaging. Contrary to monolithic devices such as the Vernier-tuned distributed Bragg reflector (VT-DBR) laser [22] and MEMS-tuned vertical-cavity surface-emitting laser (MEMS-VCSEL) [23], this hybrid platform offers realizing lasers in different spectral regions (from 400 to 2,500 nm) and at different sweep frequencies (currently 1–200 kHz).
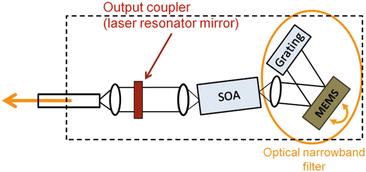
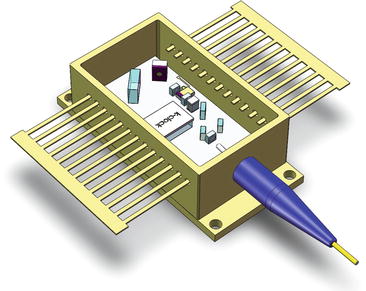
Fig. 18.4
Schematic of external-cavity swept laser with Littrow configuration. The dashed line represents the optical butterfly module, indicating that the entire laser cavity is contained inside the module
Fig. 18.5
3D model of the external-cavity swept laser in a butterfly package
Numerous design parameters for the critical components must be well-matched in order to generate a high-performance swept source. First, the high-performance SOAs are designed in-house for a wide spectral gain and linear behavior to enable long coherence sources in various spectral regions. Second, the wavelength scanning mechanism is based on a MEMS mirror. The long-term stability of the MEMS is extremely high as it is based on mono-crystalline electro-static MEMS scanners that do not degenerate or degrade over time. Changes in resonance frequency are mainly due to temperature effects (e.g., warm-up effects from light on/off) but are minimized by the temperature-controlled optical platform. The custom-designed MEMS scanners offer high mechanical stability (shock resistance >5,000 g), high phase stability, and low jitter. Novel diffraction gratings are designed for ultra-high effective resolvance to achieve narrow filtering and hence long coherence lengths while maintaining high diffraction efficiency over a wide spectral range. Optical retarders are used to achieve the right cavity length in order to optimize laser dynamics and minimize mode-hopping noise. A free-space k-clock interferometer followed by balanced detection simplifies post-processing in OCT systems. The A-scan trigger is directly derived from the MEMS clock and therefore is always in sync with the MEMS movement. The sweep is sufficiently stable such that one can create a remapping vector for initial calibration and continue to use the same remapping vector for hours of continuous use. The electronic A-scan trigger used in the swept source is derived from a crystal oscillator, which gives a timing jitter down to a few picoseconds. Due to the high Q factor, there is only little noise transferred from the electronics driver to the MEMS scanner.
Stay updated, free articles. Join our Telegram channel

Full access? Get Clinical Tree


