Fig. 69.1
Schematic of the time-domain intracoronary optical coherence tomography system. Polarized, broad bandwidth light passes through a circulator (CIRC, port C1 to port C2) and is split into reference and sample arms via a 10/90 fiber-optic beam splitter. The optical path length (group delay) of the reference arm is scanned by translating the galvanometer of the rapidly scanning optical delay (RSOD) line. Sample arm light is coupled into the catheter by a rotating optical junction (ROTJ). Light returned from the reference and sample arms is combined at the splitter and transmitted back to the circulator at port C2. The circulator then passes this light through port C3 to a polarizing beam splitter (PBS). The two orthogonal polarization states are detected separately by photodiodes D1 and D2. The two signals are demodulated and summed to create the final output signal, which is digitized (A/D) and transferred to the CPU. Detection of the fringe patterns created by sample and reference arm interference allows one radial scan (A-line) to be constructed that maps tissue reflectivity to a given axial or depth location. A cross-sectional image is generated by repeating this process at successive transverse locations on the sample while the ROTJ rotates the internal components of the catheter
69.4 Ex Vivo Studies
Plaque characterization The first steps in validating this imaging modality were to establish and test the accuracy of objective image criteria for discrimination of atherosclerotic plaque types ex vivo. A total of 357 specimens (162 aortas, 105 carotid bulbs, and 90 coronary arteries) were obtained from 90 cadavers (48 male, 42 female, mean age 74.5 ± 13.25). The specimens were examined fresh, less than 72 h postmortem. Imaging was conducted at physiologic temperature (37 °C). For the training set, 50 cadaver plaques were imaged by OCT and correlated with histology obtained at the imaging site [57]. Registration was accomplished by placing ink marks on the tissue prior to imaging so that both OCT images and histopathology slides contained visibly recognizable reference points. Fibrous plaques were characterized by homogeneous, signal-rich regions, fibrocalcific plaques by signal-poor regions with sharp borders, and lipid-rich plaques by signal-poor regions with diffuse borders (Fig. 69.2). Two blinded readers prospectively applied these criteria to images of the remaining 307 plaques (validation set). Using histopathologic diagnosis as the gold standard, the accuracy of OCT for characterizing plaque type was then determined. These criteria yielded a sensitivity and specificity ranging from 71 % to 79 % and 97 % to 98 % for fibrous plaques, 95–96 % and 97 % for fibrocalcific plaques, and 90 %–94 % and 90–92 % for lipid-rich plaques, respectively (overall agreement, κ = 0.84). These results demonstrated that objective OCT criteria are highly sensitive and specific for differentiating lipid-rich plaques from other plaque types [57].
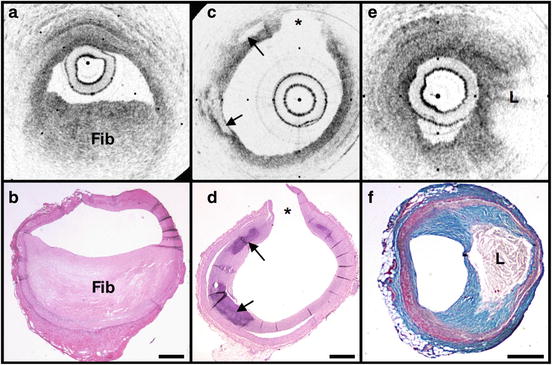
Fig. 69.2
OCT images and corresponding histology for fibrous (a, b), calcific (c, d), and lipid-rich (e, f) plaque types (obtained ex vivo). In fibrous plaques, the OCT signal (Fib) is observed to be strong and homogenous. In comparison, both calcific (arrows) and lipid-rich regions (L) appear as signal-poor regions within the vessel wall. Lipid-rich plaques have diffuse or poorly demarcated borders while the borders of calcific nodules are sharply delineated. (b, d) Hematoxylin and eosin; (f) Masson’s trichome; original magnification 40×. Scale bars, tick marks, 500 μm
Quantification of macrophage content Macrophages are central to the etiology of coronary artery disease [12, 65–67]. Due to the high quantity of intracellular phagolysosomes containing lipid and other cellular debris, we hypothesized that the refractive index contrast provided by the cytoplasm of macrophages would result in a strong optical signal from these cells (Fig. 69.3). Furthermore, since macrophages are typically heterogeneously distributed in atherosclerotic tissue, the spatial variance of OCT signal in plaques with high macrophage content should also be elevated. In order to test this hypothesis, cap macrophage and smooth muscle densities of 27 necrotic core fibroatheromas were quantified by analyzing indirect horseradish immunoperoxidase staining of paraffin-embedded tissue sections incubated with CD68 and smooth muscle actin monoclonal antibodies, respectively [68]. Hematoxylin was the counterstain. Morphometric measurements (single 10×, cross-sectional field) of cell density (% area stained) within a 500 μm (lateral) ×125 μm (axial) region of interest were then compared to the normalized standard deviation (NSD) of the OCT signal intensity at corresponding locations [68]. We found a high degree of positive correlation between OCT and histologic measurements of fibrous cap macrophage density (r = 0.84, p < 0.0001) and a negative correlation between OCT and histologic measurements of smooth muscle actin density (r = −0.56, p < 0.005). A range of NSD thresholds (6.15–6.35 %) yielded greater than 90 % sensitivity and specificity for identifying caps containing >10 % CD68 staining. This study demonstrated that the high contrast and resolution of OCT enables the quantification of macrophages within fibrous caps of atherosclerotic plaques. The impact of this finding was significant, as prior to this work there was no established tool that could permit the investigation of these crucial inflammatory cells in patients.
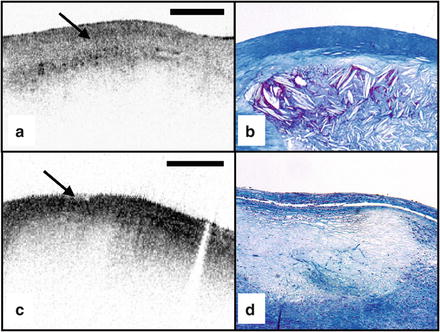
Fig. 69.3
(a) OCT image of a fibroatheroma with a low density of macrophages within the fibrous cap (arrow) (obtained ex vivo). (c) OCT image of a fibroatheroma with a high density of macrophages within the fibrous cap (arrow). (b, d) Histology corresponding to (a) and (c), respectively; Masson’s trichome; original magnification 40×. Scale bars (both OCT and histology), 500 μm
Other plaque features While the previously described studies demonstrated accurate characterization of features associated with TCFAs, OCT is capable of identifying additional plaque components that may be associated with acute coronary events. These features are described below:
Calcific nodules Calcific nodules have been associated with plaque thrombosis in a minority of cases [3, 5]. Calcium by OCT appears as a signal-poor region with a sharp delineation between the nodule and the surrounding tissue (Fig. 69.2c). In our histopathologic study of plaque characterization, we were able to use this criterion to diagnose calcific nodules with 96 % sensitivity and 97 % specificity [57].
Thrombus Differentiation of thrombus from plaque is critical for accurate plaque characterization. In addition, there is evidence to suggest that thrombus type, platelet-rich versus red blood cell-rich, is an indicator of the flow conditions associated with the thrombus formation and could be an important predictor of the efficacy of thrombolytic therapy [69]. We have conducted a study to correlate histopathologic sections of thrombus with OCT. Our preliminary results suggest that a “red” thrombus (red blood cell-rich) rapidly attenuates the signal in a manner similar to whole blood (Fig. 69.4a). In contrast, a “white” thrombus (platelet-rich) appears to exhibit a homogeneous moderate-strong signal with significantly less attenuation (Fig. 69.4b) [62]. In our experience, both forms of thrombus are usually easily distinguished from the arterial wall proper [70].
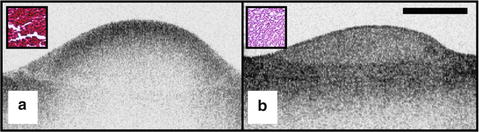
Fig. 69.4
OCT images of red blood cell-rich (a) and platelet-rich (b) thrombi (obtained ex vivo). The red blood cell-rich thrombus demonstrates high OCT signal attenuation, whereas the platelet-rich thrombus shows a homogeneous scattering signal with relatively little attenuation. Insets depict corresponding histology sections from each thrombus; hematoxylin and eosin; original magnification 40×. Scale bar, 500 μm
Macrophages at the cap–lipid pool border High-resolution cross-sectional optical imaging affords the unique opportunity to study the location of macrophage accumulations within a given plaque cross section. Using our macrophage dataset [68], we found that 84 % of OCT images demonstrated a high signal at the junction between the cap and the lipid pool (Fig. 69.5a, b) when CD68 staining at this interface was greater than 50 %.
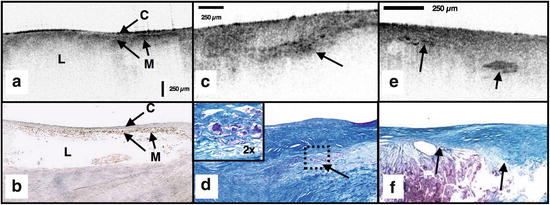
Fig. 69.5
(a) OCT image of a fibroatheroma with macrophages (M) present at the cap (C) lipidpool (L) interface (obtained ex vivo). (c) Cholesterol crystals (arrows) appear as signal-rich linear structures. (b, d) Histology corresponding to (a) and (c); (b) CD68; (d) Masson’s trichome; (e) cholesterol crystals with corresponding Masson’s trichrome histology (f) ; original magnification 40x. Scale bars (both OCT and histology), 250 μm
Cholesterol crystals Research investigating the biomechanical properties of atherosclerotic plaques has shown that the presence of cholesterol crystals increases the stiffness of lipid pools and, as a result, may decrease the likelihood of plaque rupture [71]. Images of cholesterol crystals demonstrate oriented, linear, highly reflecting structures within the plaques (Fig. 69.5e, f) [72].
Neovascularization. Neovascularization in coronary plaque is also considered to relate with plaque vulnerability [73]. Although there is little histopathologic validation of IVOCT for neovascularization, an international community of IVOCT experts believes that the OCT images of neovascularization are identified as small, continuous regions with little or no IVOCT backscattering (presumably due to the removal of blood via flushing), frequently observed over several frames [74].
69.5 Clinical Studies
Histopathologic validation of qualitative and quantitative image criteria ex vivo provided a foundation for interpreting data obtained from living human patients. Between January 2000 and September 2003, a total of 83 patients undergoing routine percutaneous coronary intervention (PCI) were enrolled in a study at the Massachusetts General Hospital (Boston, MA) to investigate the feasibility of intracoronary OCT. Informed consent was obtained for all patients. Imaging was performed in culprit lesions and remote sites with IVUS and OCT pre- and postcoronary intervention [62, 75]. Clear visualization of the arterial wall was accomplished by use of intermittent saline flushes (8–10 cm3) through the guide catheter. All patients tolerated the procedure well without short- or long-term complications. Images demonstrating detailed arterial microstructure were successfully obtained in all patients studied and in all three major coronary arteries [62, 75]. To compare IVUS and OCT, images were registered by angiographic visualization of the catheter tip, anatomical landmarks, and guide catheter tip location. Summaries of the results from our clinical study are described below:
OCT images obtained in living patients contained the same image features as those obtained ex vivo. All of the characteristics of macrophage-rich TCFAs as well as the additional plaque features described in the previous section were observed in vivo; there were no image features in the clinical data that had not been observed ex vivo (Fig. 69.6) [62]. These observations suggest that image interpretation criteria and algorithms validated ex vivo can also be applied to images obtained from patients.
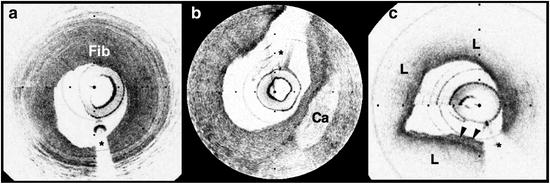
Fig. 69.6
OCT images of coronary plaques acquired from living human patients (obtained in vivo). (a) Fibrous plaque (Fib); (b) calcific nodule (Ca); (c) TCFA with circumferential lipid pool (L) and a region consistent with a platelet-rich thrombus (arrowheads). *Guidewire artifacts. Tick marks, 500 μm
OCT observations were consistent with IVUS, the current gold standard for intracoronary imaging [62]. Although IVUS is unable to resolve microstructural features associated with vulnerable plaque, it can identify non-atherosclerotic (normal) vessels, large thrombi, calcific deposits, and pronounced arterial disruptions. While unconfirmed, indirect evidence suggests that IVUS may detect large lipid deposits [24]. A study was conducted, comparing 17 OCT-IVUS image pairs obtained from ten patients [62]. In all cases where IVUS identified these characteristics, blinded OCT observations were consistent (Table 69.1). OCT detected additional cases of intimal hyperplasia, thrombus, intimal disruption, and lipid pool not identified by IVUS [62].
Table 69.1
IVUS and OCT findings for corresponding image pairs (n = 17)
Feature | A. Identified by both OCT and IVUS | B. Identified by OCT alone |
|---|---|---|
Intimal hyperplasia | 3 (3 patients) | 8 (7 patients) |
Internal elastic lamina | NE | 11 (8 patients) |
External elastic lamina | NE | 10 (7 patients) |
Plaque | 17 (10 patients) | 0 |
Fibrous plaque | 13 (10 patients) | 0 |
Calcific plaque | 4 (4 patients) | 0 |
Echolucent region | 2 (2 patients) | 2 (2 patients) |
Imaging of culprit lesions demonstrated a higher prevalence of TCFA in patients with acute coronary disease than patients with stable coronary disease [76]. In this analysis, TCFA was defined as a plaque with lipid area ≥2 quadrants and cap thickness <65 μm. From a total of 57 patients, 20 presented with AMI, 20 with an acute coronary syndrome (ACS), and 17 with stable angina pectoris (SAP) [77]. TCFAs identified by OCT were found in 13 AMI patients (65 %), 9 with ACS (45 %), and 3 with SAP (18 %) [76]. TCFAs were more prevalent in acute presentations (AMI and ACS) of CAD (55 % versus 18 %, p = 0.012) [76]. Plaque disruption was found more frequently in acute CAD (20 % versus 12 %, p = 0.053) and calcifications were more frequent in stable disease (41 % versus 12 %, p = 0.049) [76]. These findings represent the first observation of presentation-dependent plaque morphology in living human patients and confirm our current knowledge of the relationship between morphology and patient outcome that has been obtained in previous autopsy studies [3–7].
Macrophage content was significantly higher in fibroatheroma caps in patients with acute presentations of CAD versus caps in patients with SAP [78, 79]. For this study, we created NSD (macrophage density) images (Fig. 69.7) and analyzed the macrophage distributions in both culprit and remote plaques (n = 225) of 49 patients with different clinical syndromes. Macrophage density was found to be significantly higher in the AMI (5.54 ± 1.48 %) and ACS (5.86 ± 2.01 %) groups compared to the SAP group (4.14 ± 1.81 %) (p < 0.003) [78, 79].
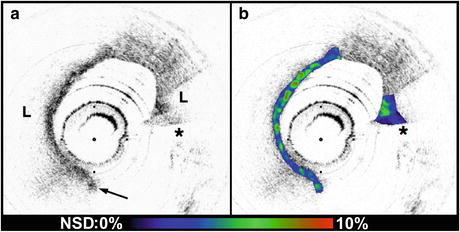
Fig. 69.7
(a) Conventional OCT image of a ruptured TCFA obtained from a patient with AMI (obtained in vivo). (b) In this image, macrophage density data (NSD) from the fibrous cap is displayed using a color look up table. L lipid pool, arrow intimal disruption, *guidewire artifact. Tick marks, 500 μm
Both focal and multifocal elevations of macrophage density were associated with severity of clinical presentation [79]. There is great interest in understanding the role of focal versus multifocal plaque features in the pathogenesis of acute coronary thrombosis. The unique ability of OCT to quantify macrophage content and observe the spatial distribution of plaque macrophages provides a valuable tool for investigating this critical question. Supporting the concept of focal risk, sites of plaque rupture demonstrated a greater macrophage density than non-rupture sites (6.95 ± 0.48 %, 5.71 ± 0.37 %; p = 0.01) [79]. In addition, macrophage density was significantly higher at the surface (first 50 μm) of culprit plaques in comparison to remote lesions, indicating that superficial macrophages confer a higher risk for developing an acute thrombus [79]. This finding represents a new understanding of the role of macrophages in the pathogenesis of acute coronary disease and may provide an additional parameter to assess individual plaque risk.
We also found evidence in support of the multifocal hypothesis. Macrophage densities at remote sites were correlated with measurements at culprit sites within the same patient (r = 0.66; p = 0.01) [79]. Fibrous plaques, which are not considered to be high-risk lesions, had a higher macrophage content in patients with acute disease, compared with stable patients (p = 0.025) [79]. Taken together, these results suggest that both focal and generalized macrophage distributions play important roles governing the severity of CAD (Table 69.2).
Table 69.2
OCT findings from MGH clinical study (n = 57). TCFA indicates thin-cap fibroatheroma (lipid ≥2 quadrants + fibrous cap thickness ≤65 μm)
Finding | AMI (n = 20) | ACS (n = 20) | SAP (n = 17) | P |
|---|---|---|---|---|
Lipid plaque, no. of quadrants | 18 | 18 | 15 | |
1 | 0 | 3 | 5 | |
2 | 7 | 8 | 5 | |
3 | 5 | 5 | 3 | |
4 | 6 | 2 | 2 | |
Lipid-rich plaque (≥2 quadrants) | 18 | 15 | 10 | 0.09 |
Fibrous cap thickness (μm)a | 47.0 (n = 18) | 53.8 (n = 18) | 102.6 (n = 15) | 0.034 |
TCFA | 13 (n = 18) | 9 (n = 18) | 3 (n = 15) | 0.012 |
Plaque disruption | 5 | 3 | 2 | 0.053 |
Calcification | 2 | 3 | 7 | 0.049 |
Thrombus | 4 | 5 | 6 |
Neointimal hyperplasia and neoatherosclerosis. After these initial demonstrations, OCT has been widely applied for investigating many aspects of coronary artery disease in clinical trials, including evaluation of coronary artery plaque, stent placement, stent strut coverage by neointimal hyperplasia, and stent neoatherosclerosis [80–82]. In general, these studies have shown that IVOCT is capable of detecting plaque rupture, fibrous cap erosion, and intraluminal thrombus, all of which are considered to be vulnerable features of coronary artery disease [80]. Regarding stent-related lesions, OCT could clearly visualize thin neointima and uncovered struts after drug-eluting stent (DES) implantation [81, 82]. IVOCT has also been used to provide information regarding the prognosis of coronary artery disease. One observational IVOCT trial demonstrated that TCFA and neovascularization are independent predictors of luminal progression [83]. Although this result seems to support that the TCFA has the potential to precipitate plaque progression in vivo, whether or not OCT-derived TCFA leads to ACS still remains an open question. A recent pathological study showed that neoatherosclerosis and consequent plaque vulnerability can occur even in previously stented lesions after long incubation period [84]. An in vivo OCT observational study revealed that late-phase BMS (>5 years) showed higher incidence of vulnerable atherosclerotic changes, including lipid-laden intima, intimal disruption, and thrombus, than early-phase BMS (<6 months) [85]. Neoatherosclerosis in the stented lesion is currently thought to be an emerging, yet important mechanism of very late stent failure, including thrombosis and restenosis [86, 87].
Limitations of TD–OCT technology for intravascular use. With IVOCT, blood interposed in between the catheter and the arterial wall attenuates the OCT light and signal to the point where only a few hundred microns can be seen through without total degradation of the OCT image quality. Saline purging adequately removes blood from the field, but at the slow frame rates (4–8 fps), intracoronary TD-OCT with saline flushing reduces to a single or few frame cross-sectional measurement. As a result, large area screening of vessel pathology over the entire artery is difficult with this methodology. Proximal balloon occlusion of the coronary artery followed by saline perfusion has been used with good effect [88, 89]. Proximal balloon occlusion is undesirable, however, because of its potential to injure the vessel wall and cause temporary myocardial ischemia.
69.6 Optical Frequency-Domain Imaging
A second-generation form of OCT, termed optical frequency-domain imaging (OFDI) or frequency-domain OCT (FD-OCT), has been developed for clinical use. These technologies have now essentially solved intraluminal blood difficulty by imaging and significantly faster than that possible with TD-OCT [90]. The system provides imaging at rates exceeding 100/s and imaging depth ranges greater than 5 mm. In 2006, swine studies were performed to provide a preliminary test of the utility of intracoronary OFDI in vivo and to assess the use of an injector pump (MedRad; Mark IV) for delivering saline through the guide catheter. Multivessel imaging was performed in four swine with several pullbacks per vessel and saline delivery rates ranging from 1 to 4 cm3/s. In each case, the guide catheter was a seven Fr Cordis BrightTip. For each pullback, the longitudinal length of the vessel over which diagnostic-quality images were obtained was quantified. For all data, the pullback speed was set to 16.2 mm/s corresponding to a longitudinal pitch of 150 μm. A total of 56 pullbacks were performed in four swine: 22 in the RCA, ten in the LAD, and 24 in the circumflex arteries. Clear visualization of the vessels was terminated by either (1) the retraction of the imaging core within the guide catheter (33 of 56 pullbacks), (2) the end of acquisition (11 of 56 pullbacks), or (3) blood reentering the field of view (12 of 56 pullbacks). Including pullbacks in all three arteries, for a saline delivery rate of 4 cm3/s, the average pullback length was 73 mm (average time = 4.5 s); for 3 cm3/s, the average length was 52 mm (avg time = 3.2 s); for 2 cm3/s, the average length was 47 mm (avg time 2.9 s); and for 1 cm3/s, the average length was 37 mm (2.3 s).
Stay updated, free articles. Join our Telegram channel

Full access? Get Clinical Tree


