Fig. 71.1
Illustration of the effects of projection angle on angiographic visualization of an eccentric lesion. (a) Coronary angiogram of a lesion in the left-anterior descending artery. (b) Apparent diameters of the lumen of a cross section of the lesion, viewed from the two projection directions A and B. The OCT image of the artery shown here shows the actual cross section of the lumen
Length distortion (‘foreshortening’) is another important limitation of angiography that results from viewing arteries from a single projection angle. Foreshortening occurs when arteries bend sharply in the direction of the X-ray source or detector. To avoid selecting a stent that is too short to cover an entire lesion, the cardiologist must choose the appropriate projection angle for measurement of lesion length. Intravascular OCT and IVUS imaging systems incorporate constant-speed pullback mechanisms to acquire spiral image sequences from which length of lesions can be measured with minimal foreshortening.
Over the years since the first intravascular ultrasound studies were performed in the late 1980s, the importance of assessing the composition and thickness of the plaque prior to treatment of coronary lesions has become increasingly recognized [25]. For the most part, angiography is limited to detecting blood flow alterations caused be narrowing of the vessel lumen. Except for subtle clues that signal the presence of ruptured plaque and thrombus, angiography is blind to structures inside the arterial wall. Therefore, lesions that contain soft, diffusely thickened fibro-fatty tissue or hard calcified tissue are difficult to distinguish by angiography alone. Even arteries with walls distended by thick plaques that are composed of highly thrombotic lipid and cholesterol deposits can remain undetected in routine diagnostic angiograms. Since heavily calcified lesions are often difficult to expand with a balloon and increase the risk of vessel perforations, intravascular imaging technologies that visualize the distribution of superficial calcium in lesions can be valuable for guiding stent implantation. Although composition-specific treatment guidelines have not yet been established, the development of such guidelines continues to be an active area clinical research that has been enabled by advances in intravascular imaging [37].
Better visualization of stented arteries has been another driving force behind the development of intravascular imaging technologies. Stents are not seen clearly enough in standard angiograms to determine reliably whether the struts of an expanded stent contact the wall of the artery over its entire circumference. When a drug-eluting stent is poorly expanded, its effectiveness can be diminished if a portion of the drug elutes into the bloodstream rather than the arterial wall. On the other hand, over-expansion of a stent can cause tears (‘dissections’) in the arterial wall. Intravascular imaging is used frequently as an adjunct to angiography for optimizing stent expansion and for guiding repair of flow-limiting dissections. In follow-up procedures, intravascular imaging is also employed as a clinical research tool for observing neointimal proliferation, thrombus formation and other biological responses of the arterial wall to different types of stents in different patient populations. These and other applications of OCT are described in greater detail in Sect. 71.4.
71.2 Intravascular OCT Technology
Imaging coronary arteries in the beating heart is a challenging application that places stringent demands on the design and manufacture of intravascular OCT systems. Although these systems have many components in common with other endoscopic OCT systems, a number of application-specific technical features merit closer examination.
71.2.1 Brief History
Since the first in vivo OCT images of coronary arteries were acquired in animal studies in 1999 [9], intravascular OCT has evolved via parallel advances in technology and clinical application (Fig. 71.2). Early work focused on correlating OCT images of different plaque types with histology and IVUS images. An important early milestone was the publication of the results of the first patient study, performed with an OCT system built by researchers at the Massachusetts General Hospital (MGH, Boston, MA, USA) ([17]). At the same time as these patient studies were being carried out, LightLab Imaging, Inc. (Westford, MA, USA) was evaluating the first commercial prototypes of intracoronary OCT systems [10, 13]. Based on time-domain OCT with mechanical path-length scanning mechanisms, this first generation of OCT systems captured cross-sectional images at a line rates of 1,000–2,400 lines/s at frame rates of 5–10 frames/s. Because of their limited image acquisition speeds, early instruments could capture only snapshot images while the blood was cleared from the artery during injection of a bolus of saline or angiographic contrast medium through the guide catheter. During the period 2000–2003, other prototype coronary catheters were developed that incorporated custom flush injection ports for blood clearance and allowed imaging through percutaneous transluminal coronary angioplasty (PTCA) balloons. Nonetheless, the application of coronary OCT was limited to a few clinical research studies until the M2 OCT Imaging System (LightLab Imaging, Inc, Westford, MA; Goodman, Ltd., Nagoya, Japan) was released for sale in Japan and the European Union in 2004. The M2 system utilized an OCT imaging wire (ImageWireTM) inserted through the central lumen of a low-profile occlusion balloon catheter (HeliosTM). This catheter delivery system enabled pullback imaging over arterial segments several centimeters long. Approximately 30 s were required to obtain a pullback image over a 3-cm length of artery (Fig. 71.2).
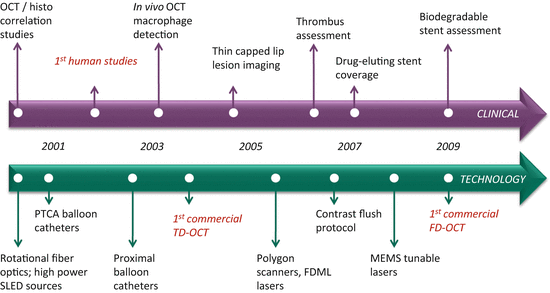
Fig. 71.2
Milestones in intravascular OCT which evolved via parallel advances in technology and clinical application
After the commercial release of the LightLab M2 system and its faster (4,800 lines/s; 20 frames/s) successor, the M3 system, the application of OCT expanded rapidly. In particular, the ability of OCT to characterize the various manifestations of atherosclerosis and thrombosis was demonstrated [18, 20, 21]. Results of early OCT studies provided insight into the mechanisms of plaque formation, distribution, and growth, especially in patients suffering from acute coronary syndromes [19, 24]. The high resolution of OCT and its ability to distinguish different plaque types were recognized as potential advantages of OCT in PCI guidance and optimization. OCT also played an important role in understanding the vascular response of arteries to implantation of the first generation of drug-eluting stents, as well as several other novel therapeutic devices introduced in the years between 2002 and 2009 [14, 26].
Although imaging speed had long been seen as the key to achieving more detailed scans of longer vessel segments without inducing ischemia [31], the speed of the M3 OCT system was close to the limit imposed by mechanically scanned time-domain OCT technology. With the development of frequency-domain OCT, a new chapter in intravascular imaging was opened [2]. The first published in vivo study of intracoronary frequency-domain OCT imaging was performed using a prototype system developed at the Massachusetts General Hospital [49]. Based on a swept-source laser, this system acquired images at 100 frames/s, without loss of resolution, imaging range, or signal-to-noise ratio in comparison with its time-domain predecessors. The first commercially available frequency-domain OCT system (C7XRTM, LightLab Imaging/St. Jude Medical, Westford, MA), was introduced in the European Union in 2009 and in the United States in 2010. Based on a swept-source laser, the C7XRTM OCT Imaging System images a 5.4 cm segment of a coronary artery in less than 3 s during the injection of a bolus of angiographic contrast medium. Scheduled to be released in Japan in 2012, but not yet cleared for sale by the US Food and Drug Administration, St. Jude Medical’s latest commercial OCT system (ILUMIEN OPTISTM, LightLab Imaging/St. Jude Medical, Westford, MA) captures images of 7.5 cm arterial segments at 180 frames/s. Both of these systems are enabled by the development of rapid contrast injection protocols with software triggering that automatically detects blood clearance. The ILUMIEN OPTISTM also incorporates wireless pressure-sensing technology for measurement of fractional flow reserve (FFR).
71.2.2 Clinical FD-OCT System
Intravascular FD-OCT systems, such as the C7XRTM and ILUMIENTM, consist of five main modules: an electro-optical engine; a catheter interface device (consisting of a drive motor and optical coupler or ‘DOC’); an imaging catheter; a data acquisition and processing system; and a software package for displaying and interacting with the resultant image data. In this section the ILUMIEN is used to illustrate a state-of-the-art clinical system architecture. Although the ILUMIEN system is also capable of performing intravascular pressure measurements using fractional flow reserve (FFR) technology, this section focuses on the OCT sub-system of the ILUMIEN.
A schematic diagram of an electro-optical engine is shown in Fig. 71.3. The engine contains the swept laser, OCT interferometer, and ancillary optics and electronics needed for generating the appropriate data acquisition events. To maximize the delivery of light onto the sample and minimize losses as backscattered light returns from the sample, a dual-circulator design with an asymmetric input split ratio is used for the OCT interferometer. The majority of the light from the swept laser is directed to the OCT interferometer via a fiber-optic splitter S1. A second splitter S2 directs a portion of the light to the sample arm via a first circulator C1 and DOC, and a portion of the light to the reference arm via a second circulator C2 and path-adjustable reference mirror. As the interface between the catheter and the imaging system, the DOC contains a fiber optic rotary coupler mounted to a translation stage. Light from the sample and reference arms is combined in a third splitter S3 and the resulting interference signal is detected by a dual-balanced receiver D1. This interference signal is routed to the analog input of a data acquisition (DAQ) card in a personal computer (PC).
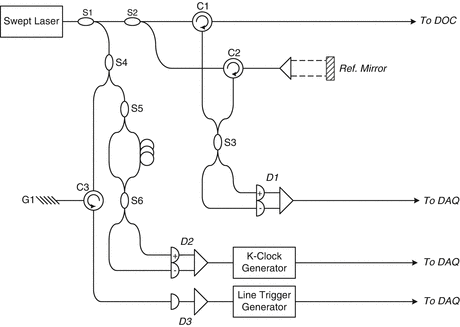
Fig. 71.3
Schematic diagram of the electro-optical engine inside the ILUMIEN OCT imaging system
OCT image lines are generated from the digitized interference signal via a fast Fourier transform (FFT). Prior to the FFT operation, the interference signals must be made linear in optical frequency k with respect to time and must also be parsed into segments corresponding to complete laser sweep cycles. An electronic line trigger, which pulses once per laser sweep, is generated via a fiber Bragg grating G1 attached to a circulator C3 and photodetector D3. The fiber Bragg grating is a narrow-band reflective filter with a reflection peak selected to match the center wavelength of the laser sweep. The resulting line trigger is routed to the trigger input of the DAQ card.
To ensure that the interference signal is sampled at uniformly-spaced optical frequency points, an electronic k-clock is generated from a Mach-Zehnder interferometer (MZI) with a fixed path offset [32]. The MZI consists of two 50/50 optical couplers S5 and S6 with a small relative path offset between the two fibers linking the couplers. The fixed interference pattern generated by the MZI is detected by a dual-balanced receiver D2. Zero crossings of the interference pattern are electronically determined by the k-clock circuit and converted into a digital pulse train, which is subsequently routed to the external clock input of the DAQ card.
A schematic of the distal tip of the DragonFlyTM imaging catheter is shown in Fig. 71.4a. The catheter has a 2.7 F (0.9 mm) distal outer diameter and is compatible with 6F (2 mm) guide catheters. A rapid-exchange (Rx) tip design allows delivery of the catheter over conventional 0.014″ intracoronary guidewires. Radiopaque bands demarcate the distal tip of the catheter as well as the approximate position of the imaging lens. A detail of the lens is shown in Fig. 71.4b. The lens is constructed from three segments of optical fiber with tightly controlled lengths are fusion-spliced to one another. A first coreless fiber section acts as a beam expander, allowing the light to fully fill the aperture of a multimode fiber section. The multimode fiber focuses the beam into a second angle-polished coreless section. The fiber-air interface acts as a total internal reflector, directing the beam out the side of the catheter. Figure 71.4c shows the lateral intensity profile of the beam at the focal plane. A focal spot of 23 um FWHM is obtained at a working distance of approximately 1–2 mm. The catheter is designed to rotate at 100 Hz and pull back at up to 25 mm/s, allowing a 54 mm vessel segment to be imaged in under 3 s. Highly-scattering red blood cells are temporarily cleared from the vessel during the pullback via an intracoronary injection of a viscous fluid, such as iodinated contrast dye used for fluoroscopy, through the guide catheter.
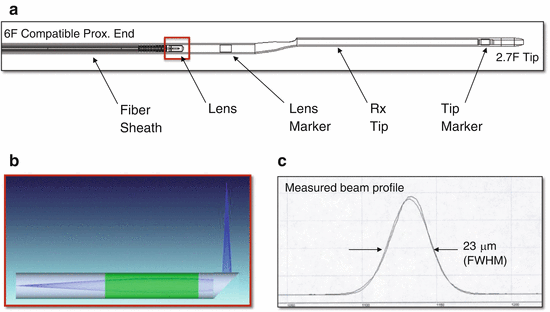
Fig. 71.4
(a) Schematic diagram of the distal section of the Dragonfly imaging catheter. (b) Detailed schematic of the fused fiber lens. (c) Beam profile of a typical fiber lens
After the OCT data have been acquired, the ILUMIEN software converts the individual image lines into polar frames and displays the data to the user. Figure 71.5 shows a typical screen shot from the ILUMIEN software. The cross-sectional B-mode image representing one rotational frame is displayed in the center of the screen. The longitudinal L-mode image showing a cut through one plane of the pullback is displayed in the bottom of the screen. The axis of the L-mode cut plane is shown as a yellow and blue bar through the middle of the B-mode image. A variety of measurement tools, including length, area, and percent stenosis, can be accessed using the right-hand toolbar. Quantitative measurement values appear in the left-hand information box. Additional visualization modes, such as a 3D rendering and a longitudinal plot of the mean vessel diameter, can also be accessed using a series of checkboxes on the left-hand side of the screen.
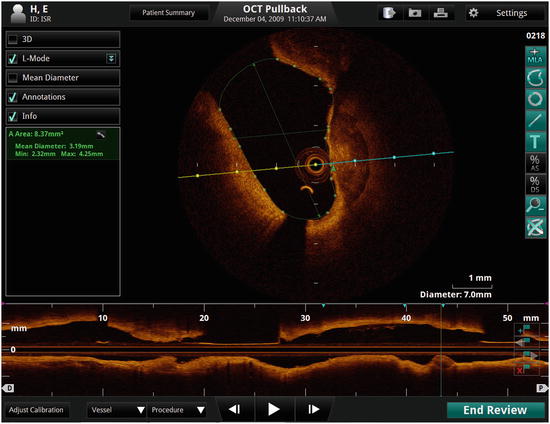
Fig. 71.5
Screen shot of a representative intravascular OCT pullback visualized on the ILUMIEN system software
71.3 Plaque Characterization
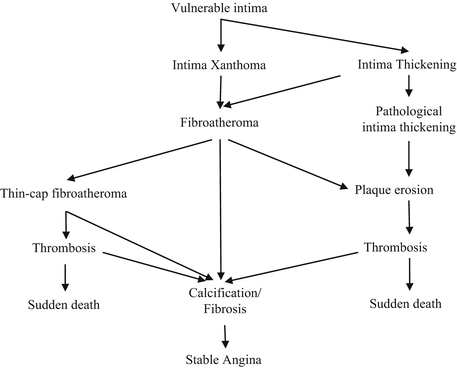
The detailed natural history of atherosclerosis is still an active area of research. Plaques are typically classified by their composition (fibrous, lipid-rich, calcific, etc.), as determined by histology. According to the guidelines published by American Heart Association and later revised by Virmani [36, 45], the evolution of plaque can be depicted as a series of complex branching steps, staged roughly according to the age and severity of the plaque (Fig. 71.6). Certain plaques reach a stable size and remain asymptomatic; others grow large enough to encroach on the lumen of the vessel and cause chest pain and other symptoms of myocardial ischemia; still others have thrombogenic properties that cause components of the blood to adhere and form clots. Plaques that thrombose and cause the rapid formation of intravascular blood clots are responsible heart attacks that can be fatal if not treated promptly.
Plaque visualization is important for treatment planning. The first experimental OCT studies were performed on post-mortem samples of excised aortas in mid-90s. In these studies, the salient features of fibroatheroma and fibrocalcific plaques seen in OCT images were first described [5]. In 2002, Yabushita et al. published a qualitative image classification scheme based on correlation of OCT images with histology [48]. Fibrous tissue was identified in OCT images as homogeneously signal-rich regions, calcified tissue as heterogeneous signal-poor regions with sharp borders, and lipid tissue as homogeneously signal-poor regions with diffuse borders. Later, by comparing the OCT images to IVUS images, Jang et al. confirmed that the same criteria were applicable to in vivo OCT images [17]. As intracoronary OCT imaging has become more widespread, additional tissue components have been identified. Tearney et al. reported that macrophage foam cells can be detected and quantified with high sensitivity and selectivity by calculating the normalized standard deviation in user-selected regions of interest [40]. Kume et al. reported that red and white thrombus can be distinguished based on their signal-attenuation properties [21], an observation that has been confirmed by subsequent studies [29]. Figure 71.7 shows a few examples of OCT images of different plaque types and their corresponding histology images. The qualitative OCT image features and corresponding bulk optical properties of main coronary artery tissue types are summarized in Table 71.1. An international consensus document (referred to as the Consensus Standard from here on) was recently published to serve as a reference for the interpretation of intravascular OCT images [41].
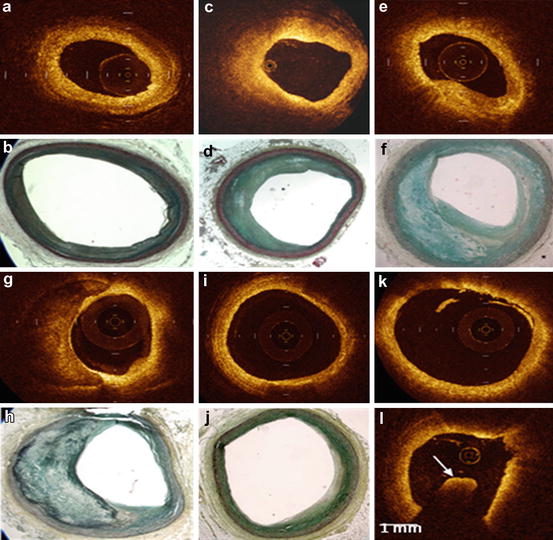
Fig. 71.7
(a–j) OCT and corresponding histology for different plaque types: (a–b) mostly healthy artery, (c–d) fibrotic plaque, (e–f) fibroatheroma, (g–h) fibrocalcific plaque, (i–j) foam cells. (k, l) OCT image of a red and white thrombus, respectively
Table 71.1
OCT image features of main coronary artery tissue types
Tissue | Qualitative OCT features |
|---|---|
Fibrous tissue | Homogeneous, signal-rich, birefringent |
Calcification tissue | Heterogeneous, sharply bordered, signal-poor, low birefringence |
Lipid-rich tissue | Signal-rich at the top, high attenuation regions; low birefringence
Stay updated, free articles. Join our Telegram channel
Full access? Get Clinical Tree
 Get Clinical Tree app for offline access

|