(49.1)
where E is the applied electric field, ε 0 is the permittivity of free space, χ(1) is the linear susceptibility, χ(n) is the nth-order nonlinear susceptibility (for n > 1) [21–23]. Linear effects including absorption and scattering relate to the linear susceptibility χ(1), whereas nonlinear effects depend upon the higher-order susceptibilities χ(n). Specifically, scattering is related to χ(1), SHG to χ(2), and TPEF to χ(3), respectively. Due to the nonlinear effects, both the SHG and TPEF intensities depend quadratically on the incident laser power [3, 24, 25].
The energy diagrams of TPEF and SHG are illustrated in Fig. 49.1. In TPEF, a susceptible molecule absorbs two photons simultaneously and is excited from ground state to a real excited state. When the molecule returns to the ground state, it emits a fluorescence photon that has ω f < 2ω, where ω is the angular frequency of the incident light. In SHG, a molecule interacts with two photons simultaneously and is excited to a virtual excited state. When the molecule returns to the ground state, it emits an SHG photon which has ω h = 2ω. In OCT, the scattering signal is at the same frequency as the incident beam, which has ω s = ω. Therefore, the three contrast signals in MPM/OCT have different frequencies and can be separated using dichroic mirrors and filters.
Fig. 49.1
Energy diagrams of TPEF and SHG
The TPEF signal derives from intrinsic sources, such as elastin, NADH, and flavins, and exogenous fluorophores, such as various fluorescent dyes conjugated to molecular probes. Intrinsic TPEF signals have been observed from cells, collagen, and elastin fibers. Using exogenous probes, TPEF can image targeted subcellular structures and specific proteins. The generation of SHG signals requires a non-centrosymmetric molecular structure. SHG imaging has been primarily applied to collagen fibers, a common structural extracellular matrix protein. Therefore, MPM contrasts are of high biochemical specificity. Meanwhile, OCT detects backscattered light from refractive index discontinuities in cells and tissues. OCT contrast lacks the biochemical specificity.
Furthermore, MPM and OCT are also complementary in imaging resolution, speed, and FOV. MPM provides a sub-micrometer resolution over an FOV of a few hundred micrometers, while OCT has an FOV over a few millimeters at a resolution of ∼10 μm. Imaging speed of MPM is typically ∼1 fps, while spectral-domain OCT can be as fast as ∼100 fps. Because of their complementary characteristics, MPM and OCT are especially suitable for developing multimodal imaging for clinical applications.
Compared to traditional MPM and OCT, multimodal MPM/OCT can provide multiple complementary contrasts and FOVs and thus is very important for label-free imaging to obtain a sufficient set of parameters for reliable sample analysis. When combined into a single platform, their multiple contrasts can be acquired simultaneously. The sensitivity of MPM to cells and extracellular matrix and of OCT to interfaces can enable observations of cell-cell and cell-matrix interactions during the development of neovasculature, cell migration, and extracellular matrix remodeling. These events are fundamentally important to nearly all biological processes, from growth and development to cancer, wound healing, aging, and diabetes. Furthermore, integrating MPM with OCT can provide multi-scale FOVs, covering a large area for screening and a high-resolution zoom-in for molecular identification. With benefits from both MPM and OCT, the combined system can provide a powerful imaging tool that has both sensitivity and specificity to detect precancerous and cancerous lesions.
While traditional OCT provides a cross-sectional view of layered tissue structures, optical coherence microscopy (OCM), a variation of OCT, provides high-resolution en face view of tissue microstructures. In the following, two types of multimodal MPM/OCT systems will be presented: the MPM/OCM and the multi-scale MPM/OCT systems. The MPM/OCM is a microscopy technique that is able to acquire multiple contrasts, including SHG, TPEF, and scattering simultaneously. The multi-scale MPM/OCT is capable of both tissue level and cellular level imaging, where OCT images layered tissue structures and MPM images cells and extracellular matrix.
49.2.1 MPM/OCM System and Applications
By combining MPM with OCM, the multiple contrasts, including scattering, TPEF, and SHG, can be imaged simultaneously from the same spatial scale. The OCM contrast is scattering from refractive index discontinuities at tissue interfaces. The MPM contrasts include TPEF and SHG. TPEF originates from autofluorescence of tissue or exogenous fluorophores. Endogenous fluorophores in tissue include NADH in cell cytoplasm and elastin fibers, etc. SHG comes mainly from collagen fiber which is the most abundant extracellular matrix. Therefore, the multimodality system can acquire more information about tissues than a single modality alone. In MPM/OCM, high-resolution MPM and OCM images can be acquired from the same FOV of a few hundred micrometers, simultaneously.
MPM/OCM systems have been reported by several groups [8–11, 13, 26, 27]. Beaurepaire et al. [8] and Yazdanfar et al. [13] used ∼100 fs Ti:sapphire lasers for combining MPM with OCM. In these systems, the coherence length of the light sources could not match with the MPM axial resolution. To improve depth resolution, a pinhole was needed in front of the OCM detector, which largely limited the system sensitivity. Recently, a fiber-based MPM/OCM system was developed using a femtosecond fiber laser that also had a long coherence length of 16.1 μm [26].
We have developed a co-registered MPM/OCM system using a 12 fs Ti:sapphire laser [9, 10]. The axial resolution of OCM determined by the coherence length of the laser source was directly matched with the MPM axial resolution of ∼1.5 μm. Details about this system are presented in the following.
49.2.1.1 System Configuration
The schematic of the co-registered MPM/OCM system is shown in Fig. 49.2 [9]. A femtosecond Ti:sapphire laser (Femtolasers) is pumped by an Nd:YVO4 laser (Coherent). The center wavelength of the Ti:sapphire is 800 nm. The laser beam passes through a dispersion precompensation unit composed of two prisms. Afterwards, the laser beam is split by a beam splitter into two arms: the sample arm and the OCM reference arm. In the sample arm, the laser beam is raster scanned by two galvanometer mirrors in an en face mode. The TPEF and SHG signals are collected by the same objective lens in a backward direction and separated from the excitation source by a dichroic mirror (675DCSP, Chroma). The TPEF and SHG are separated by a second dichroic mirror (475DCLP, Chroma), selected by bandpass filters, and detected by two photomultiplier tubes (PMTs). For OCM imaging, a time-domain system was developed. The backscattered fundamental light is reflected by the beam splitter to a PIN detector where it is mixed with the reference beam. In the OCM reference arm, a scanning piezoelectric mirror generates a 5 kHz carrier frequency for OCM detection. OCM interference fringes are received by the PIN detector and processed by envelope detection. Three channels can simultaneously detect TPEF, SHG, and OCM signals. En face imaging is achieved by raster scanning the two galvanometer mirrors. For Z scanning, the sample is vertically scanned by a linear translation stage. The image size is 256 × 256 pixels. The pixel dwell time is ∼100 μs which is limited by the carrier frequency of the OCM interference fringe.
Fig. 49.2
Schematics of the multimodal MPM/OCM system. BS beam splitter, DM dichroic mirror, F filter, L lens, O objective, P prism, PP prism pair, PMT photomultiplier tube (From Ref. [9])
TPEF and SHG are nonlinear processes which depend quadratically on the incident laser power [3, 24, 25]. For MPM/OCM imaging, a femtosecond laser with a broad bandwidth is desirable, which provides short pulses (high peak power) for MPM imaging and a short coherence length for OCM imaging. However, for short pulses with broad bandwidth, pulse broadening due to dispersion is significant. Therefore, dispersion precompensation needs to be applied in order to compress the pulses to the femtosecond regime at the sample location [28, 29]. Dispersion precompensation can be achieved using two prisms. In the MPM/OCM system as shown in Fig. 49.2, the laser has a 12 fs pulse duration and 100 nm bandwidth. The laser output passes through a pair of fused silica Brewster prisms. The prism pair precompensates the dispersion from the objective lens and other optics in the beam path. Autocorrelation traces in Fig. 49.3 show 20 fs and 30 fs pulses obtained at the focal plane of a 10× and a 40× objective lens, respectively, after applying the dispersion precompensation. The 100 nm bandwidth is maintained as the short pulses propagate.
Fig. 49.3
Autocorrelation traces showing 20 fs and 30 fs pulses obtained at the focal plane of a 10× and a 40× objective lens, respectively
49.2.1.2 Co-registration
In a multimodality imaging system such as the MPM/OCM, co-registration is a critical issue. We need to ensure that the different modalities have matched resolutions in three dimensions, and the multichannel images are acquired from the same sampling volume. Due to their quadratic dependence on the incident laser power, TPEF and SHG signals are excited and confined within the focal volume of the objective lens. The MPM transverse and axial resolutions are determined by the focal diameter and the focal depth of the objective lens, respectively. For an objective lens with a numerical aperture of NA, the focal diameter (transverse resolution) is

and the focal depth (axial resolution) is

where λ0 is the illumination light wavelength and n is the refractive index of the immersion medium.
(49.2)
(49.3)
In OCM imaging, the transverse resolution is similarly determined by the focal diameter of the objective lens. However, its axial resolution comes from a different mechanism which is the coherence gating defined by the coherence length of the light source. For a light source with a Gaussian spectral shape, the coherence length is
where Δλ is the bandwidth of the light source [30].
(49.4)
In MPM imaging, a high NA objective lens is usually used in order to focus the laser beam to a small volume to achieve high efficiency of nonlinear excitation. To match the resolutions, especially the axial resolutions, between MPM and OCM, the coherence length of the light source needs to match with the focal depth of the objective lens. Figure 49.4 illustrates how the coherence length should be matched with the focal depth.
Fig. 49.4
Illustration of the axial and transverse resolutions of MPM and OCM
In the MPM/OCM system as shown in Fig. 49.2, a water immersion achroplan 63× objective lens (Carl Zeiss) of 0.95 NA is used. The theoretically estimated focal diameter is ∼0.5 μm, and the focal depth is ∼1.3 μm. The Ti:sapphire laser has a pulse width of 12 fs, a center wavelength of 800 nm, and a bandwidth of 100 nm. The bandwidth corresponds to a coherence length of 2.8 μm in free space or 1.87 μm in tissue (assuming n = 1.5). Therefore, with the ultrafast Ti:sapphire laser, the MPM and OCM resolutions can be matched closely. Figure 49.5 shows the measured transverse and axial point spread functions (PSFs) of the system. The transverse PSFs from the MPM and OCM match closely and the full width at half maximum (FWHM) is measured to be ∼0.5 μm. The axial PSFs for MPM and OCM are also matched with a measured axial resolution of ∼1.5 μm.
Fig. 49.5
Measured transverse (a) and axial (b) point spread functions of MPM and OCM. The circles are for MPM, and the squares are for OCM (From Ref. [9])
49.2.1.3 Applications
The multimodal MPM/OCM system has been applied to study cell-cell and cell-matrix interactions. Figure 49.6 shows MPM/OCM images of an organotypic RAFT tissue model [9]. The RAFT model consists of a basic polymerized collagen gel made up of type I rat-tail collagen and primary human dermal fibroblasts. The SHG image shows the organization of the collagen matrix, the TPEF image shows the autofluorescence from a fibroblast, and OCM shows the morphology of the RAFT including the extracellular collagen matrix and the cell. The combination of the three channels provides a more complete picture of the tissue with both structural and compositional information.
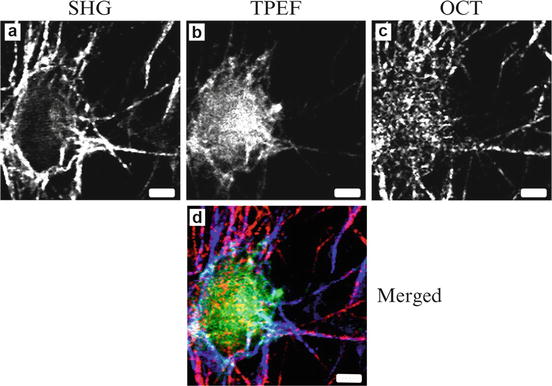
Fig. 49.6
MPM/OCM images of an organotypic RAFT tissue model. (a) SHG from collagen matrix; (b) TPEF from fibroblasts; (c) OCM from scattering interfaces; (d) Merged image with SHG, TPEF, and OCM signals in blue, green, and red. The scale bar is 5 μm (From Ref. [9])
The MPM/OCM system has been applied to study the origin of OCM contrast in cells as shown in Fig. 49.7 [10]. Single glioblastoma cells embedded in 3D matrigel are imaged, where the OCM channel shows the scattering locations and the TPEF channel shows the identification of the subcellular structures by specific fluorescence labeling. Figure 49.7a–c shows an unlabeled cell. The TPEF signal is the autofluorescence that is known to be mainly from the cytoplasm due to mitochondrial fluorescence. The weakly fluorescent nuclear region matches with the low-scattering area in the center of the cell. The bright autofluorescence region in the cytoplasm matches with the bright scattering cluster area. The bright scattering pattern in the outer ring (possibly plasma membrane region) does not have a corresponding autofluorescence signature. Cells labeled with DAPI are imaged to identify the nuclear area as shown in Fig. 49.7d–f. The area of DAPI fluorescence matches well with the dark area of low light scattering in OCM. This confirms that the low-scattering area coincides with the nuclear core area. To identify what generates the bright scattering in the cytoplasm, Fig. 49.7g–i shows a cell labeled with a mitochondrial vital dye, rhodamine 123. The bright scattering area in the cytoplasm matches well with the mitochondrial distribution. Figure 49.7j–l shows images of a cell stained with PKH67 membrane dye. Along the plasma membrane region, bright scattering signals are observed. Figure 49.7m–o shows images of a cell stained with Alexa Fluor 488 conjugated to phalloidin particularly targeting actin filaments. It is observed that the distribution of actin filaments is co-localized with the bright scattering on the cell surface within the resolution of the system. This study shows that strong scattering is mainly from mitochondria, plasma membrane, actin filaments, and the boundary between cytoplasm and nucleus, where there is low scattering from inside the nuclear core.
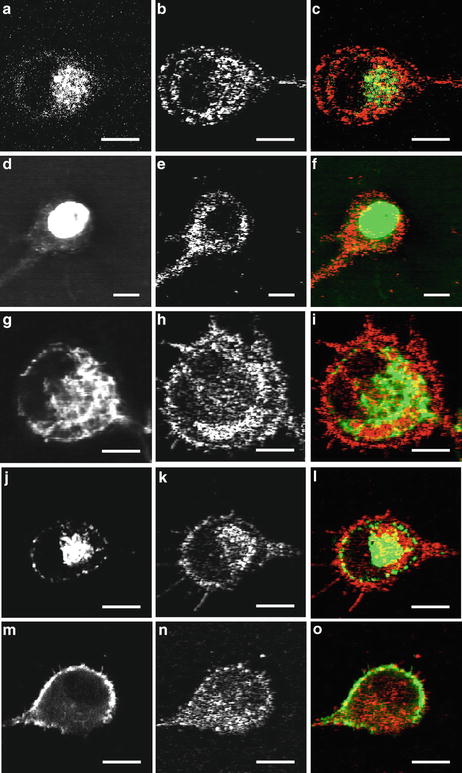
Fig. 49.7
Single-cell imaging with MPM/OCM. TPEF (left), OCM (middle), and merged (right) images of single cells. Single cell without labeling (a–c); with DAPI labeling for nuclei (d–f); with rhodamine 123 labeling for mitochondria (g–i); with PKH67 labeling for plasma membrane (j–l); and with Alexa Fluor 488 conjugated to phalloidin for actin filaments (m–o). Pseudo color: TPEF (green) and OCM (red). The scale bar is 10 μm (From Ref. [10])
The MPM/OCM system has also been applied to study the wound-healing process using engineered tissues. The organotypic RAFT model is an engineered tissue model commonly used for studying the wound-healing process. An artificial wound is created by removing part of the RAFT tissue. MPM/OCM imaging is applied to monitor the migration of fibroblasts and remodeling of the collagen matrix. Figure 49.8 shows the MPM/OCM image of the RAFT tissue. The OCM image indicates the boundary between the intact and the wounded areas of the tissue. The SHG shows the collagen matrix, and the TPEF shows a fibroblast that aligns in parallel with the boundary of the wounded area.
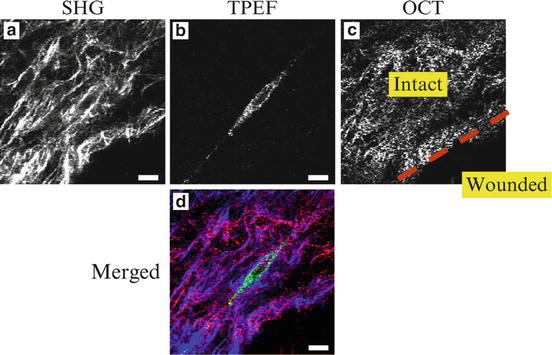
Fig. 49.8
MPM/OCM images of an organotypic RAFT tissue model for studying wound healing. (a) SHG image shows collagen matrix. (b) TPEF image shows a fibroblast. (c) OCM image shows the boundary between intact and wounded areas. (d) Merged image of the above three channels. Pseudo color: SHG (blue), TPEF (green), and OCM (red). The scale bar is 10 μm
These results demonstrate that MPM/OCM is a microscopy system that can acquire multiple contrasts simultaneously with pixel level co-registration. The multiple contrasts have different mechanisms and thus can provide complementary information about tissues.
49.2.2 Multi-scale MPM/OCT System and Applications
While the MPM/OCM takes the advantages of the complementary contrasts from MPM and OCT, the multi-scale MPM/OCT is able to take additional advantages from their complementary FOV and speed [31–33]. In multi-scale MPM/OCT, the OCT mode can image a large FOV for assessing overall tissue structures, and the MPM mode can provide a high-resolution zoom-in imaging for identifying cellular level structures. A multi-scale MPM/OCT system is reported by Jeong et al. by utilizing the effective NA of a single objective lens [31]. Different beam spot sizes were shined on the objective to achieve a high NA for MPM and low NA for OCT imaging, respectively. The system used separate laser sources and beam scanners which required critical alignment for registration. We have developed a multi-scale MPM/OCT system using a single sub-10 fs Ti:sapphire laser [32, 33]. The laser source provided a short coherence length which was comparable with the MPM axial resolution. Two objectives were used: a high NA objective for MPM and a low NA objective for OCT. Because the MPM and OCT shared the same laser source and scanners, co-registration was ensured between the MPM and OCT imaging regions. Details about this system are presented below.
49.2.2.1 System Configuration
The schematic of the multi-scale MPM/OCT system is shown in Fig. 49.9 [32]. A sub-10 fs Ti:sapphire laser (Fusion PRO 400, Femtolasers) is the source for both the MPM and OCT imaging. The laser has a center wavelength of 800 nm, a bandwidth of 120 nm, and a coherence length of 2.3 μm in air. The system is similar to the setup for the multi-contrast MPM/OCM as shown in Fig. 49.2 except that the OCT detection is changed to a spectral-domain OCT. For OCT imaging, the interference signal between the reflected sample and reference light is detected by a custom-built spectrometer. The spectrometer consists of a 1,200 lines/mm transmission grating (Wasatch Photonics), a compound focusing lens composed of two 75 mm focus achromatic doublets back to back with an effective focal length of 37.5 mm, and a 1,024 pixels linescan CCD camera (AViiVA SM2 CL, E2V). A water immersion 40× objective (LUMPlanFL N, Olympus) of 0.8 NA is used for the high-resolution MPM imaging, and a 4× objective (Plan N, Olympus) of 0.1 NA is used for the OCT imaging. The two objectives can be switched without touching the sample. The same XY galvo scanners control the transverse beam scanning for both MPM and OCT. The axial scan of MPM is achieved by a piezo objective scanner (MIPOS 500, Piezosystem Jena). The spectral-domain OCT requires no depth scanning.
Fig. 49.9
Schematics of the multi-scale MPM/OCT system. The insertion shows co-registered MPM (green) and OCT (red) images of microfluidic channels. BS beam splitter, F filter, Obj objective PMT photomultiplier tube. Scale bar is 40 μm (From Ref. [32])
The MPM lateral resolution is ∼0.6 μm, and axial resolution is ∼1.5 μm, respectively. The OCT lateral resolution is ∼5 μm, and axial resolution is ∼3.3 μm in air. The MPM acquires en face view images with an FOV up to ∼300 × 300 μm2 and speed of 0.4 fps. The OCT acquires cross-sectional view images with an FOV of up to ∼3 mm in lateral and ∼0.6 mm in depth at a speed of ∼100 fps.
49.2.2.2 Co-registration
In the multi-scale MPM/OCT, OCT images a large FOV, while MPM provides zoom-in imaging on a region of interest. Therefore, the co-registration is on the regional level where the MPM FOV is a smaller region that can be localized on the OCT image. This co-registration is achieved by sharing the same laser source and scanning components. The insertion in Fig. 49.9 shows the cross-sectional (XZ) view of two fluorescent dye-filled channels on a microfluidic chip. OCT (red) shows the substrate of the chip and the bottom of the channels, while MPM (green) shows the body of the channels. The locations of the channels are matched in the MPM and OCT images, which indicate the co-registration of the imaging regions.
49.2.2.3 Applications
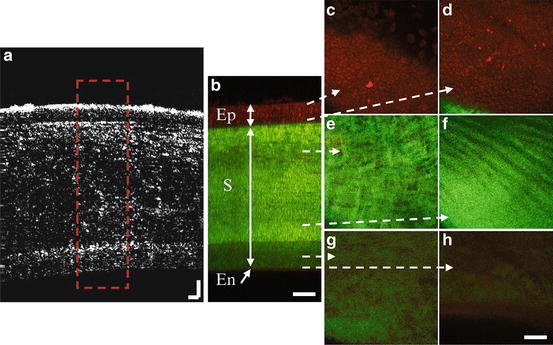
The multi-scale MPM/OCT imaging is demonstrated in Fig. 49.10 on fish cornea [32]. Figure 49.10a shows the OCT image (XZ view) of the fish cornea. The full thickness of the cornea is detected in a single scan. The image size is 800 μm in lateral and 600 μm in axial direction. In the OCT image, three layers can be detected. However, the identity of the three layers cannot be confirmed. Figure 49.10c–h shows a series of MPM images (XY view) acquired at depths from 5, 25, 80, 220, 275, to 290 μm below the surface, respectively. In Fig. 49.10c, cells are clearly visible in the TPEF channel where the contrast is autofluorescence from the cell cytoplasm, which is an indication of epithelium. Figure 49.10d shows the junction between the cellular and collagen layers. From Fig. 49.10e–g, the images show mainly SHG contrast from collagen fibers with different structures and densities, which is an indication of stroma. Figure 49.10h is near the bottom of the cornea, where we can still see a weak collagen signal in the SHG channel. Although endothelium cells are not resolved, a thin layer with weak autofluorescence is observed below the end of the collagen layer, which is an indication of endothelium. Therefore, from the TPEF and SHG imaging, the epithelium, stroma, and endothelium layers can be identified in the cornea. Figure 49.10b shows the cross-sectional view of the cornea reconstructed from a MPM stack. It clearly shows the epithelium, stroma, and endothelium layers by looking at the cellular and collagen structures. The different layers identified in the MPM image match well with the layers observed in the OCT image. With the information from the MPM imaging, the three layers observed in the OCT image can be identified to be the epithelium and the two sub-layers of stroma.