Fig. 79.1
TSCM images of subcapsular proximal convoluted tubules of a rabbit kidney: 1 h (hr) (a), 24 h (b), 48 h (c) and 72 h (d) following harvesting. With increasing storage time, TSCM images depict the degeneration of the superficial proximal tubules. Summary of the serum creatinine (SCr) (e) and blood urea nitrogen (BUN) values (f) measured at various days posttransplantation. As the storage time increased, the posttransplant SCr and BUN values increased. All the rabbits in the 24-, 48-, and 67-h groups exhibited various degrees of DGF but eventually survived. SCr and BUN returned to normal values. All rabbits in the 72-h group eventually died of uremia (Reproduced from Ref. [11] with permission © 2002 S. Karger AG, Basel)
79.3 Advantages of Optical Coherence Tomography (OCT) as a Noninvasive Imaging Procedure to Evaluate the Transplant Kidneys
OCT is a rapidly emerging imaging modality that can function as a type of “optical biopsy,” providing cross-sectional images of tissue morphology in situ and in real time [16, 17]. OCT is similar to ultrasound imaging, except that it uses the echo delay of light instead of sound to generate images. OCT is safer than X-ray technologies, is much less expensive than MRI devices, and provides higher resolution images than ultrasound. By employing broadband optical light sources, OCT can achieve axial resolutions of 1–10 μm, more than an order of magnitude above that obtainable for high-frequency ultrasound. As a result, OCT can provide very high-resolution images of organs and tissues in a noninvasive manner. This potential has been demonstrated in a number of biomedical applications including ophthalmology [18–20], cardiology [21, 22], gastroenterology [23–26], dermatology [27], dentistry [28], urology [29], and gynecology [30], among others. In contrast to other forms of noninvasive light microscopy, OCT can image with longer working distances, with improved penetration depth, and without the need for tissue contact. Not only can it image up to depths of ∼1–2 mm in most light-scattering tissues, OCT can also provide three-dimensional images in arbitrary planes. Finally, OCT can be performed using a thin flexible sterile endoscope or catheter [31, 32] or even with a needle [33], enabling ease of use and the possibility of imaging deep within a solid tissue or organ. To make OCT more applicable to the clinical situation, we developed a handheld OCT unit that has proven highly effective in our preliminary clinical trials. OCT has proven especially valuable in studying the living kidney because excisional biopsies are not only invasive, damaging, and can only sample a very small region of the kidney but also produce severe artifacts that are difficult to distinguish from ischemia and other injuries. In preliminary clinical investigations, we have provided evidence demonstrating OCT’s capability for imaging intact living human kidney microstructures both ex vivo and in vivo (i.e., following transplant into patient). Since the morphology of superficial proximal tubules correlates very well with posttransplantation renal function [11], the information obtained by OCT could be useful to evaluate the donor kidney status.
79.4 OCT Studies of the Kidney Using a Rat Model
Initially, we investigated the ability of OCT to provide clinically relevant information using a rat kidney model [5]. Figure 79.2a shows the cross-sectional OCT image of rat renal cortex ex vivo. OCT clearly visualizes the uriniferous tubule lumens that appear as low backscattering (dark regions), while the parenchyma appears as high backscattering (bright regions). Figure 79.2b shows the 3D OCT image that reveals the shape and contour of winding proximal convoluted tubules. Similar patterns are presented in the en face OCT image (planes parallel to the kidney surface) shown in Fig. 79.2c. Renal glomeruli can be visualized (Fig. 79.2d), with a narrow circular space corresponding to Bowman’s space. This study demonstrated that OCT has high resolution and sufficient penetration depth to visualize the microstructures in the outer cortex of the rat kidney.
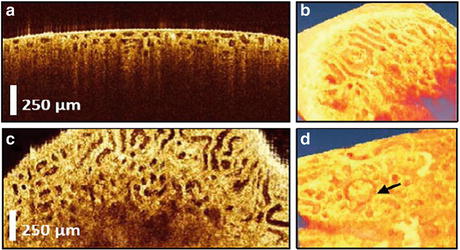
Fig. 79.2
(a) OCT imaging of rat kidney microanatomy ex vivo. (a) Cross-sectional image of renal cortex revealing the proximal tubules. (b) 3D view. (c) En face image of the proximal convoluted tubules. (d) 3D view revealing the glomerulus (arrow) (Reproduced from Ref. [5] with permission © 2007 Society of Photo-Optical Instrumentation Engineers)
We subsequently studied the capability of using OCT to monitor kidney structural changes in response to ischemic insult in the living rat (i.e., in vivo) [6]. A laparotomy was performed on the anesthetized animal and the living kidneys exposed for in situ observation. We observed the kidneys prior to, during, and following exposure to renal ischemia induced by clamping the renal artery. Again, OCT enabled visualization of the morphology of both uriniferous tubules and renal glomeruli. When renal ischemia was induced, OCT revealed dramatic shrinkage of tubular lumens due to the swelling of the proximal tubule cells (Fig. 79.3a–c). Total occlusion of the tubule lumens occurred within a minute following onset of ischemia. 3D segmentation provided an estimation of changes in the total tubular volumes in response to ischemia (Fig. 79.3d). Pretreatment with intravenous mannitol (1.0 ml of 25 % mannitol solution) protected the tubules from ischemic-induced swelling. These observations demonstrated that OCT represents an exciting new approach to visualize renal histopathological changes in vivo.
Fig. 79.3
(a) En face OCT image of a rat kidney in vivo prior to an ischemic insult. The lumens are relatively uniform. (b) OCT image of the tubules taken following 15 min of normothermic renal ischemia. After ischemia, the majority of the tubules have shrunk. (c) OCT image of the tubules taken 30 min after reperfusion; the tubular lumens have reopened. (d) Total tubule volume before, during, and following renal ischemia showing statistically significant changes (Reproduced from Ref. [6] with permission © 2008 USCAP, Inc)
79.5 Noninvasive Imaging of Renal Microcirculation Using Doppler OCT
We have demonstrated that OCT can be used in a Doppler mode (DOCT) to image microvascular blood flow in the kidney [7]. This is an additional parameter to measure following kidney transplantation, in view of studies indicating that blood perfusion may be correlated with both intermediate and long-term graft function [34, 35]. Also, intrarenal hemodynamic abnormalities are thought to be a primary factor associated with the onset and progression of acute injury [36], as well as diabetic nephropathy [37, 38], and focal segmental glomerulosclerosis (FSGS) [39]. Real-time assessment of renal morphological and hemodynamic changes could therefore help to evaluate the kidney condition and offer valuable information to predict the prognosis of injury or disease, lending to the development of patient-specific management strategies. Currently, there is no sensitive and objective tool for clinical monitoring of renal microcirculatory changes. In the past, renal blood flow (RBF) has been monitored using a number of different imaging modalities including positron emission tomography (PET) [40–45], magnetic resonance angiography (MRA) [46–49], Doppler ultrasound (US) [50–53], and contrast-enhanced ultrasound (CE) [54, 55]. While these techniques allow for noninvasive, wide field-of-view (FOV) imaging, they do not have sufficient resolution to detect changes in renal microcirculation. Optical imaging techniques that have higher resolutions and greater sensitivities could be a more feasible method for monitoring and evaluating microcirculatory changes, especially in an intraoperative setting. Studies using confocal [11, 12, 56] and multiphoton microscopy [13–15] have demonstrated the ability to image kidney microstructure and function (blood flow and filtration rate) in animal glomerular capillaries. However, again the penetration depth has been limited to several hundred microns, and they require the need to administer contrast agents to determine flow. Therefore, using these imaging modalities for human studies pose certain challenges due to the capsule surrounding the human kidney, which can be several hundred microns thick, and the need to inject contrast agents into the patient. OCT and its functional extension DOCT are emerging imaging technologies that have the capacity to provide real-time imaging of tissue in a noninvasive fashion with high resolution near that of conventional histopathology. DOCT can be used to visualize blood flow noninvasively by measuring the Doppler frequency shifts in the OCT interference signal caused by moving scatterers that are label-free, such as red blood cells [57]. DOCT has been used to image and quantify blood flow in vivo for multiple clinical applications including retina [58–61], skin [62–64], and gastrointestinal tract [65], among others.
In a recent study, we investigated the feasibility of DOCT to image kidney microcirculation, specifically, glomerular blood flow. DOCT is able to capture 3D data sets consisting of a series of cross-sectional images in real time, which enables label-free and noninvasive quantification of glomerular blood flow. The kidneys of adult, male Munich-Wistar rats were exposed through laparotomy procedure after being anesthetized. Following exposure of the rat kidney beneath the OCT/DOCT microscope, glomerular blood flow was observed as shown in Fig. 79.4. Figure 79.4a, d, g show en face OCT intensity images revealing the kidney microstructure. Uriniferous tubules are readily identified surrounding the glomerulus, which is the circular structure in the middle of the image surrounded by the crescent-shaped capsular space of Bowman. Figure 79.4b, e, h show corresponding DOCT image from the same plane depicting red blood cell (RBC) velocity in numerous glomerular capillaries. As indicated by the color map, red to yellow represents increasing velocity of blood flow in one direction, while blue to cyan represents increasing velocity of blood flow in the opposite direction. Therefore, the mixture of these colors seen in the DOCT images demonstrates the varying velocities as well as the convoluted nature of blood flow through the glomerular capillaries. Figure 79.4c, f, i are the fused OCT/DOCT images demonstrating the spatial location of the DOCT signal within the glomerulus.
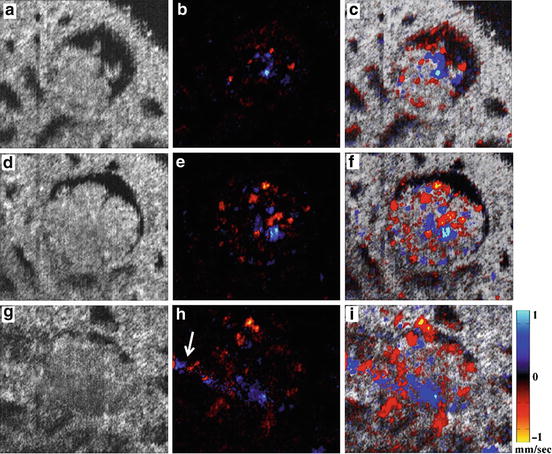
Fig. 79.4
OCT/DOCT imaging of a rat glomerulus. (a, d, g) Represent OCT en face views of single glomerulus. (b, e, h) Represent DOCT en face view of the same imaging plane. (c, f, i) Represent fused OCT/DOCT image showing spatial agreement between the OCT image and the corresponding DOCT image. The three images in each row correspond to the same imaging plane. Depth (a–c) = 440 μm; (b–f) = 470 μm; (g–i) = 545 μm. OCT/DOCT provides virtual sectioning of the glomerulus. The arrow in h represents the vascular pole (i.e., afferent/efferent arterioles). Image size: 325 × 278 μm (Reproduced from Ref. [7] with permission © 2011 USCAP, Inc)
The effects of acute mannitol and angiotensin II infusion were also observed. DOCT imaging enables real-time monitoring of blood flow changes in three separate physiological states: baseline, following injection of 0.1–0.2 ml mannitol (250 mg/ml), which increases renal blood flow [66–68], and 200 ng/kg body weight angiotensin II [69], which decreases renal blood flow [70–73]. Glomerular blood flow was quantified for the induced physiological states and compared with baseline measurements. Figure 79.5 shows representative glomeruli imaged under each condition. Baseline DOCT is depicted in Fig. 79.5b with mannitol and angiotensin II in Fig. 79.5d, f respectively. After infusion of mannitol, a significant increase in blood flow was observed, and following infusion of angiotensin II, a significant decrease in blood flow was observed. Corresponding OCT images are presented in Fig. 79.5a, c, e for identification of glomerular region in the DOCT images.
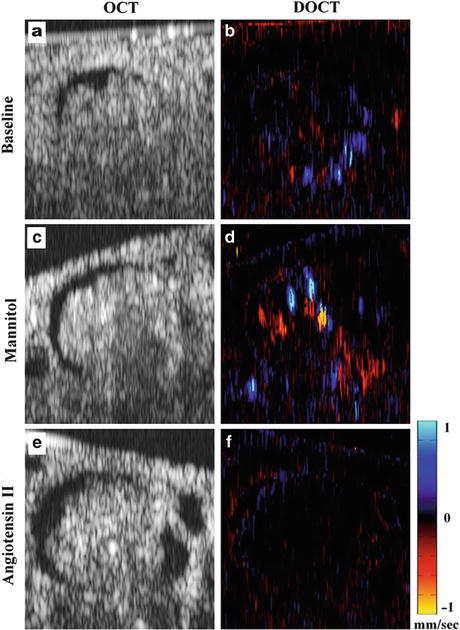
Fig. 79.5
Representative OCT and DOCT images (XZ) from three different physiological states. (a–b) Baseline, (c–d) after mannitol, and (e–f) after angiotensin II. Comparison among the images shows differences in the observed DOCT signal in different glomeruli under altered blood flow conditions. Image size: 294 × 278 μm (Reproduced from Ref. [7] with permission © 2011 USCAP, Inc)
3D DOCT data were subsequently analyzed by computing two parameters: cumulative Doppler volume (CDV) and Doppler flow range (DFR). CDV was calculated by summing together the volume of segmented voxels within the glomerular volume containing DOCT signals that were above the background threshold:  where V(x, y, z) is individual voxel volume and the threshold velocity is set to ±0.05 mm/s. Doppler flow was calculated by integrating the DOCT velocity signal over the lateral cross-sectional (en face) area of the segmented DOCT signal at each depth position. Integration over the en face plane eliminates the angle-dependent uncertainty of the Doppler velocity, therefore providing an accurate quantitation of flow as defined by [74]
  where v z (x, y, z) is the DOCT velocity over the xy segmented DOCT area. DFR was then defined as the flow rate at 99 % area under the curve (AUC) of the 3D flow histogram. Figure 79.6 shows the blood flow histograms of three glomeruli to illustrate differences in blood flow rate and blood volume between the induced physiological states. The aforementioned dynamic changes in blood flow detected under altered physiological conditions demonstrate the real-time imaging capability of DOCT to quantitatively image the kidney microvasculature for transplant graft evaluation.
where V(x, y, z) is individual voxel volume and the threshold velocity is set to ±0.05 mm/s. Doppler flow was calculated by integrating the DOCT velocity signal over the lateral cross-sectional (en face) area of the segmented DOCT signal at each depth position. Integration over the en face plane eliminates the angle-dependent uncertainty of the Doppler velocity, therefore providing an accurate quantitation of flow as defined by [74] where v z (x, y, z) is the DOCT velocity over the xy segmented DOCT area. DFR was then defined as the flow rate at 99 % area under the curve (AUC) of the 3D flow histogram. Figure 79.6 shows the blood flow histograms of three glomeruli to illustrate differences in blood flow rate and blood volume between the induced physiological states. The aforementioned dynamic changes in blood flow detected under altered physiological conditions demonstrate the real-time imaging capability of DOCT to quantitatively image the kidney microvasculature for transplant graft evaluation.Fig. 79.6
Blood flow histogram comparison. (a–b) Baseline blood flow histogram. (c–d) Blood flow histogram following injection of mannitol. (e–f) Blood flow histogram following injection of angiotensin II. Each histogram represents a compilation of the segmented DOCT signal at every en face plane through the depth of a single glomerulus. Plots on the lower row are close-up versions at the base of the histograms (below the dashed line) in the upper row (Reproduced from Ref. [7] with permission © 2011 USCAP, Inc)
Figure 79.7a, b shows the DFR and CDV values from seven different physiological states in the same rat. For each state, an average number of n ≈ 4 glomeruli were analyzed. Both DFR and CDV increase dramatically after injection of mannitol. It is interesting to note that after both the first and second mannitol injection, the DFR and CDV values returned to near-baseline levels during the “recovery” period indicating that the effects of the mannitol were wearing off (∼15–20 min elapsed since injection). Shortly after administering the third mannitol injection to increase blood flow (∼10 min), angiotensin II was injected. This injection of angiotensin II reduced both DFR and CDV dramatically, well below the baseline level. This result demonstrates that DOCT can quantitatively image renal blood flow in vivo, thereby providing valuable diagnostic information for vascular function in addition to structural information from OCT.
Fig. 79.7
In vivo quantification of DOCT imaging parameters of rat glomeruli. (a) Doppler flow range; (b) cumulative Doppler volume. Each of these parameters was measured in multiple glomeruli under seven separate conditions. Asterisk (*) indicates p < 0.05 compared to “baseline.” Labels: Mann, mannitol; Ang II, angiotensin II (Reproduced from Ref. [7] with permission © 2011 USCAP, Inc)
These preliminary results using animal models demonstrate that OCT/DOCT can provide valuable information that would be valuable for determining the status of renal transplants.
79.6 OCT Imaging of Human Kidney Microstructure
Figure 79.8 shows the schematic of the high-speed, high-resolution, Fourier-domain OCT system that was used to obtain the first 3D OCT imaging of human kidneys [75]. A wavelength-swept laser light source generating 100-nm bandwidth at 1,310-nm central wavelength was employed, yielding approximately 10-μm axial image resolution in the tissue. The laser used to acquire the preliminary data operates at a sweep rate of 16 kHz, and the real-time imaging was performed at 30 frames per second (video rate). A Michelson interferometer composed of a circulator and a fiber-optic 50/50 splitter was used to generate the OCT interference signal. The reference arm consists of a stationary mirror (M) and a polarization controller (PC). The light from the sample arm was steered by a pair of galvanometer mirrors (X and Y), then focused by an objective lens onto the sample. The power on the sample was 4 mW with a spot size of 15 μm. The system’s sensitivity was 95 dB.
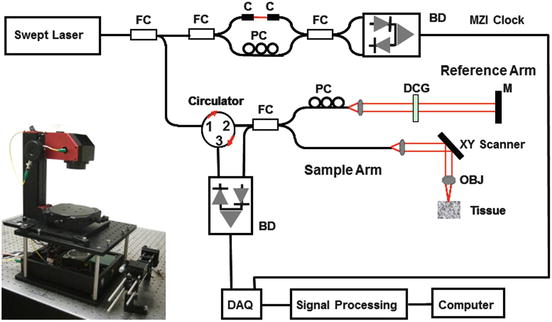
Fig. 79.8
Schematics of the Fourier-domain OCT system used in kidney imaging studies. Inset shows the photo of OCT microscope (Reproduced from Ref. [75] with permission © 2009 Optical Society of America)
3D OCT volumes (2.5 × 2.5 × 2.5 mm3, with 512 × 512 × 512 pixels) were obtained noninvasively from various locations on human kidneys obtained through the Washington Regional Transplant Consortium (WRTC) and preserved (i.e., fixed) with 2 % glutaraldehyde. Figure 79.9 shows a representative cross-sectional OCT image of the human kidney and the corresponding conventional light microscopic histology. Because under normal circumstances the kidney will be surrounded by the renal capsule (i.e., thick layer of dense connective tissue), it is important to evaluate OCT’s capability to image the tissue structures through the renal capsule. Unlike in the previously described TSCM studies (see above), the presence of the renal capsule did not prevent imaging of subcapsular kidney tubules and glomeruli. A corresponding histological image (Fig. 79.9b) shows correlation of the anatomic features observed by OCT with traditional light microscopic histological sections. Renal glomeruli could also be visualized in the upper cortex as light-dense, round-oval capillary tufts and the Bowman’s space as a light-lucent area surrounding the tufts (Fig. 79.9c) [76]. These results demonstrated OCT’s capability to reveal the histological features in the intact human kidney and underscored its promise for clinical kidney imaging in vivo.
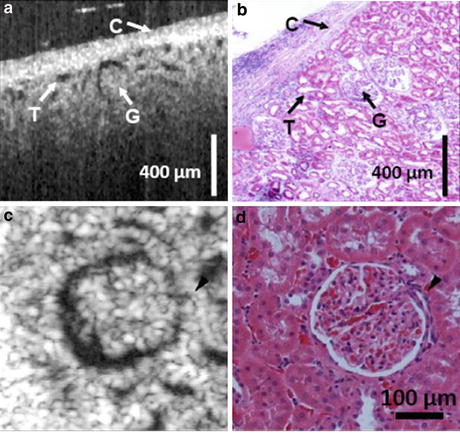
Fig. 79.9
(a) Cross-sectional OCT image of human kidney ex vivo. Uriniferous tubules (T), glomeruli (G), and the kidney capsule (C) are distinguishable. (b) Representative histology of the corresponding area in the human kidney (Reproduced from Ref. [75] with permission © 2009 Optical Society of America) (c) En face OCT image of human kidney ex vivo. Glomerulus shows light-dense capillary loops surrounded by a space corresponding to the capsular space of Bowman (d) Histology (Reproduced from Ref. [76] with permission © 2010 American Urological Association Education and Research, Inc)
79.7 Clinical Trials of Renal Transplants
In collaboration with Drs. Joseph Melancon and Mathew Cooper, Directors of Kidney and Pancreatic Transplantation at Georgetown University Medical Center (GUMC), we performed clinical imaging of human donor kidneys using OCT prior to transplant (i.e., ex vivo) and OCT/DOCT following transplant (i.e., in vivo) [77]. The study was approved by the IRB and all patients signed consent forms. The IRB approved the OCT as a “nonsignificant” risk to the patients. Figure 79.10 shows the portable OCT unit used in the clinical trial, which consists of a portable cart (holding the computer, laser, optical, and electronic components), a handheld probe containing the objective lens, and a real-time user interface for image display and quantification. A cage consisting of metallic bars attached to a metallic ring endpiece surrounds the imaging objective lens that makes up the handheld probe. The length of the bars of the cage is adjusted to a proper working distance (i.e., approximately 3 cm.), so that any object place near the ring at the end of the cage is within the correct working distance for imaging (i.e., the cage serves as a spacer for correct working distance). Two issues that were initially encountered in these studies were (1) sterility and (2) keeping the laser beam from being impeded by a buildup of moisture on the glass objective lens. Since the handheld OCT probe is connected to the imaging system by a 6-ft length of cords, the cords were covered with a sterile sleeve, similar to that used for ultrasound imaging with the sterilized handheld probe exposed at the end of the sleeve. This setup worked well for imaging the kidney ex vivo while the donor kidney is being stored in sterile bowl filled with sterile ice (i.e., an ice bath) prior to its transplantation. However, when the sterilized handheld unit is used to image the donor kidneys following their transplant into the patients, temperature differences between the transplanted kidneys warmed by reperfusion of blood and the colder objective lens within the handheld probe resulted in a rapid buildup of condensation on the objective lens surface, resulting in a diminished signal. This condensation issue was effectively addressed by covering the entire handheld probe (containing the objective lens) as well as the 6 ft of cords with the sterile camera sleeve. A 1-cm circular hole cut in the end of the sleeve permitted unimpeded passage of the laser signal. The circular hole cut in the sterile sleeve was then covered with sterile, adhesive, transparent “Tegaderm” film (3M Health Care, St. Paul MN). The ultrathin Tegaderm film did not significantly impede the OCT beam and provided a barrier to moisture as well as a sterile interface between the OCT imaging probe and the kidney being imaged. Using this setup, we imaged the harvested donor kidney with the handheld OCT imaging probe (covered by a sterile sleeve and Tegaderm) both while the kidney was being stored in the sterile ice bath prior to its transplantation and in situ, following its reimplantation into the recipient. Imaging the entire surface of the harvested donor kidney ex vivo (i.e., both sides and all poles) took less than several minutes and provided a holistic evaluation of the pretransplant organ. After transplantation and following revascularization of this same donor kidney within the transplant recipient, OCT/DOCT imaging was performed again to detect Doppler flow as well as morphological features of the transplanted kidney. Once transplanted into the patient, only the upper exposed surface of the kidney was available for imaging. Again, imaging took less than several minutes. This kind of global, noninvasive, real-time histopathological perspective is, of course, not possible when using the invasive, potentially damaging, and artifact-prone procedure of excising renal biopsies. At the Georgetown University Medical Center, kidneys from living donors are protected from ischemia by pretreating the patients with intravenous mannitol (up to 50 g intravenously), flushing the excised kidneys with Viaspan (i.e., also known as the University of Wisconsin solution, or UW solution), and then storage on ice for variable periods of time prior to their transplant. However, Georgetown University Medical Center, as part of the Washington Regional Transplant Consortium/Community, also accepts cadaver kidneys preserved using other procedures including cold storage in Euro-Collins solution and hypothermic pulsatile perfusion preservation.
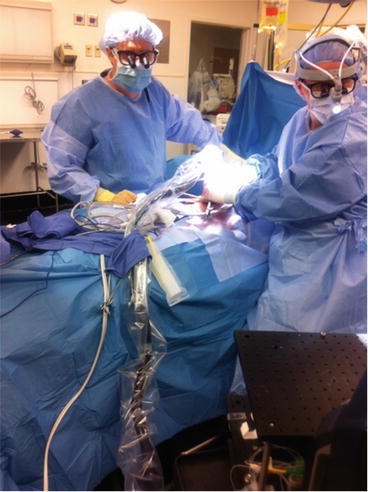
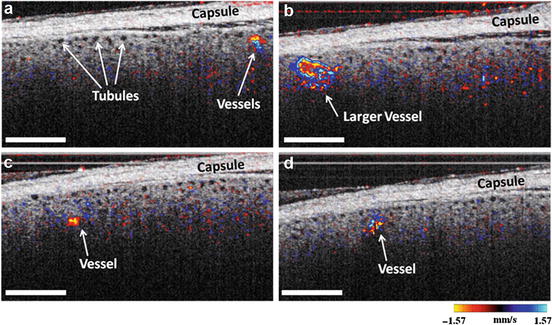
Fig. 79.10
A transplant surgeon holding the sterilized handheld imaging probe over an implanted human donor kidney
In our initial studies, we evaluated ten kidneys from living donors and one that was harvested from a heart-beating cadaver. We correlated our data with posttransplant renal function, by analyzing posttransplant serum creatinine levels. Serum creatinine levels are the most universal biological marker for estimating the glomerular filtration with a good prognostic value. In all cases but one, the transplants resulted in a rapid return to normal renal function as reflected by serum creatinine levels (i.e., serum creatinine levels below 1.5 mg/dL). In the one case, however, the serum creatinine remained elevated has not yet (i.e., 6 months later) returned to normal. This kidney had suffered additional normothermic ischemia due to revascularization problems encountered during the implantation procedure. This also was the only donor kidney that revealed no open renal tubules when examined using OCT following its implantation into the recipient. The elevated serum creatinine levels resulted in a biopsy to determine if the elevated serum creatinine levels represented rejection. Histopathological analysis verified that the elevated serum creatinine levels were a result of ischemia rather than rejection. This observation supports our premise that the openness of the uriniferous tubules is a direct reflection of posttransplant renal function. Figure 79.11 shows representative images of in vivo imaging of subsurface kidney structure and function obtained after transplantation. Renal capsule, parenchyma, and uriniferous tubules are clearly visualized. Three to five layers of tubule lumens are visible and open, denoting active renal filtration and a functioning kidney. Also, blood flow within small and large vessels was captured indicating cortical perfusion within the transplant kidney. These results demonstrate the feasibility of OCT/DOCT imaging of the transplant kidney in the OR room during transplantation procedures. Specifically, the OCT/DOCT following grafting shows both the morphological and functional response of the transplant kidney.