Fig. 56.1
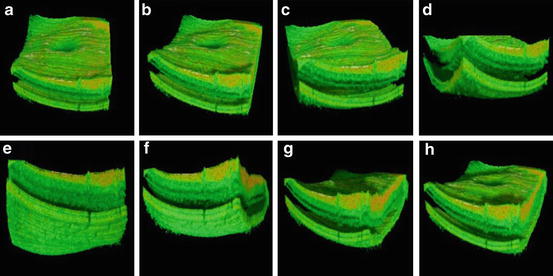
Historic development of axial resolution and data acquisition speed in retinal OCT. In vivo retinal OCT imaging with 10–15 μm axial resolution with slow speed (2 Hz and low transverse sampling) (a, b) and high speed (100 Hz and improved transverse sampling) (c); 7–9 μm axial resolution with slow speed (2 Hz and low transverse sampling) (d); first in vivo ultrahigh-resolution (2–3 μm) imaging with high speed (160 Hz) of normal subjects (e, f) and patients (g); three-dimensional (h) and high-definition (i) ultrahigh-resolution (2–3 μm) imaging with 29,000 Hz; ultrahigh-speed (300,000 Hz) and high-resolution (10 μm) 3D retinal imaging at 1,050 nm with enhanced penetration into the choroid (j)
Since its invention, the original concept of OCT has been to enable noninvasive optical biopsy, i.e., the in situ imaging of tissue microstructure with a resolution approaching that of histology, but without the need for tissue excision and post-processing. A critical step towards this goal was the introduction of ultrahigh-resolution OCT (UHR OCT). Improving axial OCT resolution by one order of magnitude from the 10–15 μm to the sub-μm region enabled a noticeably superior visualization of tissue microstructure, e.g., all major intraretinal layers as well as cellular resolution OCT imaging in nontransparent tissue (cf. Fig. 56.1e, f) [38–41]. Since then, UHR OCT technology has been investigated in clinical settings to assess its clinical utility (cf. Fig. 56.1g). Cross-sectional studies in ∼1,000 eyes with different pathologies demonstrated unprecedented visualization of all major intraretinal layers and provided important information about the photoreceptor layer [40, 42–50]. These studies demonstrated visualization of photoreceptor layer impairment in macular pathologies, such as macular holes, central serous chorioretinopathy, age-related macular degeneration, foveomacular dystrophies, Stargardt’s dystrophy, and retinitis pigmentosa. For the first time, photoreceptor layer loss could be directly correlated with retinal function (visual acuity and microperimetry findings) in patients with Stargardt’s dystrophy [43]. Studies also demonstrated the application of UHR OCT to monitor therapy as well as to contribute to a better understanding of disease pathogenesis [42, 44–46]. Advances in photonics technology, including the development of ultrabroad bandwidth and high-speed tunable light sources as well as high-speed detection techniques, have enabled a considerable improvement in the visualization capability of OCT in the last decade, thus establishing it as a state-of-the-art, noninvasive, complementary ophthalmic diagnostic methodology (cf. Fig. 56.1h–j). As a consequence, there have been numerous recent developments of OCT technology and considerable interest in this topic – especially in the field of ophthalmology. Objectively, this is evidenced by a tremendous increase in publications, patents, and companies involved in the field of OCT in recent years. It is noteworthy that about ∼50 % of all OCT publications published to date have been in ophthalmic journals, demonstrating the major impact of OCT in this field. Another 25 % have been published in optical journals, reflecting the numerous technical advances that have been accomplished.
56.1 Two-Dimensional Ultrahigh-Resolution OCT Versus Histology: Improved Interpretation of Intraretinal Layers
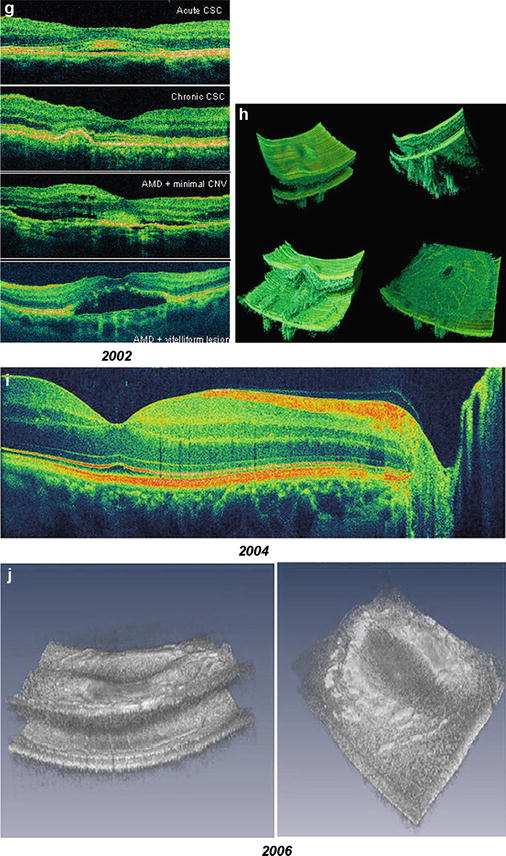
The development of UHR OCT was a key step toward achieving noninvasive optical biopsy of the human retina, i.e., the visualization of intraretinal morphology in retinal pathologies approaching the level achieved with histopathology. Figure 56.2 depicts an example demonstrating that UHR OCT of a patient with a macular hole can provide similar information as histopathology, shown in a different postmortem eye at a comparable stage of disease.
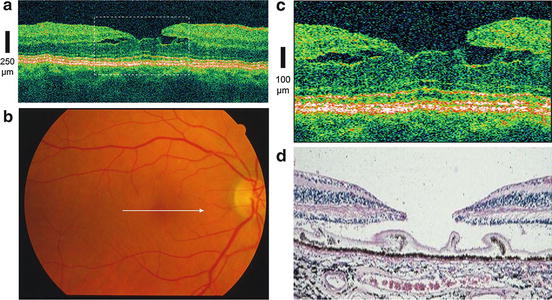
Fig. 56.2
In vivo optical biopsy using ultrahigh-resolution ophthalmic OCT (UHR OCT). UHR OCT of a patient with macular hole (a). Fundus photograph (b) indicates location of the OCT scan (white arrow in b). Twofold enlargement (c) of the central foveal region (indicated by dashed white rectangle in a) is compared with histology (d) of a different postmortem eye with comparable stage of macular hole (Histology (d) was kindly provided by R. Brancato, Italy)
In order to evaluate the potential of UHR OCT for enhanced visualization of intraretinal structures and to provide an improved basis for the correct interpretation of in vivo ophthalmic 2D UHR OCT tomograms of high clinical relevance, studies have been conducted to compare and correlate 2D UHR OCT cross-sectional images of ex vivo pig [51] and monkey (Macaca fascicularis) [52, 53] retinal specimens with histology. Figure 56.3a, b depict in vivo 2D UHR OCT of the foveal and optic disk regions in a nonhuman primate glaucoma model (cynomolgus monkey) compared with histology of the same retina at similar location. (This study was conducted in collaboration with Novartis Institutes for Biomedical Research by E. Polska and A. Doelemeyer.) Figure 56.2c, d show a comparison of in vitro ultrahigh-resolution OCT imaging (D) with histology (C) of a macular scan of a monkey retina, demonstrating excellent correlation of the OCT and tissue boundaries and the potential of 2D UHR OCT to visualize all major intraretinal layers. The results of these studies allow the extraction of clinically relevant structural retinal information with in vivo ultrahigh-resolution ophthalmic OCT tomograms and were an important step toward resolving the ambiguities that arose with 2D UHR OCT tomograms in trying to establish the correlation of OCT features with more than ten intraretinal layers.
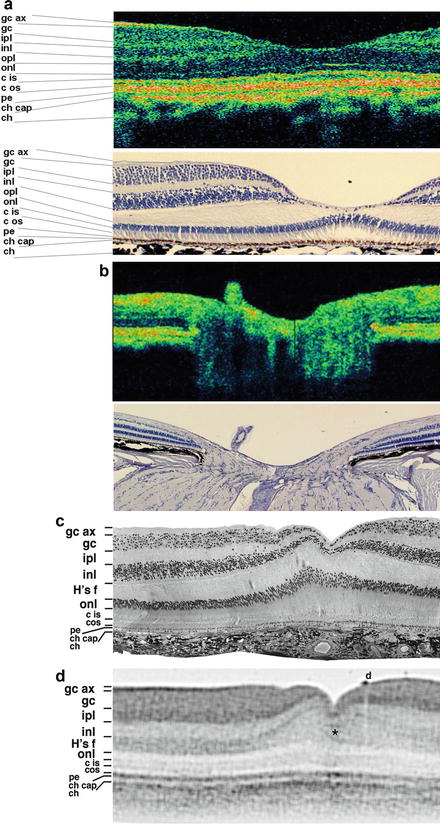
Fig. 56.3
Ultrahigh-resolution OCT versus histology. In vivo ultrahigh-resolution OCT of the fovea (a, top) and optic disk region (b, top) of a nonhuman primate glaucoma model (cynomolgus monkey); this study has been conducted in collaboration with Novartis Institutes for Biomedical Research (by E. Polska and A. Doelemeyer) compared to hematoxylin and eosin stain (H&E) histology of the same retina at similar locations (a and b, bottom). Foveal portion of corresponding semithin histological section (c) and 2D UHR OCT image (d) of a perfusion fixed monkey retina (gc ax ganglion cell axon layer, gc ganglion cells, ipl inner plexiform layer, inl inner nuclear layer, opl outer plexiform layer, Hf fibers of Henle, onl Outer nuclear layer, cis/cos cone inner/outer segments, pe Pigment epithelial layer, ch cap choriocapillaris, ch choroid, asterisk darker faults in foveal floor indicative of foveal strain, d epiretinal debris)
Despite these studies comparing histology with 2D UHR OCT, it is noteworthy that a comprehensive, reliable delineation of all intraretinal layers has not yet been accomplished. The distal part of the retina including the retinal pigment epithelium (RPE), Bruch’s membrane, choriocapillaris, and choroid complex remains a particular challenge. Currently, the “last,” i.e., most strongest continuous distal signal in UHR OCT tomograms, has been interpreted as being the retinal pigment epithelium (RPE) layer. While literature describing the light-RPE interaction in the near-infrared region around 800 nm would confirm this, the relatively thick (up to 20–30 μm) appearance in UHR OCT tomograms is not consistent with the RPE as a monocellular layer.
Figure 56.4 shows a comparison of in vitro ultrahigh-resolution OCT imaging of a pig retina 2 h postmortem acquired with 1.4 μm axial and 3 μm transverse resolutions (B) with the corresponding frozen section imaged by differential interference contrast (DIC) microscopy (G). Fig. 56.4a shows a photograph of the fundus with the major retinal vessels indicating the OCT scan location with a bar. In a series of OCT scans, the initiation of a retinal detachment event was monitored within a time frame of 30 min (cf. Fig. 56.4c–f). Ultrahigh-resolution OCT visualized a focal elevation of the neural retina concomitant with an increase in subretinal space (cf. Fig. 56.4b, c). Fifteen minutes later, alterations were observed within the monolayered band of the pigment epithelium (PE) signal (cf. Fig. 56.4d). While still continuous, the PE signal appeared triple layered at the initial locus of detachment with a stripe of bright signal framed by two darker bands. After an additional 15 min, all retinal layers were found bent inward and the measurements of their relative thickness (not shown) indicated increased thickness of the proximal retinal layers (cf. Fig. 56.4e). In the PE signal, the bright inclusion increased while the innermost aspect of the signal appeared eroded (cf. Fig. 56.4f). Histological examination of the matching retinal position demonstrated a significantly extended region of detachment (Fig. 56.4g). The pigment epithelium was found to be lesioned at the initial locus of detachment, and fragments of tissue were dislocated into the subretinal lumen (Fig. 56.4g, asterisk).
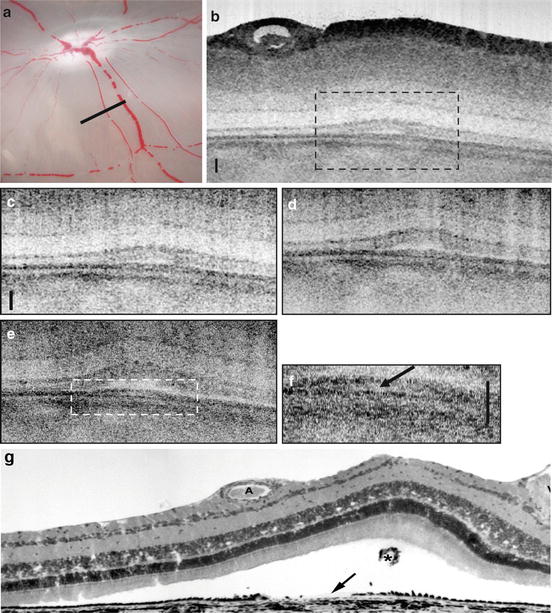
Fig. 56.4
Retinal pigment epithelium appearance in in vitro UHR OCT. Photograph of the in vitro fundus showing the papilla and major blood vessels. White bar indicates orientation of the OCT scan (a). Time lapse sequence of retinal detachment during in vitro ultrahigh-resolution OCT imaging with 1.4 μm axial ×3 μm transverse resolution. Full OCT image of an area of 0.7 × 2 mm consisting of 14,000 × 2,000 pixels (d). Enlarged image portions of the detachment zone covering an area of 0.5 × 0.5 mm consisting of 10,000 × 500 pixels, fast Fourier transform filtered for reduction of radial shadowing effects. Time intervals between these images are 15 min (c–e). In the aligned micrographs, progressive bending and swelling of tissue are evident. a All photoreceptor sublayers have begun to bend proximally resulting in a subretinal lumen. (b) The subretinal blebs have significantly increased. Underneath the detachment zone, the dark band of signal that corresponds to the pigment epithelium/Bruch’s membrane complex is still continuous (arrowheads), but locally triple layered, as indicated by a bright inclusion. (c) The innermost aspect of the triple-banded signal appears interrupted. (f) Twofold enlargement of area indicated with dashed line in (e). Corresponding histological section (g). Tissue processing has led to more extended retinal detachment. Debris from the damaged pigment epithelium (arrow) is present in the subretinal space (asterisk). All scale bars: 50 μm
In addition, the appearance of the RPE and distally adjacent layers, as visualized by in vivo UHR OCT, varies in eyes with different pathologies. Figure 56.5 depicts UHR OCT tomograms of a patient with central serous chorioretinopathy. Figure 56.5c, d show serous retinal detachments (indicated by asterisks), focal pigment epithelium detachments (cf. white arrow in Fig. 56.5d), and a “triple band appearance” (cf. Fig. 56.5c, white arrow) of the photoreceptor/RPE interface. Figure 56.5e–s show a selection of 15 B-scans from 60 that were raster scanned across a 3 × 3 × 1 mm volume. The triple band appearance might be related to the outer tips of the photoreceptors or the anchorage of the outer segments between the RPE cells. Another important issue in the interpretation of UHR OCT tomograms is the ability to visualize Bruch’s membrane. The focal feature in the pigment epithelium detachment depicted in Figs. 56.5d, f (cf. white arrows) might be interpreted as Bruch’s membrane. However, this membrane is strongly attached to the RPE, and it is likely that this membrane is also detached along with the RPE. “Visualization” of Bruch’s membrane by OCT is, therefore, problematic. Bruch’s membrane thickens with age and is, at most, 5 μm thick in patients in the 75–90-year-old range, as measured histological in postmortem tissue [54, 55]. Since the in vivo UHR OCT axial resolution is at best 2–3 μm at 800 nm, it is not clear that UHR OCT is capable of resolving and visualizing Bruch’s membrane. Figure 56.6 depicts representative UHR OCT tomograms of a patient with age-related macular degeneration (A, B) and pigment epithelium detachment (D) with corresponding fluorescent angiography (C) and a fundus photograph indicating the location of the OCT scans (C and E, white arrows). UHR OCT images (A, B, D) more clearly show a thin backscattering layer (yellow arrows) below the RPE layer that is suggestive of Bruch’s membrane.
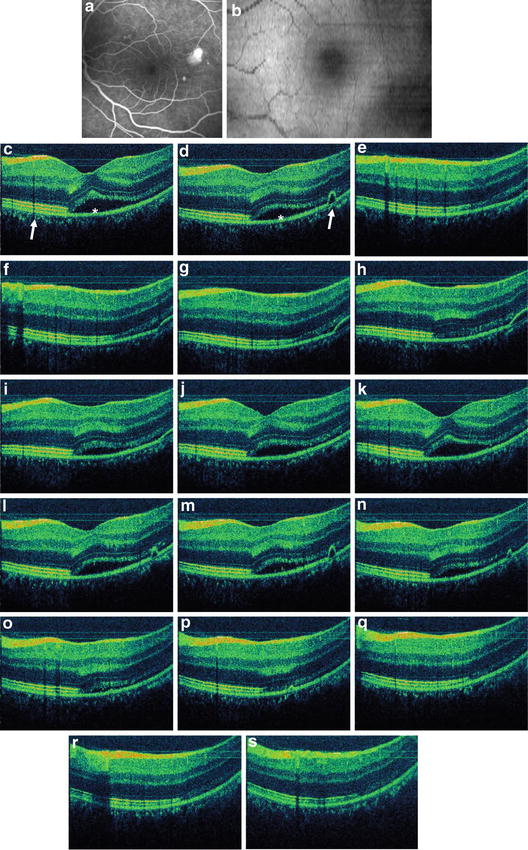
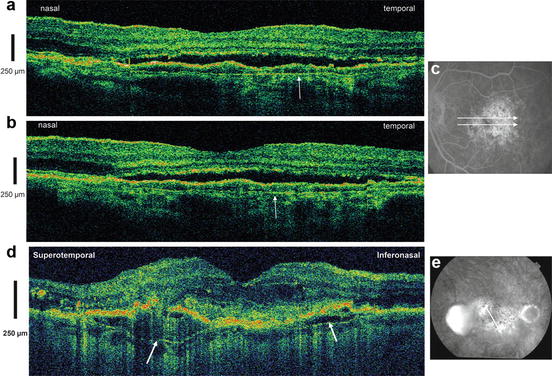
Fig. 56.5
Retinal pigment epithelium appearance in in vivo UHR OCT. Representative UHR OCT tomograms of a patient with central serous chorioretinopathy. Fluorescence angiogram (a) and OCT fundus view (b) generated from the UHR OCT A-scans are depicted. UHR OCT visualizes serous retinal detachment (cf. asterisk c, d), focal pigment epithelium detachments (cf. white arrow d), and “triple band appearance” (cf. white arrow c) of the photoreceptor/ RPE/choriocapillaris/choroid interface. Selection of 15 B-scans from 60 that were raster scanned across a 3 × 3 × 1 mm volume (e–s)
Fig. 56.6
Bruch’s membrane appearance in in vivo UHR OCT. Representative UHR OCT tomograms of a patient with age-related macular degeneration (a, b) and pigment epithelium detachment (d) with corresponding fluorescent angiography (c) and fundus photo indicating the location of the OCT scans (c and e, white arrows). UHR OCT images (a, b, d) more clearly show a thin backscattering layer (yellow arrows) below the RPE layer that is suggestive of Bruch’s membrane
Although state-of-the-art ophthalmic OCT technology enables significantly improved visualization of intraretinal layers, caution is therefore imperative regarding proper interpretation of OCT tomograms, especially of the distal part of the retina, and more comprehensive studies are needed to clarify this issue. Figure 56.7 depicts a state-of-the-art OCT interpretation of intraretinal layers in a high-definition UHR OCT of the optic disk (A) and foveal (B) region of a normal subject. Labeling of intraretinal layers that could be confirmed by clinical investigations using UHR OCT and systematic studies comparing histology with UHR OCT in in vitro animal models are labeled white or black. From the proximal to the distal part of the retina, the nerve fiber layer (cf. Fig. 56.7a, NFL) as well as plexiform layers (cf. Fig. 56.7a, inner (IPL) and outer plexiform (OPL) layer) appear back-reflecting and therefore as a strong signal in the OCT tomogram. The ganglion cell layer (cf. Fig. 56.7a, GCL) and nuclear layer (cf. Fig. 56.7a, inner (INL) and outer nuclear ONL) layer appear less back-reflecting and therefore as a low signal in the OCT tomogram. The external limiting membrane (cf. Fig. 56.7b, ELM), the inner and outer photoreceptor segment (cf. Fig. 56.7b, IS PR, OS PR), as well as the choroid (cf. Fig. 56.7b) are also properly confirmed by literature. Red-labeled layers indicate that caution is imperative and the correct interpretation needs more conclusive studies to confirm correctness. This applies to the internal limiting membrane (cf. Fig. 56.7a, ILM) and the distal part of the retina involving probably the distal tips of the photoreceptors – sometimes also referred to Verhoeff’s membrane (cf. Fig. 56.7b), the retinal pigment epithelium including Bruch’s membrane (cf. Fig. 56.7b, RPE/BM), as well as choriocapillaris (cf. Fig. 56.7b).
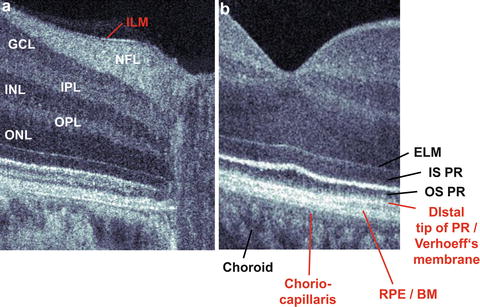
Fig. 56.7
Current state-of-the-art interpretation of intraretinal layers in OCT. High-definition UHR OCT of the optic disk (a) and foveal (b) region of a normal subject. Labeling of intraretinal layers that were confirmed by numerous previous studies is labeled white or black. Red-labeled layers indicate that interpretation needs additional studies to confirm. Nerve fiber layer (NFL), inner (IPL) and outer plexiform (OPL) layer, ganglion cell layer (GCL), inner (INL) and outer nuclear (ONL) layer, external limiting membrane (ELM), inner (IS PR) and outer photoreceptor segment (OS PR), choroid, internal limiting membrane (ILM), distal tips of the photoreceptors sometimes also referred to as Verhoeff’s membrane, retinal pigment epithelium including Bruch’s membrane (RPE/BM) and choriocapillaris
56.2 Two-Dimensional, Clinical Ultrahigh-Resolution OCT
In several clinical feasibility studies [40, 42–50], 2D UHR OCT imaging has been performed using a laboratory prototype as well as a commercially available femtosecond titanium-sapphire laser light sources (INTEGRAL, Femtolasers Produktions GmbH, Austria) that generate bandwidths of 100–175 nm at 800 nm center wavelength [56]. These light sources can support 2–3 μm axial resolution in the retina. OCT imaging was performed with axial scan rates of up to 250 Hz using up to 800 μW incident power in the scanning OCT beam, which is well below the ANSI exposure limit. More than 1,000 eyes with a range of macular diseases, such as macular holes, macular edema, age-related macular degeneration, central serous chorioretinopathy, epiretinal membranes, and detachment of pigment epithelium and sensory retina, were studied. In addition, patients with glaucoma and different hereditary retinal diseases were also imaged. The purpose of these studies was to investigate the clinical feasibility of 2D UHR OCT to visualize and quantify intraretinal morphology changes, especially in the inner (IS PR) and outer segment (OS PR) of the photoreceptor layer in healthy subjects and patients with different macular pathologies.
Figure 56.8 shows a selection of 2D UHR OCT images of the central foveal region in a normal subject and in 11 patients with different retinal pathologies. A significantly better visualization of the extent of photoreceptor impairment in different retinal pathologies was possible, including the ability to distinguish between the inner and outer photoreceptor layers and correlate photoreceptor impairment with visual acuity (shown in Fig. 56.8). These studies demonstrated the potential of 2D UHR OCT to enhance early diagnosis by detecting subtle, early morphological intraretinal changes in a wide range of retinal diseases. Comparative studies using UHR and standard-resolution OCT imaging of different retinal pathologies showed that 2D UHR OCT could be used to guide the interpretation of images from commercial, standard-resolution OCT systems (cf. Figs. 56.9, 56.10, and 56.11). Studies have also demonstrated the application of UHR OCT to monitor therapy as well as to contribute to a better understanding of disease pathogenesis [42, 44–46].
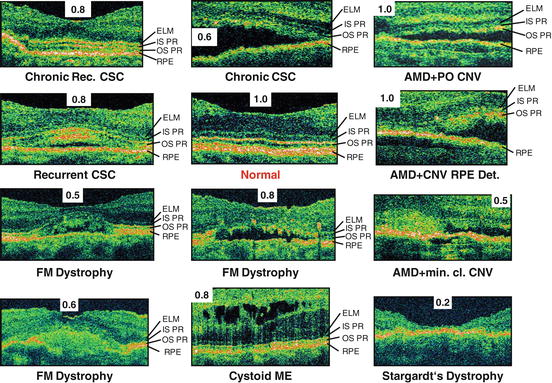
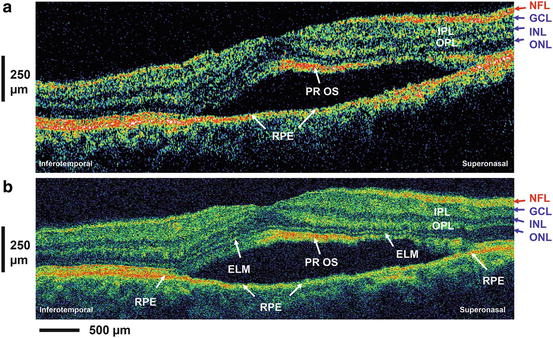
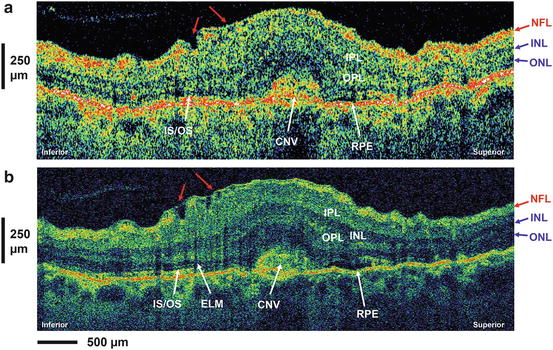
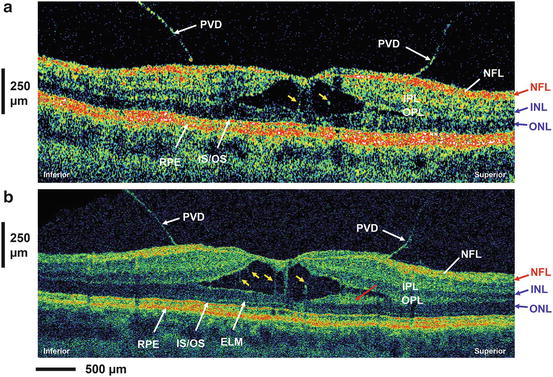
Fig. 56.8
Improved visualization of photoreceptor layer impairment in retinal pathologies using UHR OCT. UHR OCT of the central foveal region focusing on the external limiting membrane (ELM), inner (IS PR) and outer (OS PR) segment of the photoreceptor layer, and retinal pigment epithelium (RPE) region in a normal subject (labeled red) and 11 patients with different retinal pathologies. Visual acuity for each case is also indicated. CSC central serous chorioretinopathy, FM foveomacular, ME macular edema, AMD age-related macular degeneration, CNV choroidal neovascularisation, min. cl. minimal classic
Fig. 56.9
Improved interpretation of commercial OCT using UHR OCT. Standard-resolution OCT (a) and ultrahigh-resolution OCT (b) image of a patient with central serous chorioretinopathy. Nerve fiber layer (NFL), inner (IPL) and outer plexiform (OPL) layer, ganglion cell layer (GCL), inner (INL) and outer nuclear (ONL) layer, external limiting membrane (ELM), outer photoreceptor segment (PR OS), retinal pigment epithelium (RPE)
Fig. 56.10
Improved interpretation of standard-resolution commercial OCT using UHR OCT. Standard-resolution OCT (a) and ultrahigh-resolution OCT (b) image of a patient with choroidal neovascularization (CNV). Small irregularities in the NFL and ganglion cell layer with evidence of epiretinal membrane formation can be observed in both images (red arrows). Nerve fiber layer (NFL), inner (IPL) and outer plexiform (OPL) layer, inner (INL) and outer nuclear (ONL) layer, external limiting membrane (ELM), junction inner and outer photoreceptor segment (IS–OS), retinal pigment epithelium (RPE), choroidal neovascularization (CNV)
Fig. 56.11
Improved interpretation of standard-resolution commercial OCT using UHR OCT. Standard-resolution OCT (a) and ultrahigh-resolution OCT (b) image of a patient with vitreomacular traction. Posterior vitreous detachment (PVD) can be clearly visualized in both images. Distended structures (yellow arrows) spanning the separation in the sensory retina are suggestive of Müller cells. A highly backscattering layer (red arrow) adjacent to the ONL might be a portion of the OPL. Nerve fiber layer (NFL), inner (IPL) and outer plexiform (OPL) layer, ganglion cell layer (GCL), inner (INL) and outer (ONL) nuclear layer, external limiting membrane (ELM), junction inner and outer photoreceptor segment (IS–OS), retinal pigment epithelium (RPE)
56.3 High-Speed, Ultrahigh-Resolution OCT: Three-Dimensional and High-Definition OCT
UHR OCT imaging was initially based on time domain OCT and, therefore, had a fundamental time-bandwidth trade-off. As a result, operation with ultrahigh resolution required reduced imaging speeds in order to maintain sufficient detection sensitivity. Signal levels could not be increased by increasing light exposure because of the low power levels allowed for in vivo retinal imaging (∼600–800 μW at 800 nm). As a consequence of the slow scanning/measurement time, motion artifacts had to be corrected using post-processing algorithms, and only a limited number of A-scans per B-scan image can be obtained. State-of-the-art, time domain-based OCT systems have been developed to provide high scanning speeds of up to 8 kHz, i.e., 8,000 A -scans per second [57]; however the lower system sensitivity at the faster scanning speeds has prevented their use for retinal imaging. En face OCT [58–64] achieves very high imaging speeds by acquiring an en face retinal image at a specified depth. These en face imaging techniques are described in detail in other chapters.
A powerful alternative to time domain OCT for high-speed imaging is Fourier domain detection techniques where the entire depth-resolved tissue reflectance (A-scan) is obtained simultaneously, thereby removing the need for depth scanning [65–68]. This technique has been referred to in the literature as Fourier domain OCT (FD OCT), spectral domain OCT (SD OCT), swept source OCT (SS OCT), or optical frequency domain imaging (OFDI). This improvement is accomplished either by dispersing the interferometric information in space using a spectrometer setup (“spectral/Fourier domain OCT”) or by encoding information in time by tuning a monochromatic light source in combination with a single photodetector (“swept source/Fourier domain OCT” or “optical frequency domain imaging”).
The acquisition speed for both approaches – using a spectrometer as a detector or a tunable light source – is mainly limited by the readout rate of the camera which detects the spectrum or by the tuning speed of the light source, respectively. Since the scanning range and electronic detection bandwidth are decoupled, both approaches offer substantial improvements in sensitivity and a dramatic increase in the line rate (A-scan rate) without reducing the sensitivity performance compared with time domain OCT. Although the basic principle of spectral/Fourier domain OCT has been known since 1995 [65], lack of CCD technology and recognition of the sensitivity advantage delayed the experimental and clinical evaluation of this technique for almost a decade. Three groups working independently demonstrated the powerful advantage of this technique for improving data acquisition speed and sensitivity [69–71]. Spectral/Fourier domain OCT using a spectrometer for detection has been shown to enable high-speed [72–74], ultrahigh-resolution [75–77], as well as functional imaging [78, 79].
Despite the sensitivity and speed advantages, OCT using spectral/Fourier domain detection has limitations which are important to note. There is a significant loss of sensitivity and dynamic range as a function of depth, as shown in the tomograms of Fig. 56.12a–c. This effect occurs because of limitations in the spectrometer resolution and CCD pixel crosstalk as well as imperfect rescaling and post-processing of the interference signal. By employing new system calibration and signal post-processing techniques using a filter bank approach, this problem can be significantly reduced (cf. Fig. 56.12d–f). Finally, spectral/Fourier detection cannot distinguish echoes from positive and negative delays. This results in artifacts, such as those shown in Fig. 56.12g–k. Overlapping “mirror” images are produced if the tissue moves out of the measurement range. This problem can be solved by using more complex detection methods, which sacrifice scanning speed and/or sensitivity, but effectively double the depth measurement range [80–83].
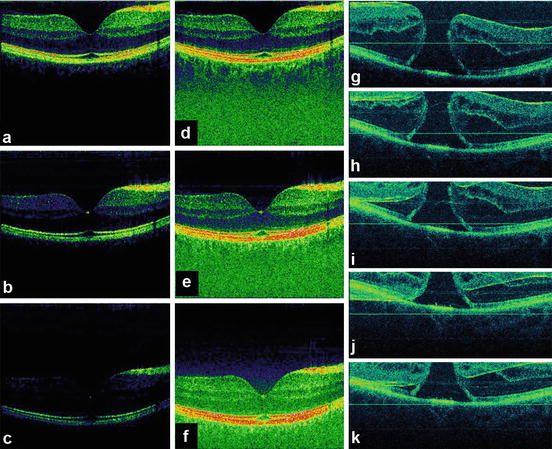
Fig. 56.12
Fundamental problems of three-dimensional UHR OCT (3D-OCT) based on spectral/Fourier domain detection. Depth-dependent sensitivity and dynamic range loss (a–c). System calibration and signal post-processing compensation for (d–f); artifacts caused by motion of the tissue/subject out of the measurement range (g–k). Fourier domain detection cannot distinguish between positive and negative echo delays, and as a consequence, “mirror” artifacts (h–k) are generated
The ability to achieve significantly higher scanning speeds while maintaining sensitivity is especially advantageous for ophthalmic OCT imaging, due to significant eye motions and the limited amount of power which is applicable according to laser safety standards. Figure 56.13 depicts a normal human optic disk measured by a third-generation, standard-resolution commercial OCT system (StratusOCT, ∼10 μm axial resolution, 400 A-scans/s; cf. Fig. 56.13a), a UHR OCT laboratory prototype using time domain detection (∼3 μm axial resolution, ∼150 A-scans/s; cf. Fig. 56.13b), and a high-speed UHR OCT laboratory prototype using spectral/Fourier domain detection (∼3 μm axial resolution, ∼25,000 A-scans/s; cf. Fig. 56.13c) [84]. Spectral/Fourier domain detection enables acquisition speeds equivalent to 25 million voxels (three-dimensional volume elements)/s, which is >50 times faster than standard-resolution OCT and >100 times faster than UHR OCT with time domain detection. The significantly higher acquisition speed not only reduces eye motion artifacts in B-scans (thereby preserving the “natural” contour of the posterior segment), but it also enables better delineation of the intraretinal layers because of the higher axial resolution, smaller speckle size, and increase in the number of transverse pixels (A-scans). Higher transverse sampling means that high-definition OCT images can be acquired. High-definition images have more transverse pixels (A-scans) across the same transverse B-scan range. This should not be confused with increased transverse resolution of the OCT image itself. Figures 56.14 and 56.15 depict examples of patients with macular holes comparing high-definition OCT images (cf. Figs. 56.14c and 56.15c) with a 10 mm length in the central foveal, sampled with 10,000 A-scans in 0.6 s [84] with a third-generation, standard-resolution commercial OCT system (StratusOCT, cf. Figs. 56.14b and 56.15b) sampled with 512 A-scans in 1.2 s. In Fig. 56.14c, cystic structures associated with the macular hole can be clearly visualized in the inner and outer nuclear layers. The intraretinal layers appear to be normal and external to the hole. By following the IS–OS junction from the parafoveal region to the macular hole, the image shows that the photoreceptor outer segment has lifted away from the normal anatomical position against the RPE, but stays intact and connected to the rest of the retina. Figure 56.15c depicts an example of epiretinal membrane pseudo-hole. Although this appears to be a cyst from the central scan, 3D UHR OCT data confirms that it is a pseudo-hole. The posterior hyaloid is visible and partially detached from the macula. The epiretinal membrane can be seen as well. In general, these membranes can be tracked and visualized in 3D UHR OCT data. Despite big changes of the inner layers, the photoreceptors have not changed much; hence the visual acuity is 20/25. Figure 56.16 shows a high-definition UHR OCT of a patient with macula hole, pre- (cf. Fig. 56.16a) and postoperatively (cf. Fig. 56.16b). Detailed intraretinal morphology can be visualized, especially in the photoreceptor area.
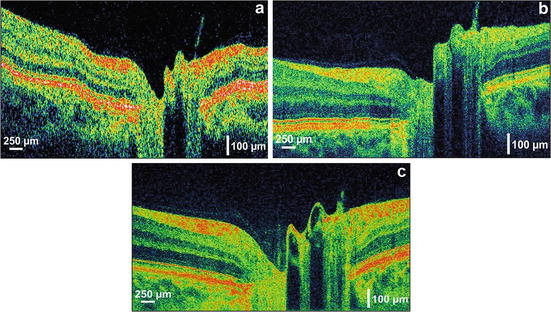
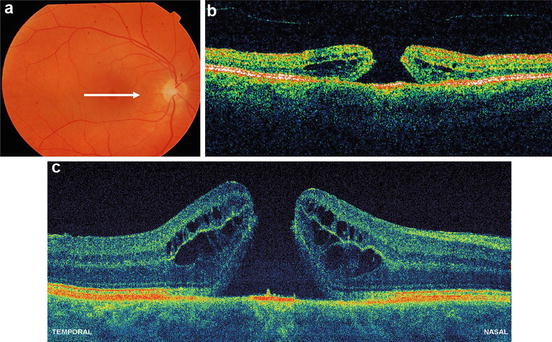
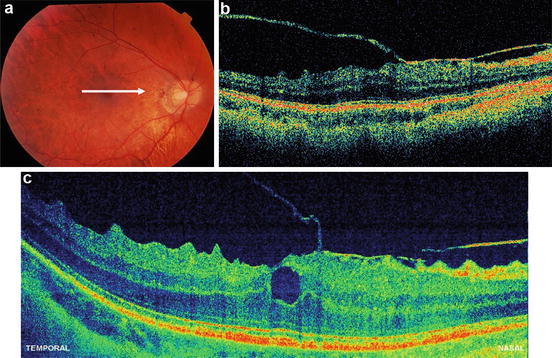
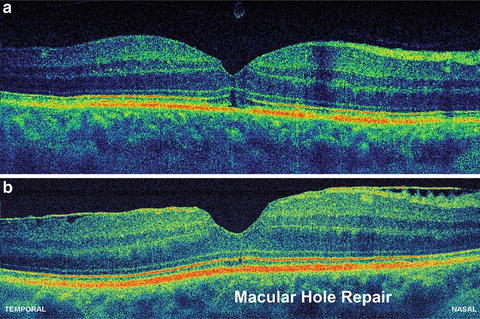
Fig. 56.13
Comparison of ophthalmic OCT technologies. The same human normal optic disk is measured by a third-generation standard-resolution commercial OCT system (a) (StratusOCT, ∼10 μm axial resolution, 512 A-scans acquired in 1.3 s), UHR OCT performed with a time domain-based laboratory prototype (b) ∼(3 μm axial resolution, 600 A-scans acquired in 4 s), and UHR OCT performed with spectral/Fourier domain detection (c) (∼3 μm axial resolution, 2,048 A-scans acquired in 0.08 s). High speed enables motion artifact-free B-scans and significantly better delineation of the stratified appearance of the intraretinal layers
Fig. 56.14
High-definition UHR OCT using high-speed UHR OCT. Fundus photo indicating the location of the OCT scans (a). The same patient with macular hole is measured by a standard-resolution commercial OCT system (b) (StratusOCT, ∼10 μm axial resolution, 512 A-scans acquired in 1.3 s) and high-definition UHR OCT performed with spectral/Fourier domain detection (c) (∼3 μm axial resolution, 10,000 A-scans acquired in 0.6 s). Significantly improved visualization of intraretinal layers is accomplished due to increased axial OCT resolution and higher transverse sampling density, due to significantly improved data acquisition speed
Fig. 56.15
High-definition UHR OCT using high-speed UHR OCT. Fundus photo indicating the location of the OCT scans (a). The same patient with a macular pseudo-hole is measured by a standard-resolution commercial OCT system (b) (StratusOCT, ∼10 μm axial resolution, 512 A-scans acquired in 1.3 s) and high-definition UHR OCT performed with spectral/Fourier domain detection (c) (∼3 μm axial resolution, 10.000 A-scans acquired in 0.6 s). Significantly improved visualization of intraretinal layers and the epiretinal membrane is accomplished by high-definition UHR OCT
Fig. 56.16
High-definition UHR OCT using high-speed UHR OCT. High-definition UHR OCT performed with spectral/Fourier domain detection (c) (∼3 μm axial resolution, 10.000 A-scans acquired in 0.6 s) in a patient with macular hole, pre- (a) and postoperatively (b). Detailed intraretinal morphology can be visualized, especially in the photoreceptor area
Perhaps, the most striking advance associated with the high acquisition speed of OCT with Fourier domain detection is that it enables in vivo three-dimensional, ultrahigh-resolution OCT (3D-OCT). Fourier domain detection techniques enable 50–100 UHR OCT B-scans to be acquired during the time needed to acquire a single UHR OCT B-scan using time domain detection. Hence, a dense raster scan, consisting of multiple, closely spaced planes (B-scans), can be performed to cover a volume of the retina (cf. Fig. 56.17a, b). In analogy to scanning laser ophthalmoscopy measurements, 3D-OCT raster scans a retinal area, but it acquires full morphological information as a function of depth in the region of interest, without the need to scan the depth of focal plane. This measures a three-dimensional volumetric data set similar to that acquired with computed tomography (CT) or magnetic resonance (MR) imaging, but with microscopic resolution. It is possible to generate “fly-throughs” of the B-scans, i.e., a movie (time sequence) of adjacent B-scans using post-processing (cf. Fig. 56.17b). The 3D-OCT data set can also be used to generate tomograms with arbitrary position and orientation, according to the necessary diagnostic needs, such as in ultrahigh-resolution scanning laser ophthalmoscopy (SLO) in en face (C-mode) tomograms (cf. Fig. 56.16c). Another clinically important feature of 3D-OCT is that a virtual fundus image, i.e., an OCT fundus image similar to one obtained by standard fundus photography, can be directly generated from 3D-OCT data (cf. Fig. 56.17d). This OCT fundus image is generated by summing the 3D-OCT data set along the axial direction, thus resulting in a pixel brightness value for each axial scan position. The OCT fundus image can be used to precisely and reproducibly register individual OCT tomograms with respect to fundus features.
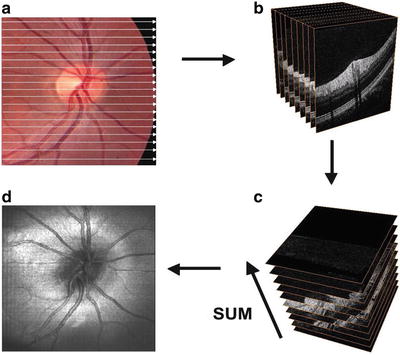
Fig. 56.17
Scanning and post-processing protocols in three-dimensional ultrahigh-resolution OCT. Several planes (B-scans) can be scanned of a whole retinal volume (a), resulting in a stack of adjacent B-scans (b). The 3D-OCT data set can be summed in the axial direction (c) to generate an en face image similar to scanning laser ophthalmoscope in en face (C-mode) tomograms (d). UHR OCT tomograms can be precisely and reproducibly registered to fundus features. The acquired data of the investigated volume can arbitrarily be cut according to the necessary diagnostic needs, e.g., an ultrahigh-resolution scanning laser ophthalmoscope in en face (C-mode) tomograms (c). OCT fundus image (d), i.e., an OCT view of the fundus similar to one obtained by standard fundus photography, which can be reproduced directly from 3D OCT data. This OCT fundus image is generated by summing the A-scan signal along the axial direction, thereby resulting in a brightness pixel value for each axial scan that can be used to register UHR OCT tomograms directly
56.4 Three-Dimensional, Clinical Ultrahigh-Resolution OCT
The first clinical investigations of ultrahigh-resolution 3D-OCT using spectral/Fourier domain detection for imaging retinal pathologies were conducted in several pilot studies [85, 86]. Figure 56.18 shows ultrahigh-resolution 3D-OCT in the foveal region of a normal subject. (Note that the axial dimension is enlarged by a factor of two when compared with the transverse dimensions in order to enable better visualization of the retina.) Figure 56.18a–h show three-dimensional (3D) renderings (software developed in collaboration with C. Glittenberg and S. Binder, Vienna, Austria) of the macular region from different virtual perspectives (cf. Fig. 56.18a–h) depicting the topography of the foveal depression. Three-dimensional rendering enables unprecedented flexibility in viewing, thereby allowing visualization of the retina from any direction, including from the posterior surface (cf. Fig. 56.18e). Figure 56.19 depicts high-definition (A, B) and three-dimensional rendering (C) of a patient with wet, age-related macular degeneration, which is indicated by RPE elevation and a choroidal neovascular membrane (CNV) underneath the RPE. There is fluid between the RPE and elevated photoreceptors. Note the jagged appearance of the photoreceptors where they are elevated. This may be due to photoreceptor disruption or lack of phagocytosis by the RPE, which can cause an elongation of the outer segments. The fluid in the retina looks more highly scattering than the vitreous. In addition, the fluid is more turbid than optically clear serous fluid. This may be due to proteinaceous material or deposits in this region. Figure 56.20 demonstrates 3D UHR OCT in the foveal region of a patient with RPE atrophy. (Note that the axial dimension is enlarged twofold, as compared to the other two dimensions, for better visualization.) The three-dimensional representation of the macular region is presented at different angled views (cf. Fig. 56.20a), thus depicting the pathologically change in the topography of the foveal depression and enabling unprecedented views in which the retina can be observed from any direction, including from below (cf. Fig. 56.20b). Figure 56.19e–h present virtual biopsy/“surgery” using 3D UHR OCT in combination with 3D data rendering, which allows the user to excise and remove any given layer or part of the retinal volume in order to visualize intraretinal morphology. An important advantage of this method is that it is reversible, since the virtual retina can be reconstructed. Scanning a retinal volume with nearly isotropic (reasonably small equidistant) sampling intervals also avoids the need to decide on the orientation of any line scans that would be required with the time domain OCT. Figure 56.21 shows 3D UHR OCT of both eyes of a patient with a macular hole. The patient’s right eye (cf. Fig. 56.21a) shows clear tomographic (cf. Fig. 56.21b) and topographic (cf. Fig. 56.21c) impairments due to the macular hole. The left eye (Fig. 56.21d) was diagnosed as normal with standard diagnostic techniques. By scanning the entire central foveal volume, 3D UHR OCT reduces the risk that retinal features indicating subtle tomographic (cf. Fig. 56.21e) and topographic (cf. Fig. 56.21f) photoreceptor impairment will be missed. Figure 56.22 depicts “virtual biopsy” or “virtual surgery” using ultrahigh-resolution 3D-OCT with 3D data rendering of a patient with macular hole. This virtual biopsy feature allows the investigator to virtually excise and remove any given layer or part of the retinal volume (cf. Fig. 56.22b–j) in order to visualize intraretinal morphology, with the advantage that it is a reversible (cf. Fig. 56.22k–o) procedure.