5
Reliability in the Interpretation of Laryngeal Imaging
There are times when an experienced physician sees a visible lesion clearly and times when he does not. This is the baffling problem, apparently partly visual and partly psychologic. They constitute the still unexplained human equation in diagnostic procedures.
It came as a surprise to our group at the Cleveland Clinic that experts reading the same medical images frequently interpret them very differently. But in fact, early evidence for such varying interpretations goes back to 1947. At that time, Birkelo and colleagues reported that a study of the relative effectiveness of four methods of chest imaging for tuberculosis was inconclusive because the variation of opinion among observers was greater than the variety of techniques.1 Until then, medical professionals had “naively assumed that what they perceive in images is a faithful representation of the images’ information content, and have not been concerned with perception unless it fails,” writes Harold Kundel.2
Our own work on this issue grew out of research conducted by an interdepartmental group at the Cleveland Clinic. This group was created through the frequent sharing of patients with throat-related gastroesophageal reflux disease (GERD) symptoms among the ear, nose, and throat, gastrointestinal, and surgery departments. Since the late 1980s, there has been increasing evidence that GERD causes laryngeal signs and symptoms secondary to tissue irritation. The goal of this group was to investigate the cause-and-effect relationship between GERD, laryngeal symptoms, and pathology, given that there was a lack of data and consensus on this topic among specialties. In several of the publications that came out of this group, we noted that one weakness was related to interobserver (agreement between raters) and intraobserver (how stable are the responses of the same observer at different time points) reliability.
For example, one of the studies investigated the prevalence of hypopharyngeal findings associated with GERD in normal volunteers.3 A group of expert judges evaluated videolaryngoscopic examinations of 110 volunteer subjects and rated 10 hypopharyngeal structures based on signs of tissue irritation. Findings of edema, erythema, redundant tissue, surface irregularities, and other lesions under each structure were rated on a severity scale. We analyzed the interobserver and intraobserver variability data using a well-known statistical method, the Cohen’s kappa coefficient, which establishes the strength of agreement between two independent evaluations. The significance of agreement is graded as a function of the calculated value. To appreciate the interpretations of kappa statistics more fully, the following value strength-of-agreement interpretations are provided: 0.00 to 0.20, slight; 0.21 to 0.40, fair; 0.41 to 0.60, moderate; 0.61 to 0.80, substantial; and 0.81 to 1.00, almost perfect. In this study, the agreement within and between raters was generally moderate at best, with several of the parameters rated resulting in poor agreement (e.g., erythema of the medial wall of the arytenoids, posterior cricoid-wall abnormalities, and presence of an interarytenoid bar).
A follow-up study involving the same sites of laryngeal irritation yielded similarly poor levels of agreement among our expert judges.4 Thinking that we might have made errors of data entry, we evaluated the entire data set a second time. The results were the same. We did not seem to agree with each other very well.
This is unsettling. All raters in these studies are experts in this field with many years of experience. Individually, they evaluate those same signs of laryngeal irritation on a daily basis, and based on those observations, they make diagnoses and treatment plans. They have successful practices, and their patients get better. Yet, when their evaluations are compared with those of their colleagues, it becomes clear that they do not always agree on what they see.
 We Are Not Alone
Puzzled by these findings, we looked for answers in other fields, and we were surprised to find that we were not alone. It soon became clear that problems with perception and evaluation of medical images were pervasive across most specialties. The reality is that these problems affect not only raters’ variability in research studies but also the ability of health professionals to diagnose patients accurately based on medical images.
For example, in a study of visual assessment of brain atrophy on magnetic resonance imaging (MRI), a team from The Netherlands asked four expert raters—three neurologists and one neuroradiologist—to rate medial-temporal lobe atrophy on MRI in 100 studies of elderly individuals. Complete agreement was limited to only 37% of the total sample (kappa = 0.44).5
When it comes to interpreting mammograms, it is well known that there is considerable variability among radiologists.6 In one study, 10 radiologists interpreted mammograms showing clustered microcalcifications in 104 patients. They then made recommendations for biopsy or other follow-up measures. Analysis of their recommendations showed that the level of agreement was frighteningly low, about 13% (kappa = 0.19). This variability strongly highlights problems with diagnosis of breast neoplasms, which adversely affect clinical decision making. As a result, many women may be getting conflicting clinical advice when it comes to treatment of breast cancer.
Van de Steene and colleagues caution that variability in image interpretation plagues radiation therapy planning and evaluation for a variety of tumor sites, particularly in the assessment of lung cancer.8
Cardiology is similarly plagued by disagreements over medical image interpretation, and numerous studies show that kappa values for visual assessment are low. The most cited study in the stress echocardiography literature is probably Hoffmann et al.9 In this study, experts from five experienced centers had greatly varying interpretations of 150 dobutamine stress echocardiograms obtained in patients undergoing coronary angiography. The number of studies evaluated as positive ranged from 38 to 102 (n = 150). Agreement on what constituted normal versus abnormal results was reached only in 73% of patients, for a mean kappa of 0.37. In other words, in 27% of cases, these expert cardiologists disagreed as to whether or not some patients were healthy or had heart disease! In another example, marked variability was found in the assessment of coronary stenosis severity and left ventricular function evaluation of coronary angiographies.10 This study reported that agreement in the significance of a stenosis was found in only 13 of 20 coronary angiograms (65%) when read by four experienced coronary angiographers from the same institution. These data disturbingly suggest that a patient’s diagnosis of “normal” versus “heart diseased” depends on which cardiologist reads the study.
Problems also exist in other specialty areas quite familiar to otolaryngologists. Evaluation of videofluoroscopic swallow studies has shown considerable variability in interpretation of certain parameters. In one study, nine independent observers from different international swallow centers rated 26 different parameters in 51 patients who had been referred for a modified barium swallow.7 Kappa coefficients were as low as 0.01, 0.02, and 0.03 for parameters such as aspiration before swallow, penetration before swallow, and upper esophageal sphincter closing time, respectively. The authors concluded that modified barium swallow evaluations were highly reliable only in the case of aspiration, whereas reliability was poor for all other parameters of oropharyngeal swallow. To be sure, not all studies of evaluations of medical images show such low reliability scores. Nevertheless, in some areas, serious problems exist, and we have chosen to highlight those to point out a problem that needs to be addressed.
 Sources of Variability
The variability in interpretation of medical images affects the diagnostic accuracy of health professionals. In addition, it directly affects their clinical decisions and ability to recommend appropriate treatment. Given that this variability decreases clinical effectiveness, it should be recognized and improved whenever possible.
Variability may result from two sources: (1) the human element and how the visual input is processed, and (2) the instrumentation used to obtain, process, or display the image. The rapid technological advances in diagnostic imaging instrumentation—such as MRI, PET scans, virtual slide projectors, and other digital image acquisition devices used in all areas of medicine—also need to be considered, because of the potential to affect our perception. As Dr. Krupinsky, a researcher in the Departments of Radiology and Psychology at the University of Arizona, points out, “The emergence of new technologies raises important questions concerning optimization of the acquisition, storage, transfer and display of image, as well as text-based information, choice of appropriate display media and format, optimization of image compression, and optimization of image processing and computer-aided detection (CAD) and diagnosis (CADx). It is only through systematic and objective evaluation of the entire imaging system—from hardware to human interpretation of images—that these questions can be answered.”11,12
 Human factors that affect diagnostic performance: observer variability
 Differences in reading criteria
 Differences in thresholds or markers to classify results as positive or negative
 Differences in level of expertise (expert vs novice)
 Observer environment (time to evaluate an image, fatigue factor, etc.)
 Technological factors that affect diagnostic performance: instrument variability
 Image quality (sharp or blurry)
 Image processing and storage
 Image display
 Choice of instrumentation (eg, type of endoscope)
 Technical efficacy (how accurately the images are obtained)
The following are examples of these factors that pertain to laryngology and how they can affect an evaluation:
 Adjustments to the camera or display controls can alter the overall color of the image. More redness in an image can indicate, or be interpreted as, a higher degree of erythema.
 Endoscope position (distance between the tip of the endoscope and the structure of in terest, angle of vision, etc.) will change the size or view of the resulting image, potentially influencing diagnostic performance.
An important difference may result from the choice of endoscope and can affect diagnostic ability.4 Figures 5.1 and 5.2 show examples of images from the same patients obtained only minutes apart. The images on the left were taken with a flexible fiberscope, and the images on the right were obtained with a rigid endoscope. In both examples, the images on the left show a more edematous larynx, and furthermore, in Fig. 5.2, there is clear evidence of a bilateral pseudosulcus (subglottic edema) on the flexible fiberscope image, but the vocal folds appear less edematous, and pseudosulci are not evident when the same patient is evaluated with a rigid endoscope. These findings suggest that identification of laryngeal abnormalities depends not only on the examiner (intraobserver and interobserver variability) but also on the tools that are used. The choice of imaging technique (rigid versus flexible endoscopy) makes a difference in what we see and can therefore affect the accuracy and the objectivity of the laryngoscopic examination in certain settings.
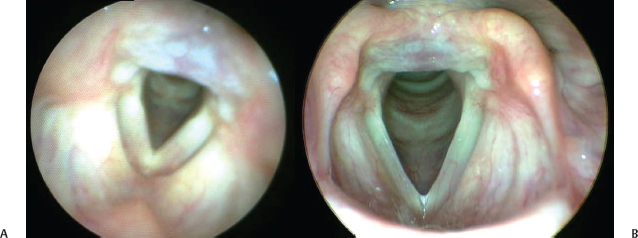
Fig. 5.1 Images taken from the same patient only minutes apart. with a flexible scope (A) and a rigid scope (B). In the image taken with a flexible scope, the larynx appears more edematous.
 Research Interest and What Is Being Done
As noted above, research in this area began after World War II, when a study published in 1947 comparing methods for detecting tuberculosis in chest images found a high degree of interobserver and intraobserver variability. This study generated enough interest that eventually, the field of medical image perception was created. In the past 60 years, there has been significant progress in applying quantitative methods to the assessment of visual diagnostic performance and to the evaluation of medical image quality in terms of task performance. The Far West Image Perception Conferences have been held biannually since 1985. These conferences have assembled an international group of radiologists, psychologists, physicists, engineers, and statisticians interested in the relationship of image perception and decision making, psychophysics, and diagnostic imaging.
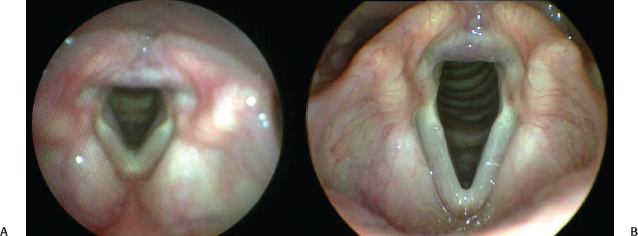
Fig. 5.2 Images taken from the same patient only minutes apart with a flexible scope (A) and a rigid scope (B). There is clear evidence of a bilateral pseudosulcus (subglottic edema) on the flexible fiberscope image, but the vocal folds appear less edematous and pseudosulci are not evident when the same patient is evaluated with a rigid endoscope.
In November 1994, the National Institutes of Health convened a meeting for developing a long-term plan for imaging research, which included, as a priority, issues of perception. The NIH generated five specific goals:
- Develop psychophysical models for the detection of abnormalities in natural medical images.
- Improve understanding of the mechanisms of perception as they apply to medical images.
- Develop aids for enhancing perception by use of approaches that provide interactions between vision and display.
- Study perceptually acceptable alternatives to sequential sections for viewing images from cross-sectional imaging examinations.
- Perform methodological research aimed at improving the evaluation of medical imaging systems; alternatives to standard methods for measuring observer performance should be encouraged.
Then, in 1997, partly as a result of this meeting, the Medical Image Perception Society (MIPS) was established “to promote research and education in medical image perception, and provide a forum for the discussion of perceptual, psychophysical, and cognitive issues by radiologists and basic scientists.” This society “seeks an improved understanding of the perceptual factors that underlie the creation and interpretation of medical images.” The society’s goals are:
- The development of imaging systems to help optimize the interpretation of the visual diagnostic information.
- Work on perception research that will
- a. identify the specific reasons for missed diagnoses and thus help train physicians and eliminate diagnostic errors; and
- b. clarify situations in which errors are a consequence of fundamentally ambiguous information rather than negligence.
- a. identify the specific reasons for missed diagnoses and thus help train physicians and eliminate diagnostic errors; and
Another group was created through collaboration between the U.S. Food and Drug Administration, the Center for Devices and Radiological Health, and the National Institute of Biomedical Imaging and Bioengineering, part of the National Institutes of Health. These agencies established the Laboratory for the Assessment of Medical Imaging Systems, run by Dr. Kyle Myers. The goal of LAMIS is to make safe and effective medical imaging products available to health care professionals in a rapid manner, as well as the development and evaluation of assessment methodologies for medical imaging systems.
Current projects cover the following areas:
 Image acquisition: Development of new digital imaging devices, with a broad range of performance characteristics.
 Image display: Displays are currently considered to be the weakest link of the imaging chain for many applications (eg, mammography), therefore development of measurement and analysis procedures to evaluate the performance of image display devices for digital diagnostic imaging systems are under way.
 Computer-aided diagnosis: Recent studies indicate that helical computed tomography may be an effective screening tool for lung cancer, and full-field digital mammography has been developed into a clinical tool. The primary goal of this project is to develop additional in-house CADx expertise.
 Multivariate statistical assessment: Development of study designs, objective measurements, and analytical methods for the laboratory and clinical assessment of medical imaging systems, systems for CADx used in medical imaging, and stand-alone image-based computerized diagnostic moda- lities such as high-dimensional DNA microarrays (DNA chips).13,14
Another academic group is the Vision and Image Understanding Laboratory at the University of California, Santa Barbara. This laboratory, run by Miguel Eckstein, “pursues computational modeling of behavioral, cognitive neuroscience and physiological data with the aim of elucidating the mechanisms and neural substrates mediating perception, attention, and learning.” These investigators use acquired knowledge in conjunction with computer science and engineering tools to improve human performance in life critical decisions such as when doctors examine medical images for signs of tumors. The laboratory has done seminal work on improving detection of tumors on mammograms.
The University of Iowa’s Department of Radiology also hosts an excellent group, headed by Kevin Berbaum. The Medical Image Perception Laboratory investigates the human component of image interpretation, studying the perceptual and intellectual aspects of how a physician interprets images, to be able to understand and correct the causes of interpretive failure.
Other researchers well known for their work in this area include Elizabeth Krupinsky at the Departments of Radiology and Psychology at the University of Arizona. Krupinski is the president of the Society for Perception of Medical Images, and her main interests are in medical image perception, assessment of observer performance, and human factors issues. Claudia Mello-Thoms at the University of Pittsburgh investigates image perception and image interpretation, as well as visual search, and modeling of the decision-making process involved in reading medical images.
 How to Improve Interpretation
Since the mid-1990s, and as computer technology and digital imaging systems have advanced, numerous groups have modeled human performance and proposed computer-aided detection and diagnosis algorithms. These have been applied to clinical settings and have helped improve the accuracy of diagnosis and interpretation. The use of CAD can have a dramatic impact on performance, as demonstrated in studies mentioned earlier in the chapter. When coronary angiograms were reevaluated with the aid of a computer-assisted quantitative program, the agreement in interpretation improved substantially, with an increase of kappa scores from 0.36 to 0.71.9 Computer-aided assistance also reduced variability and increased agreement among observers from 13 to 32% of the total cases (increasing kappa scores from 0.19 to 0.41) in the interpretation of mammograms showing microcalcifications.6 However, problems remain. Even with computer assistance, clinicians continue to miss lesions, and new technologies frequently introduce new errors, showing that more work needs to be done.
To date, recommendations from these groups that can help improve accuracy include:
 Examine the image multiple times. Avoid diagnosis or rating upon first viewing.
 As image quality correlates with overall agreement on presence or absence of abnormalities, exclude poor-quality images.
 Optimize the image for the viewer.
 Optimize the display for the viewer.
 Be aware that there generally is higher agreement in extremes (normal or severe) but less agreement in more subtle findings.
 Additionally, the profession needs to act on certain issues. These include:
 The need to refine and unify reading criteria. Develop clear standards for classifying normal versus pathologic, and provide clear anchors for diagnostic or research tasks.
 The need to adapt methods for improving image interpretation from different fields to laryngology.
 Conclusion
The problems associated with the perception of medical images are of concern and undoubtedly account for errors in diagnostic interpretation that may result in poor patient care, lawsuits, and unnecessary health care spending. The problems are not restricted to the field of laryngology but are pervasive throughout most medical fields and likely inherent to any visual-perceptual task. The contributing factors to different interpretations are both human and technological. On the human side, differences in reading criteria, thresholds for classification, level of expertise, environment, and subjective conditions such as fatigue can alter interpretation. On the technological side, image quality, processing, storage, use of different instruments, displays, and the human-technological interface can all influence interpretation.
Fortunately, several groups are working creatively to mitigate this problem. As voice and larynx specialists, we routinely interpret medical images for diagnostic and research purposes. We can benefit from work done in other medical fields. By staying on top of research in this area, we can incorporate mitigating measures as they are developed and we can adapt innovations to our field to improve our ability to diagnose and treat our patients, providing them with the best possible care. Finally, understanding the widespread problem of interpretation of medical images should serve as a cautionary note against our overconfidence in the diagnosis and treatment of our patients.
References
1. Birkelo C, Chamberlain W, Phelps P. Tuberculosis case finding: a comparison of the effectiveness of various roentgenographic and photofluorographic methos. JAMA 1947;133:359–366
2. Kundel HL. History of research in medical image perception. J Am Coll Radiol 2006;3:402–408
3. Hicks DM, Ours TM, Abelson TI, Vaezi MF, Richter JE. The prevalence of hypopharynx findings associated with gastroesophageal reflux in normal volunteers. J Voice 2002;16:564–579
4. Milstein CF, Charbel S, Hicks DM, Abelson TI, Richter JE, Vaezi MF. Prevalence of laryngeal irritation signs associated with reflux in asymptomatic volunteers: impact of endoscopic technique (rigid vs. flexible laryngoscope). Laryngoscope 2005;115:2256–2261
5. Scheltens P, Launer LJ, Barkhof F, Weinstein HC, van Gool WA. Visual assessment of medial temporal lobe atrophy on magnetic resonance imaging: interobserver reliability. J Neurol 1995;242:557–560
6. Jiang Y, Nishikawa RM, Schmidt RA, Toledano AY, Doi K. Potential of computer-aided diagnosis to reduce variability in radiologists’ interpretations of mammograms depicting microcalcifications. Radiology 2001; 220:787–794
7. Stoeckli SJ, Huisman TA, Seifert B, Martin-Harris BJ. Interrater reliability of videofluoroscopic swallow evaluation. Dysphagia 2003;18:53–57
8. Van de Steene J, Linthout N, de Mey J, et al. Definition of gross tumor volume in lung cancer: inter-observer variability. Radiother Oncol 2002;62:37–49
9. Hoffmann R, Lethen H, Marwick T, et al. Analysis of interinstitutional observer agreement in interpretation of dobutamine stress echocardiograms. J Am Coll Cardiol 1996;27:330–336
10. Zir LM, Miller SW, Dinsmore RE, Gilbert JP, Harthorne JW. Interobserver variability in coronary angiography. Circulation 1976;53:627–632
11. Krupinski EA, Jiang Y. Anniversary paper: evaluation of medical imaging systems. Med Phys 2008;35: 645–659
12. Krupinski EA. The importance of perception research in medical imaging. Radiat Med 2000;18:329–334
13. Department of Health and Human Services, U.S. Food and Drug Administration. About the Center for Devices and Radiological Health: Office of Science and Engineering Laboratories. Available at: http://www.fda.gov/cdrh/osel/programareas/medicalimaging.html. Accessed June 1, 2009
14. National Institute of Biomedical Imaging and Bioengineering. Research, NIBIB Intramural Labs. Laboratory for the Assessment of Medical Imaging Systems (LAMIS). Available at: http://www.nibib.nih.gov/-Research/Intramural/LAMIS. Accessed June 1, 2009
Stay updated, free articles. Join our Telegram channel

Full access? Get Clinical Tree


