(28.1)
Fig. 28.1
Schematic illustrating the principle of reflectance confocal microscopy
The axial response of a confocal microscope to a perfectly reflecting plane at the focus under Gaussian beam assumptions can similarly be described as

where dz represents the FWHM of the axial irradiance [4]. As shown, the transverse resolution varies inversely with the numerical aperture (NA) of the objective lens, while the axial resolution or axial sectioning capability of the confocal microscope varies inversely with the square of the NA. Hence, image quality in scattering objects requires the use of high magnification, high-NA objectives. With such high NA lenses, typically NA 0.7–1.2, confocal microscopy systems can achieve 3–5 um axial sectioning capability and better than 1 um transverse resolution [5].
(28.2)
To generate an image in two dimensions, several scanning approaches have been demonstrated, including sample scanning, objective scanning, and beam scanning [3]. The use of laser sources marked a major development in confocal microscopy [6, 7] and enabled high speed, high resolution point scanning systems at multiple wavelengths. Typically, the confocal scanning laser microscope (CLSM) samples an en face scan plane by rapidly raster scanning the beam on tissue.
Confocal laser scanning microscopy was demonstrated for in vivo cellular imaging of human tissues at visible wavelengths [4]. Advances in instrumentation and design led to the development of video-rate reflectance systems capable of reliable imaging in clinical applications [4, 8, 9]. These systems offer high power illumination and extension to deeper penetrating wavelengths in the near infrared. Operating at wavelengths of 800 nm and 1,064 nm, the systems provide transverse resolution of 0.5–1 um and axial sectioning capacity of 3–5 um. Confocal reflectance imaging of human skin [9–13], oral mucosa [14], and cervix [15] has demonstrated the capability to image normal and pathologic cellular features in vivo with impressive correlation of confocal images with histology. Commercial versions of the CLSM imaging system now offer new tools for clinical diagnostic applications in dermatology and other specialties where open access to tissue specimens is possible. In addition, endoscope compatible reflectance confocal microscopes are being developed [16, 17].
Using exogenous fluorescence dyes to provide contrast, fluorescence confocal endoscopy has been developed for clinical application in the gastrointestinal tract [4, 18–24]. Excellent in vivo image quality has generated excitement about this technology and has set a standard for reflectance-based endoscopic methods to match. Because excitation of fluorophores is typically performed with visible wavelengths, however, fluorescence confocal imaging has limited penetration depth. In addition, exogenous dyes can have toxicities, which may limit clinical applicability. Reflectance-based, endoscopic confocal or optical coherence microscopy methods that can provide comparable image quality at greater depths, but without the need for exogenous contrast, would therefore be an important advance.
28.3 High Transverse Resolution in Optical Coherence Tomography
Compared with confocal microscopy, conventional optical coherence tomography systems work in the opposite focusing limit. In OCT, the focal spot size is comparatively large because of the need to use relatively low NA lenses in order to preserve a sufficient depth of field for cross sectional imaging. As the NA of the OCT optics increases, the depth of field decreases and signal loss occurs at depths away from the focus. Figure 28.2 compares these focusing limits and their implications for OCT image formation. Images are acquired by setting the focus to a defined position in the tissue and detecting light from different depths by coherence gating, either in the time domain or in the frequency domain. In confocal microscopy, the goal is precisely to use high NA focusing to restrict the depth of field, such that light outside of the focal plane is rejected. En face images are then formed by rapidly raster scanning the beam.
Fig. 28.2
Focusing limits for OCT imaging. Use of a low numerical aperture lens (a) preserves depth of field across the entire depth scan while a higher aperture lens (b) leads to restricted confocal parameter and signal loss at the edges of the depth scan. Confocal parameter, b; Coherence length l c
Several solutions to overcome the depth of field restriction in OCT have been demonstrated in the literature. These methods can be classified into three types according to the image acquisition scan protocol, as illustrated in Fig. 28.3. Depth priority methods maintain the cross-sectional imaging plane of conventional OCT by rapidly acquiring along the depth axis while scanning the transverse beam position at the image frame rate. Transverse priority OCT techniques also scan a cross-sectional plane. In contrast, however, the transverse beam position is scanned to rapidly acquire the transverse axis, while varying the depth axis at the frame rate. The third option is to acquire an en face image plane analogous to confocal laser scanning microscopy.
Fig. 28.3
Image scanning protocols for optical coherence tomography
28.3.1 Depth Priority Techniques
One strategy for maintaining high transverse resolution across the image using depth priority scanning is to coordinate the optical focus depth with the depth of the coherence gate. This approach has been termed focus tracking in the literature and has been used by Schmitt et al. to generate high quality cross-sectional images of human skin with 3 um transverse resolution [25]. Coherence depth scanning was synchronized with focus depth scanning by mounting the reference reflector and the focusing objective on a single translation stage. The disadvantage of this setup is the relatively limited axial scan rates that can be achieved using mechanical translation of the objective. Image acquisition required nearly 30 s for 256 lines. Lexer et al. devised a different scheme for high speed focus tracking based on a novel microscope design that shifts the beam focus through the object without changing the reference path length [26]. Images were acquired of an in vitro human cornea specimen in approximately 1 s with 5 um transverse resolution. The ability to scan the focus without translating the optical path required careful choice of the microscope magnification, which limits overall design flexibility. Other groups have investigated fast focus adjustment using a variable focus micromachined mirror [27, 28] or liquid lens [4, 29, 30].
Typical focus tracking approaches are not readily compatible with high speed, Fourier domain detection OCT techniques. In Fourier domain OCT, backscattered or backreflected light is acquired from all depths simultaneously in the frequency or Fourier domain and axial scan information is subsequently reconstructed using a Fourier transform. Fourier domain OCT methods have been shown to have a significant speed and sensitivity advantage compared with time-domain OCT [31–33]. Two basic Fourier domain implementations have been demonstrated. Spectral/Fourier domain OCT uses a broadband light source and a spectrometer with a line scan camera in the detection arm. Swept source/Fourier domain OCT uses a frequency swept laser source and individual photodiode detectors. In either implementation, depth scanning of the coherence gate is not performed, and it is therefore impossible to perform classic focus-tracking to extend depth of field. The increases in speed and sensitivity, however, have made Fourier domain detection the method of choice for most OCT imaging applications, such as ophthalmology and intravascular imaging [4, 34–36]. Strategies for improving the transverse resolution that are compatible with both time and Fourier domain detection are therefore desirable.
One technique for improving transverse resolution that works for all OCT implementations has been termed C-mode scanning in analogy to ultrasound. This method was demonstrated for OCT by Drexler et al. using an ultrahigh resolution OCT system with 1 um axial × 3 um transverse resolution [37]. Figure 28.4 presents the concept of C-mode scanning. Multiple OCT images with high axial and transverse resolution were acquired with the focal position set at different depths. The individual images in Fig. 28.4a clearly demonstrate the limited depth of focus. These images were overlapped and fused in Fig. 28.4b to form a single image with extended depth of field. Cellular and subcellular structures in the Xenopus laevis tadpole are visualized. C-mode scanning and image fusion techniques have also been demonstrated for Fourier domain OCT [38, 39]. Like focus-tracking, C-mode scanning still requires translation of the focal position in depth, albeit at a much slower rate. The number of images required scales inversely with the desired transverse resolution. As the focal spot and depth of field for an individual image is reduced, more images are required, which reduces the overall frame rate that can be achieved in the composite image. To address this limitation, Yang et al. developed a multi-focus fiber probe capable of simultaneously generating images at different depths in tissue [40]. In the initial demonstration, four simultaneous images were acquired while maintaining a spot diameter of 9–14 um.
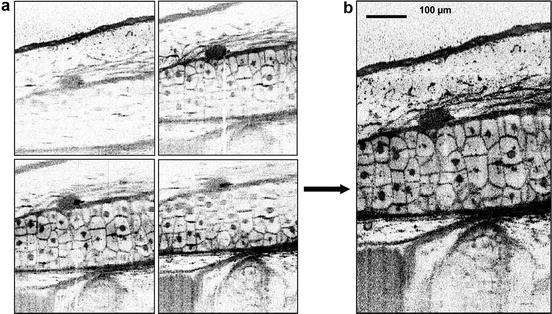
Fig. 28.4
C-mode scanning in optical coherence tomography. Acquisition of individual images with high transverse resolution but restricted depth of field can be reconstructed to form a single image with extended depth of field (Images are reproduced from Drexler et al. [37])
Other techniques are being developed to increase the image depth of field without requiring focus translation or offset. Ding et al. proposed the use of an axicon lens in the OCT probe to generate a long focal volume [41]. In phantom imaging experiments, a 6 mm focusing depth range with 10 um transverse resolution was demonstrated. Axicons produce a cylindrical Bessel beam field distribution with an extended central lobe lying along the optical axis of the lens and are typically used in the form of refracting cone lenses. Unfortunately, there is a trade-off between signal intensity and focusing range since the axicon distributes the focal energy along the focusing range and the central lobe of the Bessel field carries only a fraction of the total power compared with a focused Gaussian beam. In double pass reflection geometry, the squared signal loss limits the utility for high sensitivity imaging in biological tissues. Leitgeb et al. has improved upon the initial axicon demonstration by using the improved sensitivity of spectral domain detection in combination with a modified confocal detection scheme [42]. Transverse resolution of ∼1.5 um was maintained over 200 um image range with a sensitivity of 105 dB. Liu et al. have used sample beam apodization as an alternative means to achieve longer depth of field while preserving lateral resolution. In a method they have termed micro-optical coherence tomography (μOCT), a custom designed microscope using beam apodization is combined with a high speed, ultrahigh resolution spectral/Fourier domain OCT system to achieve resolution of 2 um × 2 um × 1 um with 16 kHz axial scan rate [43]. Striking cellular resolution images of human coronary arteries and human trachea ex vivo have been demonstrated [43, 44]. Techniques such as these are compelling for high speed, cross-sectional cellular imaging and will undoubtedly be the subject of further research and development.
Another approach for increasing transverse resolution without focus adjustment is the use of post-processing algorithms. Image processing is attractive for increasing resolution since the algorithms require minimal to no modifications to existing OCT setups and can be applied offline to large volumes of data. Advanced image processing approaches are enabled by the enhanced phase stability of Fourier domain OCT methods. Ralston et al. have introduced synthetic aperture inverse scattering methods for reducing transverse blurring in OCT images [45]. Depth of field and resolution improvement was demonstrated in scattering phantoms and selected human breast specimens [46]. Adie et al. subsequently showed that computational aberration correction can be combined with synthetic aperture techniques to further image enhancement [47]. The development of high speed processing strategies for real-time imaging [48] and further investigation of these methods in the high NA limit has promise for cellular imaging.
28.3.2 Transverse Priority and En Face Imaging
Transverse priority image acquisition requires rapid transverse scanning of the beam on tissue and slow depth scanning, as illustrated in Fig. 28.3b. Podoleanu et al. suggested transverse priority scanning for performing OCT imaging of the retina and skin [49]. As in C-mode scanning, transverse-priority acquisition enables a slow translation of the focus in tissue at the image frame rate. If focus-tracking is implemented to coordinate the depth scan and focus translation, then no image fusion is required and data collection is very efficient. Cobb et al. demonstrated continuous focus tracking to achieve in vitro OCT images of excised rabbit esophagus at 1 frame/s with transverse resolution of 10.5 um [50]. Transverse scanning was performed at 1.37 kHz using a miniaturized probe, and the reference path length was adjusted to compensate for index of refraction path length shifts produced by the air-tissue interface.
To date, en face imaging has proven to be the most robust approach for achieving fine enough transverse resolution for cellular imaging in scattering tissues. In the en face plane, the position of the coherence gate can be matched to the position of the optical focus while the beam is raster scanned in two transverse dimensions on the sample. In this manner, high speed focus tracking methods are not required and the image acquisition rate is limited only by the speed of the XY scanner. Furthermore, high NA can be used to achieve high axial and transverse resolutions, in the confocal limit. The implementation of en face optical coherence microscopy was first demonstrated by Izatt and colleagues [51], although it has a history in the development of confocal interference microscopes [52–56]. Izatt and others demonstrated that broadband coherence gating can significantly enhance the imaging depth of conventional confocal microscopy [51, 57, 58]. Subsequently, Izatt et al. showed that en face OCM could generate high quality images of cellular features deep below the surface in human gastrointestinal tissues [59]. In vivo en face optical coherence tomography was implemented for imaging in the skin and retina, although systems were limited to relatively low transverse resolution and were not capable of visualizing cellular features [49, 60]. In comparison, the development of en face optical coherence microscopy for in vivo cellular imaging applications has been relatively slow. In part, this is related to the numerous exciting developments in OCT imaging, which have spread the efforts of researchers across many fronts. In addition, however, OCM technology development for cellular imaging presents unique challenges and requires additional complexity compared with other OCT methods. The remainder of this chapter is devoted to discussing the challenges and the advantages of en face OCM imaging and to describing progress toward in vivo cellular imaging applications.
28.3.3 En Face Imaging in the Time and Fourier Domain
En face OCM systems based on time domain and Fourier domain detection techniques have both been developed and will be detailed in this chapter. Given the dramatic speed advantages of Fourier domain versus time domain OCT for cross-sectional imaging, it is worth discussing the relative performance of the two approaches for en face imaging. For imaging in the en face plane, time domain detection approaches can actually have an advantage in terms of imaging speed compared with Fourier domain detection. This results from precisely the same property of Fourier domain detection that creates the sensitivity advantage for cross-sectional imaging. Using spectral/Fourier domain detection or swept-source/Fourier domain detection, signals from multiple depths are detected simultaneously. In order to acquire an en face image, an entire three-dimensional volume must effectively be acquired. This places a tremendous demand upon the Fourier-domain OCT system axial line rate and data processing capabilities in order to achieve high frame rates in the en face plane. For a typical image of 500 × 500 pixels, acquisition speeds of 8 frames/s require an axial scan rate of two million axial lines per second. This is beyond the specifications of standard spectral/Fourier domain or swept source/Fourier domain systems reported in the literature. For spectral/Fourier domain systems with line rate of 29 kHz [34], acquisition of a 500 × 500 scan volume would take over 8 s. Similarly, swept source/Fourier domain systems operating at 15–20 kHz [38, 61, 62] would require 12–17 s for the same volume.
By contrast, time domain OCT imaging systems acquire signals from only a single en face plane. Rather than scanning in depth to generate a Doppler frequency for detection, en face imaging systems use phase modulation in the reference arm to provide an external carrier [59]. The reference path is set to the focus depth such that only one depth is sampled at any given transverse position. Image acquisition rate is then determined by signal to noise constraints and by the maximum speed of the XY scanners. In addition, the intrinsic sensitivity advantage of Fourier domain detection vanishes when only a single en face plane is of interest. For a given image acquisition time, the increase in line rate required for sampling a three-dimensional volume in Fourier domain detection cancels the sensitivity advantage compared with sampling a single en face plane in time domain.
There are, however, significant advantages to performing en face OCT and OCM imaging using Fourier domain detection. Sampling of an entire volume can be quite powerful. Within the depth of field allowed by the confocal parameter of the optics, arbitrary en face planes can be displayed from the volume or structures can be rendered in three dimensions. In addition, Fourier domain detection provides greatly increased phase stability compared with time domain detection. Choma et al. [63] and Joo et al. [64] demonstrated this property and implemented spectral/Fourier domain phase microscopy using common path interferometer designs. Other OCT/OCM methods including numerical dispersion compensation [65] and spectroscopic OCM [66] have also shown to have advantages in the spectral/Fourier domain.
Importantly, the volumetric nature of the Fourier domain data makes possible computational approaches for aberration correction and compensation of path length variations between reference and sample arm, which are critically important for fiber-optic microscope and endoscope configurations. In addition, the majority of commercial laser scanning confocal microscopes have a variation of the optical path length as the beam is scanned over the field of view. This delay variation with scanning is caused by optical designs which use paired galvanometer scan mirrors, where the mirrors are not located precisely at the telecentric scan planes. This has prevented the integration of OCM using time domain detection with widely available commercial microscopes, since it is difficult to match the coherence and confocal gates across the field of view as the beam is scanned. In addition, with fiber-optic sample arm probes, manipulation and stretching of the fiber leads to small path length changes that can degrade signal. Fourier domain OCM systems, which acquire a volumetric image around the zero path delay, can allow pixel-by-pixel optimization of path-delay variation over the field of view.
Ultrahigh imaging speeds for Fourier domain OCM are also becoming available, particularly for swept source/Fourier domain imaging. Axial line rates of up to 5.2 MHz have been demonstrated using Fourier-domain modelocked (FDML) lasers [67] and up to 1 MHz using vertical cavity surface emitting lasers (VCSEL) [68, 69]. As imaging speeds for en face Fourier domain OCM continue to improve, the advantages of these methods over time domain techniques will become more important for future in vivo imaging applications.
28.4 Combined Confocal and Coherence Gating in OCM
OCM utilizes high NA optics together with broadband light sources to reject unwanted scattered light using both confocal gating and coherence gating. To understand how these two mechanisms interact, consider the detected heterodyne signal in a typical time domain OCM system. An equivalent derivation can also be shown for Fourier domain systems. In the time domain system, light from the low coherence light source is split between a reference arm and a sample arm. The reference and sample reflectivities are denoted R r and R s , respectively. A wavelength dependent phase delay ϕ (ω,t) can be imparted by a reference phase modulator. Light returning from the sample and the reference path interferes at a photodetector. Ignoring the transverse dependence of the interfering electric fields, the time averaged photocurrent at the detector can be written as [70]
where η is the detector quantum efficiency, e is the electronic charge, hv is the photon energy and η f is the intrinsic impedance of the fiber core material. The detector response time is taken to be much longer than the coherence time for a low-coherence source but much shorter than the heterodyne signal beat oscillations. For a polychromatic, low-coherence source, the oscillating component of the heterodyne signal depends on the sum of the interference due to monochromatic plane waves and can be determined by integration of the cross-spectral interference term over the bandwidth of the light source. Ignoring the sample arm confocal response and assuming pure phase delay scanning from the reference arm modulator, the heterodyne photocurrent can then be written in terms of the optical frequency ω and center frequency ω 0 as
![$$ {i}_D\left(\Delta l\right)\propto {R}_R{R}_S\left\{{F}^{-1}\left[{S}_o\left(\omega \right)\right]\right\} \cos \left({\omega}_o\Delta {t}_p\right)={R}_R{R}_S{G}_o\left(\frac{2\Delta l}{v_g}\right) \cos \left[\frac{2{\omega}_o\Delta l}{v_p}+\phi \left({\omega}_o,t\right)\right] $$](/wp-content/uploads/2017/03/A76297_2_En_29_Chapter_Equ4.gif)
where

and

describe the phase velocity v p and group velocity v g in terms of the phase delay Δτ p , group delay Δτ g , and the difference in path length Δl = l S − l R between the sample and reference arms. The source power spectrum S o (ω) is related to the autocorrelation G o (Δτ g ) by the Fourier transform with respect to the group delay. The autocorrelation is a measure of the degree of temporal coherence of the source. Using the concept of the time-bandwidth product in Fourier transform theory, it is clear that the width of the interference signal envelope decreases for larger bandwidth or shorter coherence length light sources. In the case of a Gaussian light source spectral distribution, the full width at half maximum (FWHM) of the interference signal in free space can be shown to relate to the center wavelength λ 0 and spectral bandwidth Δλ as [70]
(28.3)
(28.4)
(28.5)
(28.6)
(28.7)
This expression is typically used for the specification of the coherence gate or axial resolution of a low-coherence interferometry system.
Izatt et al. described the heterodyne signal in OCM by incorporating a sample reflection in confocal geometry [59]. The influence of the sample arm confocal microscope is determined by the convolution of the field reflectivity function R S (x, y, z) with the confocal impulse response [h I (x, y, z)]2. The appropriate confocal point spread function for a fiber-based microscope has been described by Gu et al. [71]. For an axially distributed reflectivity that is present in scattering media, the heterodyne signal can be written as an integral over the sample arm path length l S . Replacing R S in Eq. 28.4 with the confocal response and integrating over the sample path, the heterodyne current becomes
![$$ {i}_D\left(\Delta l\right)\propto {\displaystyle \underset{-\infty }{\overset{\infty }{\int }}d{l}_S}{R}_R\left[{R}_S\left({l}_S\right)\otimes {\left[{h}_I\left({l}_S\right)\right]}^2\right]{G}_o\left(\frac{2\Delta l}{v_g}\right) \cos \left[\frac{2{\omega}_o\Delta l}{v_p}+\phi \left({\omega}_o,t\right)\right] $$](/wp-content/uploads/2017/03/A76297_2_En_29_Chapter_Equ8.gif)
where the (x,y) dependence of R s and h I have been ignored for simplicity. The heterodyne component is the convolution of the sample arm confocal response with the carrier dependent source autocorrelation term. For a single scatterer at a depth location l s0 with reflectivity R s (l s0), the heterodyne current reduces to [59]
![$$ {i}_D\left(\Delta l\right)\propto {R}_R{R}_S\left({l}_{S0}\right)\sqrt{I_C\left({l}_{S0}\right)}{G}_o\left(\frac{2\left({l}_{S0}-{l}_R\right)}{v_g}\right) \cos \left[\frac{2{\omega}_o\left({l}_{S0}-{l}_R\right)}{v_p}+\phi \left({\omega}_o,t\right)\right] $$](/wp-content/uploads/2017/03/A76297_2_En_29_Chapter_Equ9.gif)
where I c represents the confocal intensity response and, by definition, l s = 0 corresponds to the position of the focus.
(28.8)
(28.9)
From Eq. 28.9 it is evident that control of the positions and widths of the confocal and coherence gates are decoupled. The confocal gate width is determined by the NA of the focusing objective and its position is set by the focus position. For the coherence gate, the width is determined by the light source bandwidth, and, for fixed focus position, the depth location is set by the reference arm path length l R . The maximum heterodyne signal occurs when the reference and sample arm path lengths match l S0 = l R such that the coherence and confocal gates overlap. The sensitivity of the heterodyne signal to the relative position of the gates scales with the NA of the objective lens. For high NA, the confocal parameter b as shown in Fig. 28.2b is quite small and results in a small depth of field for imaging. When the reference path length is set to the microscope focus, l R = 0, the heterodyne amplitude is subject to the multiplication of the coherence and confocal gate point spread functions.
28.5 Advantages of OCM
For imaging in scattering media, combined confocal and coherence gating can have advantages compared with confocal gating alone. Coherence and confocal gating reject unwanted out of focus scattered light using distinct mechanisms. The confocal gate rejects light based on spatial imaging constraints, while the coherence gate rejects photons based on the path length they travel in tissue. The multiplicative effect of the two gates can be stronger than either gate individually, achieving greater image contrast and image penetration in scattering tissue. Moreover, as Wang et al. point out, the typical Gaussian coherence gate has a functional response which is not only more effective than the confocal gate but also more effective than the exponential extinction of incident light in tissue [72]. Figure 28.5 compares measured point spread functions on a log scale from an early OCM demonstration [51]. At depths of several tens of micrometers from the focus, the coherence gate rejects scattered light with orders of magnitude better efficiency than the confocal gate alone. In addition, the confocal axial response is affected by aberrations when focusing into tissue, which causes broadening of the peak of the point spread function and increases the wings of the response [73]. Combined coherence and confocal gating can help to minimize reductions in contrast due to loss of confocal axial resolution.
Fig. 28.5
Measured confocal and coherence-gated axial resolutions for a typical OCM imaging system. Data is presented on a log scale and demonstrates the improved rejection of out of focus scattered light using combined confocal and coherence-gating compared with confocal gating alone (Figure is reproduced from Izatt et al. [51])
Image penetration depth limits in confocal microscopy and their enhancement using coherence gating have been studied by several investigators [51, 58, 74–76]. Using single scattering theory, and signal to background noise considerations, Izatt et al. estimated the confocal penetration limit to be in the range of 5–8 mean free paths (MFP) [51]. Schmitt et al. used Monte Carlo simulations to investigate the role of multiple scattering and concluded that penetration depth is actually limited to the range of 2–4 MFP [75, 76]. Smithpeter et al. subsequently used experimental measurements to predict a similar penetration depth of about 3–4 MFP in amelanotic tissue [74]. Coherence gating has been shown to enhance image penetration by rejecting multiply scattered light, particularly from superficial depths. Based on the shot-noise quantum detection limit, initial estimates of imaging depth improvement were placed at 2–3 times compared with confocal gating alone [51]. As researchers became more aware of the sensitivity of coherence-gating methods to multiple scattering, these expectations were tempered. In highly scattering media, contrast in OCT and OCM images is limited by the ratio of single scattered to multiple scattered light, not by the quantum sensitivity limit [77]. Furthermore, the system sensitivity to multiple scattering is a function of both the optical properties of the tissue as well as the system design parameters, including the numerical aperture. Given these constraints, precise quantification of the image depth enhancement will depend upon the specifics of the application. Nonetheless, several initial studies in human tissues have demonstrated significant improvement using coherence gating. In one study, imaging of cellular features in colonic crypts was possible at depths of 500 um [59]. Another study imaging human oral mucosa demonstrated an average depth improvement of 33 % [78].
Since image quality is dependent upon both contrast and resolution, the question of resolution degradation in OCM images deep in scattering media is closely linked to the notion of imaging depth in OCM. Bizheva and Boas studied these questions using both simulation and experiment over a range of typical OCM parameters for scattering anisotropy and imaging NA [79]. Their results indicate relatively small changes in axial resolution at both low and high NA when imaging in media with low scattering anisotropy of 0.2. However, in media of high scattering anisotropy of 0.9, axial resolution degradation is quite rapid after 3–4 MFP. Moreover, degradation is more pronounced at lower NA compared with higher NA. With respect to transverse resolution, their results show no significant change up to seven MFP for either low or high anisotropy and some resolution degradation after seven MFP. Further studies such as these will be important to determine optimal parameters for deep cellular imaging in highly scattering tissues.
Combined coherence and confocal gating can have additional advantages beyond imaging depth improvement. One such advantage lies in the ability to use ultrahigh axial resolutions provided by very broad bandwidth light sources. Results from confocal microscopy in human skin demonstrate that achieving an axial resolution of <5 um is important for high contrast imaging of cellular features [4]. Such an optical slice axial thickness is similar to the conventional section thickness used in histopathology. Because the axial resolution depends inversely on the square of the NA (1/NA 2), achieving a 5 um axial resolution with confocal microscopy alone requires high NA objectives, typically in the range of 0.7–1.2 NA. Most OCM systems to date have operated in this limit, using the confocal axial section as the dominant gating method with the coherence gate acting mostly to reduce the background from out of focus scattered light.
The development of ultrahigh resolution OCT techniques opened the possibility of using the coherence gate rather than the confocal gate to set the optical section thickness [37]. Transverse resolution of 1–2 um can be maintained with much lower NA, since the transverse spot size only scales inversely with the NA (1/NA). This implies that OCM with ultrahigh axial coherence resolution can achieve high contrast cellular imaging with significantly reduced NA compared with confocal microscopy. Figure 28.6 demonstrates this operating limit. A confocal microscope with an axial resolution of ∼30 um was combined with a broad bandwidth modelocked Ti:Al2O3 solid-state laser light source and an OCM system with a broadband phase modulator [80]. The coherence gate measures ∼3 um and provides most of the optical sectioning power of this microscope. The effective NA of the microscope was only ∼0.22. Figure 28.6a shows that high transverse resolution is still maintained. The smallest elements measuring 2.2 um in width on the USAF 1951 resolution target can be visualized. Figure 28.7 demonstrates that high contrast cellular images in human tissue can be achieved, despite the low confocal axial resolution. Figure 28.7a, b present images from the Xenopus laevis tadpole, a commonly used model organism in developmental biology specimens. Cell nuclei and membranes as well as small vessels and blood cells are visible. Figure 28.7c, d show images of human skin in vivo. Epidermal cells and the lumen of a sweat duct can be clearly identified.
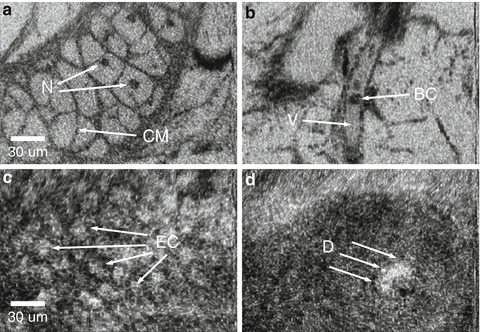
Fig. 28.6
Optical coherence microscopy using a femtosecond laser source. High transverse resolution of <2 um allows visualization of even the smallest elements of the USAF 1951 resolution target (a). This transverse resolution was achieved with a reduced numerical aperture compared with that typically used for confocal microscopy, resulting in a confocal axial resolution of only ∼30 um. A short coherence gate of ∼3 um was then used to compensate for the lower confocal resolution (Images reproduced from Aguirre et al. [80])
Fig. 28.7
In vivo cellular imaging with optical coherence microscopy. Images of Xenopus laevis tadpole (a, b) show cell membranes (CM), cell nuclei (N), and individual blood cells (BC) in a vessel (V). Epidermal cells (EC) and a duct (D) structure are also in images of human skin (c, d) (Images reproduced from Aguirre et al. [80])
The ability to image with reduced NA makes OCM an enabling technology for endoscopic imaging. Miniaturization of high NA objectives is a challenging optical design problem [81]. Using a broad bandwidth light source to provide ultrahigh axial coherence resolutions can reduce the numerical aperture requirement, therefore allowing smaller and simpler probe designs. Figure 28.8 further highlights this advantage. Confocal axial and transverse resolutions are plotted versus numerical aperture. OCM can achieve sufficient transverse resolutions in the range of 0.2–0.5 NA and lower, despite the rapid degradation of the axial resolution seen in confocal microscopy.
Fig. 28.8
Operating ranges for optical coherence microscopy compared with confocal microscopy
Figure 28.9 further illustrates the advantage of OCM for cellular imaging at lower numerical aperture compared to confocal microscopy. These images were acquired using a Fourier domain/swept source OCM system operating at 1.3 um center wavelength [82] and described in further detailed later in this chapter. Figure 28.9a, b demonstrate OCM images of colonic crypts and goblet cells taken with 10×/0.3 NA and 20×/0.4 NA lenses, respectively. For comparison, Fig. 28.9c, d are simulated confocal images generated from stacks of OCM images taken at the same magnifications and at the same tissue location. The image stacks have been summed over all depths, which simulates an effective axial resolution provided from only the confocal gate. Cellular features in the OCM images are clearly visible, however there is loss of resolution and contrast for cellular features in the simulated confocal images.
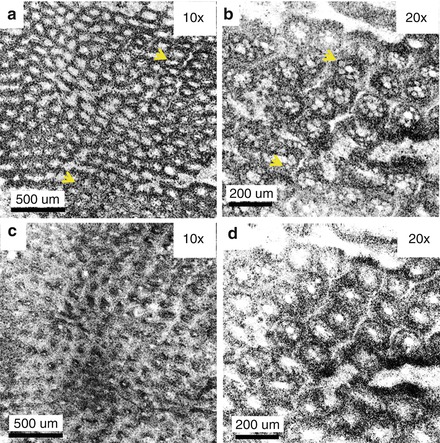
Fig. 28.9
Comparison of OCM and confocal images of human colon. OCM images at 10× (a) and 20× magnification (b) exhibit high contrast and high resolution compared to the confocal images at similar magnification 10× (c) and 20× (d). Confocal images were formed from summing over all depths in a volumetric OCM image acquired using Fourier domain OCM (Images reproduced from Ahsen et al. [82])
An added advantage of OCM using lower NA lenses with lower magnification is the ability to achieve larger fields of view, large depth of field and longer working distance compared with confocal microscopy. Improved field of view allows the user to survey larger regions of tissue and helps to provide context to the microscopic features visualized with OCM. Furthermore, the larger confocal axial resolution affords the possibility of acquiring multiple depth sections around the location of the focal plane. This may be useful for applications such as characterizing the three dimensional shape and size of cells in a particular tissue layer. This type of imaging cannot be performed with confocal microscopy without translating the focus.
28.6 Technology for OCM
Cellular imaging with OCM comes at the cost of increased system complexity compared with conventional OCT as well as confocal microscopy. System designs must incorporate the core features of a confocal microscope, including a two-axis scanner and reasonably high NA lens, in addition to the heterodyne interferometer and detection electronics necessary in OCT. To achieve ultrahigh coherence axial resolutions, very broadband light sources must be used. Furthermore, optical interferometer and microscope designs capable of supporting these large spectral bandwidths must be developed. For in vivo imaging, the imaging speed is also a critical parameter. Visualization of cellular and subcellular features requires sufficient speed to eliminate motion artifacts and transverse blurring. Based on work with confocal microscopy, a speed of ∼8 frames per second is desirable, even with the use of contact tissue stabilization schemes [4]. This necessitates fast raster scanning and either high speed phase modulation methods in the time domain or ultrahigh speed axial rate systems in the Fourier domain. High speed imaging also requires high power light sources to overcome signal loss due to reduced pixel dwell times. At near-infrared wavelengths, permissible tissue exposures for high speed imaging are in the range of 10–20 mW. Including coupler loss and optical transmission loss, typical system throughput can be quite low, however, and this can substantially increase the light source output power requirements to obtain sufficient tissue illumination. Finally, an OCM system must have some mechanism to ensure overlap of the confocal and coherence gates in scattering tissue. This section reviews progress on technology for OCM that will enable high speed in vivo imaging.
28.6.1 Broadband Light Sources
Light source requirements for OCM essentially parallel the requirements for OCT. Near infrared wavelengths between 800 and 1,300 nm are desirable to take advantage of lower absorption and scattering in tissue compared with visible wavelengths. Within this range, the shorter wavelengths near 800 nm provide increased contrast and better resolution for a fixed optical bandwidth compared with the longer wavelengths near 1,300 nm. Nonetheless, the increased penetration depth at longer near infrared wavelengths is attractive for imaging below the surface in scattering tissues. For time-domain or spectral/Fourier domain implementations of OCM, broadband superluminescent diode light sources or modelocked femtosecond solid state lasers are utilized. Superluminescent diode light sources have typical bandwidths in the range of 40–80 nm and output powers between 1 and 20 mW. Figure 28.10a presents a measured spectrum from a typical superluminescent diode at 1,300 nm. The coherence gate can be computed from the autocorrelation of the spectrum and has a width of 13.5 um, as shown in Fig. 28.10b. Superluminescent diodes offer compact, stable, turnkey solutions and have been widely applied in clinical studies with OCT. Femtosecond lasers have enabled ultrahigh resolution OCT with coherence gates of less than 5 um. These systems offer superior performance in terms of bandwidth and output power compared with the SLD’s, but they are typically expensive as well as complex to build and operate. The use of supercontinuum generation in highly nonlinear fibers has enabled the application of commercially available femtosecond lasers for OCT. Such commercial laser sources can be made highly stable and compact, compared with research prototypes, which allows the development of portable systems for clinical investigations outside of the research laboratory. Figure 28.10c, d present the measured spectrum and the computed coherence gate for a laser light source of this type [83]. Using a compact Nd: Glass oscillator coupled into a Germanium-doped, high numerical aperture, nonlinear fiber, an optical spectrum of over 200 nm centered at 1,060 nm was generated using self phase modulation nonlinearity. This enables resolutions of ∼3 um in air. Moreover, the average power was >100 mW, enabling high speed imaging. The wavelength range around 1,060 nm is compelling for use in scattering tissues because it offers both increased penetration compared with the 800 nm region and improved resolution compared with 1,300 nm. Some studies suggest that this wavelength window is an optimum choice for ultrahigh resolution imaging [84], and continuous wave lasers around 1,060 nm have been extensively used for confocal imaging [4, 85]. Fully-integrated, turn-key supercontinuum generation systems utilizing photonic crystal fibers are also now available and have been used by several groups for optical coherence imaging [43, 86].