Fig. 57.1
Fast RNFL fundus image
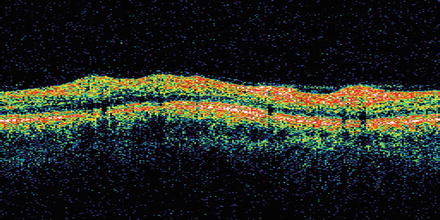
Fig. 57.2
RNFL cross-sectional image
Fig. 57.3
RNFL sectoral thickness analysis
Fig. 57.4
RNFL thickness profile
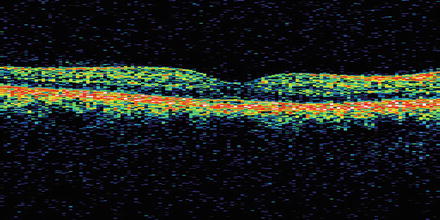
Fig. 57.5
Macula cross-sectional image
Fig. 57.6
Macula retinal thickness map
SD-OCT (Cirrus HD-OCT; Carl Zeiss Meditec, Dublin, CA, USA) imaging of the same healthy eye (Figs. 57.7, 57.8, 57.9, 57.10, 57.11, 57.12, 57.13, 57.14, 57.15, and 57.16) includes this circumpapillary cross section reconstructed from the 3-dimensional scan (Fig. 57.7). The RNFL thickness profile and thickness values of sectors and quadrants (Figs. 57.8 and 57.9) are all within the normal range. The peripapillary RNFL thickness map (Fig. 57.10) demonstrates the normal thickening adjacent to the superior and inferior poles of the optic nerve head with thinning of the RNFL at the nasal and temporal aspects. The en face image of the peripapillary region (Fig. 57.11) shows the sampling location of the circular scan with a diameter of 3.4 mm (purple) along with the automatically defined optic nerve head (black) and cup margins (red). RNFL thickness is compared with population-derived thickness measurements, and areas of borderline deviation are marked with yellow coloring. The rim thickness is normal and the yellow spots are minimal far from the disc margin. The thickness map of the macula (Fig. 57.12) and the vertical cross-sectional image (Fig. 57.13) display normal configuration of the macular region. The macular cube ganglion cell analysis (Figs. 57.14, 57.15, and 57.16) shows normal macula thickness with a localized borderline region at the nasal aspect of the macula by the thickness map (Fig. 57.14), deviation from normal map (Fig. 57.15), and sector measurements (Fig. 57.16). The one yellow sector in Fig. 57.16 corresponds to the few yellow/red spots in Fig. 57.15.
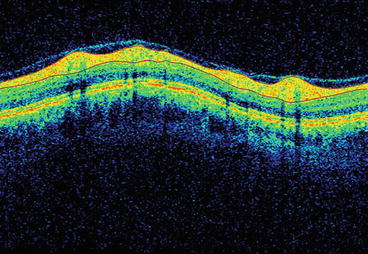
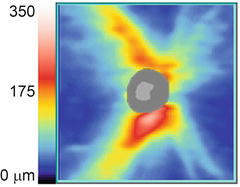
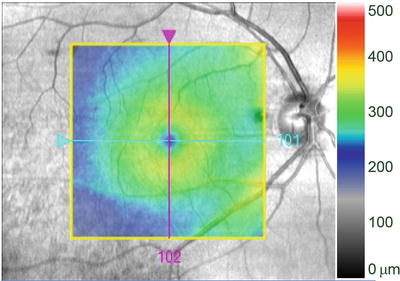
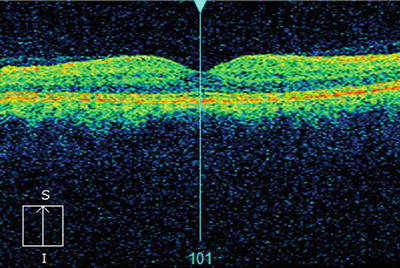
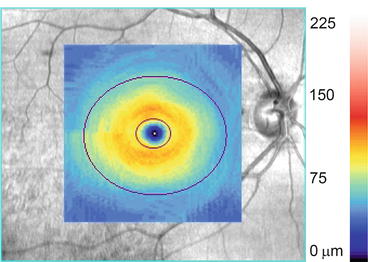
Fig. 57.7
Optic disc cube scan circumpapillary RNFL cross-sectional image
Fig. 57.8
RNFL thickness profile
Fig. 57.9
RNFL quadrants and sectors
Fig. 57.10
RNFL thickness map
Fig. 57.11
RNFL deviation map on en face image with ONH disc and cup margins
Fig. 57.12
Macula cube thickness analysis on LSO image
Fig. 57.13
Macula vertical cross-sectional image
Fig. 57.14
Macula ganglion cell analysis thickness map
Fig. 57.15
Macula ganglion cell analysis deviation map
Fig. 57.16
Macula ganglion cell analysis sectors
Another SD-OCT device (Spectralis; Heidelberg Engineering, Heidelberg, Germany), employing eye motion tracking and image averaging while scanning the same healthy eye, also shows a normal retinal thickness and ONH cupping with the linear scan (Fig. 57.17) and circular scan (Fig. 57.18). For both scans, the left side of the figure is a scanning laser ophthalmoscopy image overlaid with the OCT scan location (green). Note the highly detailed cross-sectional images.
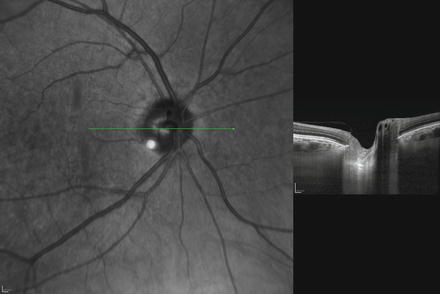
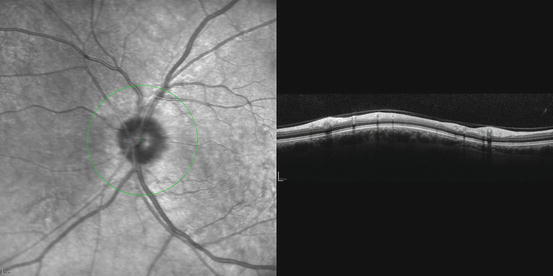
Fig. 57.17
Infrared CSLO image of ONH (Left) and SD-OCT line scan across ONH (Right)
Fig. 57.18
Infrared CSLO image of ONH (Left) and SD-OCT circle scan around ONH (Right)
A third SD-OCT device (RTVue; Optovue, Fremont, CA, USA) also shows a normal RNFL thickness (Figs. 57.19, 57.20, 57.21, 57.22, and 57.23) when scanning the same healthy eye. Figure 57.19 displays the circumpapillary retinal cross section with delineation of the RNFL margins and the retinal pigment epithelium (all white lines). The ONH analysis (Fig. 57.20) provides the thickness map of the peripapillary region surrounded with the ring of sectoral measurements with the comparison with population-derived normal thickness. The RNFL thickness profile around the optic nerve head (Fig. 57.21) shows a normal profile with a small localized superonasal location with borderline RNFL thickness. The macula analysis (Fig. 57.22) indicates thickness values within the normal limits with a vertical cross section (Fig. 57.23) showing similar retinal thickness when comparing corresponding locations superior and inferior to the fovea.
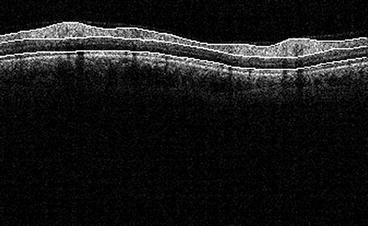
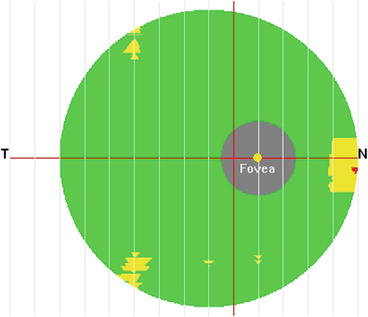
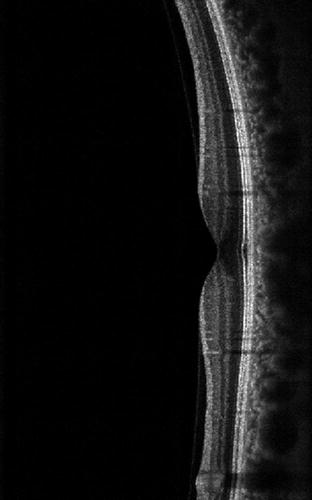
Fig. 57.19
Circumpapillary RNFL cross-sectional image
Fig. 57.20
ONH analysis
Fig. 57.21
Circumpapillary RNFL thickness analysis
Fig. 57.22
Macula ganglion cell complex thickness significance map
Fig. 57.23
Macula cross line image
57.6.2 Case 2: Early Glaucoma Eye
The left eye of a 52-year-old female demonstrated RNFL thinning as detected by TD-OCT (Stratus) imaging (Figs. 57.24, 57.25, 57.26, 57.27, and 57.28). Figure 57.24 displays the circumpapillary RNFL cross section. Analysis of the sectors, quadrants, and RNFL thickness profile (Figs. 57.25 and 57.26) shows mostly normal RNFL thickness measurements, except for thinning in the temporal inferior region. The vertical macula cross section shows thinning of the RNFL layer (upper red band) in the inferior macula (left side of the figure) (Fig. 57.27). The macula retinal thickness map (Fig. 57.28) shows thinning of the inferior macula marked by the blue color with attenuation of the perifoveal thickening in the same region.
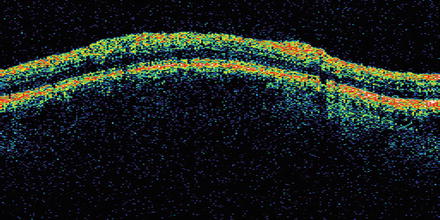
Fig. 57.24
RNFL cross-sectional image