Chapter 47 Nonproliferative Diabetic Retinopathy and Diabetic Macular Edema
This chapter discusses the clinical manifestations and management of NPDR and diabetic macular edema (DME). Chapter 48 reviews proliferative diabetic retinopathy (PDR).
Natural course of nonproliferative diabetic retinopathy
Diabetes mellitus without retinopathy
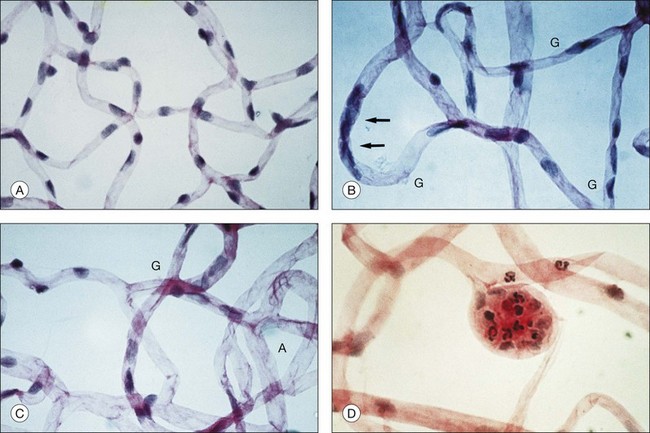
Retinal microvascular alterations visible on ophthalmoscopy typically develop years following the onset of DM. Chapter 46 (Diabetic retinopathy: Genetics and etiologic mechanisms) reviews what we know about the early biochemical and cellular alterations leading to diabetic retinopathy, while Chapter 45 (The epidemiology of diabetic retinopathy) discusses the incidence and prevalence of retinopathy among diabetics. Experimental models of diabetic retinopathy in dogs and rats, and studies of human autopsy eyes, indicate that early alterations in retinal blood vessels include the loss of capillary pericytes (Fig. 47.1) and thickening of the capillary basement membrane.1–21
There is preliminary evidence that parenchymal cells of the retina exhibit changes in the early stages of disease, including glial cell reactivity, alterations in glutamate metabolism, and neuron cell death.22–28 Several studies have documented subtle changes in contrast sensitivity and color perception in diabetics in the absence of visible retinopathy,29–34 but it remains unclear whether these effects result from deficits in retinal function, or from other diabetic alterations such as cataractogenesis. Central vision (measured by visual acuity) and peripheral vision (measured by common perimetric tests) typically remain normal in DM prior to onset of clinically evident retinopathy, in the absence of other factors such as cataract.
Microaneurysms
Microaneurysms arise as hypercellular saccular outpouchings of the capillary wall that can be well visualized in trypsin-digest retinal mounts (see Fig. 47.1D).1 Their lumina are sometimes occluded by agglutinated erythrocytes or thrombus. Over time they sometimes become acellular, just as damaged retinal capillaries can evolve into “ghost” vessels devoid of endothelial cells and pericytes. The mechanism for microaneurysm formation is unknown. Possible contributing factors may include alterations in the retinal microenvironment from metabolic effects on neurons, glial cells, and endothelial cells; endothelial cell injury secondary to leukostasis from altered interaction between endothelial cells and leukocytes; response of endothelial cells to altered balance between proliferative and antiproliferative factors; structural changes in the capillary wall (such as from loss of pericytes); or increase in intraluminal pressure.
Microaneurysms visualized by ophthalmoscopy or angiography commonly appear and disappear over time, though some retain a stable appearance for years. The presence of microaneurysms alone, in the absence of other features of diabetic retinopathy, remains compatible with normal vision. However, as the number of microaneurysms increases, there is a greater risk of retinopathy progression.35–37
Retinal vascular hyperpermeability
Subtle compromise of the blood–retinal barrier may begin at an early stage of disease, even preceding the appearance of retinopathy, but clinically appreciable retinal vascular hyperpermeability typically follows the appearance of microaneurysms. Visualized clinically by angiography, leakage may arise from microaneurysms, retinal capillaries, or other microvascular abnormalities, and can be highly variable in magnitude and extent. Retinal vascular incompetence may or may not result in localized areas of thickening of the retina. Hard exudates, extravascular deposits of lipid-rich material that result from spillage and incomplete resorption of plasma lipoproteins, may accumulate. Intraretinal hemorrhages appear in the posterior pole and in the retinal periphery. The vascular alterations responsible for hyperpermeability in NPDR remain incompletely understood, but may involve dysfunction of the tight junctions between retinal capillary endothelial cells. Possible mechanisms for breakdown of the blood–retinal barrier are discussed in Chapter 27 (Blood–retinal barrier, immune privilege, and autoimmunity).
Diabetic macular edema
The pathogenesis of DME remains poorly understood, partly because of the absence of a good animal model. Chapter 46 (Diabetic retinopathy: Genetics and etiologic mechanisms) reviews what we know about the early biochemical and cellular alterations leading to DME, while Chapter 28 (Mechanism of macular edema) discusses factors involved in the pathogenesis of macular edema of different causes.
Extrafoveal foci of retinal thickening and hard exudates may not cause symptoms or affect visual acuity, but DME that involves or threatens the center of the macula carries a significant risk of vision loss. In the Early Treatment of Diabetic Retinopathy Study (ETDRS), the 3-year risk of moderate visual loss (a decrease of three lines or more on a logarithmic visual acuity chart, corresponding to a doubling of the initial visual angle) among untreated eyes with DME involving or threatening the center of the macula was 32%.38 The natural history of DME is variable. In some eyes, it can persist for years, while in others it may spontaneously resolve. Chapter 45 (The epidemiology of diabetic retinopathy) discusses the incidence and prevalence of DME and consequent vision loss.
Capillary closure, microvascular remodeling, and retinal ischemia
One of the most serious consequences of diabetic retinopathy is progressive loss of functional retinal capillaries. Trypsin-digest preparations of the retina show areas of acellular capillaries, or “ghost” vessels, which have lost the endothelial cells and pericytes that once lined them (see Fig. 47.1C). When patches of such acellular capillaries, first seen early in the course of NPDR, increase and become confluent, the terminal arterioles that supply these capillaries often become occluded. Regions of acellular capillaries in histologic sections have been shown to correspond to areas of capillary nonperfusion visualized by fluorescein angiography.39 Adjacent to these areas of retinal ischemia, clusters of microaneurysms and hypercellular vessels often develop. It has been difficult to determine whether such vessels represent altered pre-existing capillaries or neovascularization within the retina. Such vessels are described clinically as intraretinal microvascular abnormalities (IRMA), a term intended to accommodate both possibilities.
Progressive capillary closure and resulting retinal ischemia are commonly associated with increasing IRMA, intraretinal hemorrhages, and venous abnormalities such as segmental dilation (venous beading). Occasionally, in cases of extensive capillary nonperfusion, the retina acquires a featureless appearance with a relative dearth of visible vessels, hemorrhages, or microvascular abnormalities. Retinal ischemia represents another cause for vision loss in NPDR, and also plays a central role in the pathogenesis of PDR by stimulating elaboration of vascular endothelial growth factor A (VEGF-A) and other factors promoting the growth of extraretinal neovascularization.40–47 Chapter 48 (Proliferative diabetic retinopathy) discusses the natural course of PDR.
Alterations of the vitreous gel and vitreoretinal interface
The vitreous gel plays a key role in the fibrovascular proliferation of PDR, but it may also exert important effects at earlier stages of retinopathy. Epiretinal membrane formation, arising from liquefaction of the vitreous gel and consequent effects at the vitreoretinal interface, can occur with advancing age in otherwise healthy eyes but is more common in diabetic eyes.48–52 It has been hypothesized that liquefaction of the vitreous gel out of proportion to diminution of posterior vitreoretinal adhesion may underlie the pathophysiology of many vitreoretinal diseases,53 and observations at vitrectomy suggest that the posterior cortical vitreous is frequently more adherent to the retina in the setting of diabetic retinopathy. Studies have documented a number of biochemical changes to the vitreous gel in the setting of DM, including increased collagen fibril cross-linking, accumulation of advanced glycation end products that may augment vitreoretinal adhesion and incite retinal glial cell reactivity, and alterations in the concentration of various soluble proteins.54–58
The role of the vitreous gel in the pathophysiology of diabetic retinopathy may extend beyond its capacity to exert mechanical effects on the retina. For example, there is recent evidence that the vitreous may function as an important regulator of intraocular oxygen tension, a finding that could have important implications for diabetic retinopathy and other diseases involving retinal hypoxia.59,60
Clinical evaluation of nonproliferative diabetic retinopathy
Comprehensive evaluation of a patient with DM begins with identification of extraocular factors associated with risk of diabetic retinopathy and its progression. Such factors are presented briefly here and discussed in greater detail in Chapter 45 (The epidemiology of diabetic retinopathy). Pertinent medical history is sought from the patient, and supplemented by records from his or her primary care physician or endocrinologist as warranted.
Duration of diabetes mellitus
The duration of DM is strongly associated with risk of retinopathy. Cross-sectional and longitudinal analyses from population-based epidemiologic studies have established the association between prevalence of retinopathy and duration of disease.61–70 The Wisconsin Epidemiologic Study of Diabetic Retinopathy (WESDR) examined prevalence and severity of diabetic retinopathy among diabetics categorized into a younger-onset group consisting of those diagnosed with DM prior to 30 years of age who were taking insulin at the time of the evaluation (predominantly type 1 DM) and an older-onset group consisting of those diagnosed with DM at 30 years of age or older (predominantly type 2 DM), the latter subdivided according to whether insulin was being used at the time of evaluation. The prevalence of retinopathy may have changed somewhat since the 1980s when WESDR data was collected, given interim advances and evolving standards of care in management of DM, but the WESDR remains one of our most definitive sources of information about the epidemiology of diabetic retinopathy in the United States. In the younger-onset group, retinopathy (consisting of NPDR or PDR) was seen in 13% of those with less than a 5-year duration of DM and in 90% of those with a duration of 10–15 years.65 In the older-onset group using insulin, retinopathy was seen in 40% of those with less than a 5-year duration of disease and in 84% of those with a duration of 15–19 years, while the corresponding rates in the older-onset group not taking insulin were 24% and 53%, respectively.64
Among those with type 2 DM, in which disease onset is often more insidious than in type 1 DM and in which hyperglycemia can remain asymptomatic for years, age at diagnosis may not always accurately reflect disease duration. The Centers for Disease Control and Prevention estimate that 25.8 million people in the United States have DM, of whom 7.0 million do not know they have it.71 The prevalence of undiagnosed type 2 DM is felt to be the key factor explaining the higher rates of retinopathy noted soon after diagnosis among type 2 diabetics (24% in the older-onset group not taking insulin with less than a 5-year duration of disease in the WESDR) compared with type 1 diabetics (13% in the younger-onset group with less than a 5-year duration of disease).
Hyperglycemia
The relationship between the degree of hyperglycemia and the presence and severity of diabetic retinopathy has been extensively studied in observational studies and clinical trials. The observational studies have demonstrated that greater hyperglycemia is associated with increased prevalence and severity of diabetic retinopathy.62,64–67,69,70 Several key randomized controlled clinical trials have demonstrated that better glycemic control is associated with a decreased risk of secondary complications of DM, including diabetic retinopathy.72–79
In the Diabetes Control and Complications Trial (DCCT), 1441 participants with type 1 DM were randomly assigned to either conventional or more intensive insulin treatment and followed for a period of 4–9 years.72,73,76,79 The average difference in glycosylated hemoglobin (hemoglobin A1C [HbA1C]) between the two groups was almost 2%. Intensive insulin treatment as defined by the DCCT was associated with a decreased risk of both the development and progression of diabetic retinopathy. In patients without retinopathy at enrollment, the 3-year risk of developing retinopathy was reduced by 75% in the intensive insulin treatment group compared with the conventional treatment group. The benefit of better glycemic control was also evident in patients with existing retinopathy at baseline, as shown by a 50% reduction in the rate of progression of retinopathy compared with controls. At the 6- and 12-month visits, more intensive insulin treatment exerted a small adverse effect on retinopathy progression, similar to that described in other trials of glycemic control. However, among eyes with little or no retinopathy at the time of initiating better control of hyperglycemia, it was found that such “early worsening” of retinopathy was unlikely to threaten vision. When the DCCT results were stratified by levels of glycosylated hemoglobin, there was a 35–40% reduction in the risk of retinopathy progression for every 10% decrease in HbA1C (e.g., from 8% to 7.2%). This represented a fivefold increase in risk of progression for patients with HbA1C around 10% compared with those with HbA1C around 7%. Notably, there was also a statistically significant reduction in other microvascular complications of DM, including nephropathy and peripheral neuropathy, with more intensive glycemic control in the DCCT.
When the randomized controlled clinical trial was completed, DCCT participants were informed of the results and enrolled in a follow-up phase of the study, known as the Epidemiology of Diabetes Intervention and Complications (EDIC) study.76 After an additional 7 years of follow-up, during which the HbA1C values in both treatment groups did not differ significantly (8.1% vs 8.2%, P = 0.09), the rate of retinopathy progression remained significantly lower in those who had received more intensive treatment in the DCCT than in those who had received conventional therapy. Thus, more intensive glycemic control over a period of 6.5 years conferred benefits well beyond the period of treatment.
In the United Kingdom Prospective Diabetes Study (UKPDS), 3867 patients with newly diagnosed type 2 DM were randomly assigned to conventional therapy or to more intensive glycemic control with either insulin or a sulfonylurea.74,75 Among participants treated with conventional therapy, those who were overweight were given metformin and those who were not overweight did not receive this medication. After 12 years, the rate of retinopathy progression was reduced by 21% and the use of laser photocoagulation was reduced by 29% in those getting intensive glycemic control compared with those getting conventional treatment. For every percentage point decrease in HbA1C (e.g., 9% to 8%), there was a 35% reduction in the risk of microvascular complications of disease.
The results of the UKPDS have recently been corroborated by those of another large randomized controlled clinical trial, the Action to Control Cardiovascular Risk in Diabetes (ACCORD) study. The ACCORD study randomly assigned 10 251 patients with type 2 DM to very intensive glycemic control (targeting HbA1C less than 6%), or to standard treatment (targeting HbA1C between 7 and 7.9%). A subset of 2856 participants was evaluated for progression of retinopathy by comparison of fundus photographs taken at baseline and at 4 years.78 In this subset at one year, median HbA1C in the intensive treatment cohort was 6.4% compared with 7.5% in the cohort getting conventional therapy. In the intensive treatment group, the rate of retinopathy progression was 7.3%, compared with 10.4% in the standard therapy group (adjusted odds ratio, 0.67; 95% confidence interval [CI] 0.51–0.87; P = 0.003). The glycemia trial, performed alongside other studies evaluating control of blood pressure and plasma lipids, was halted early at a median of 3.7 years because of an increased rate of death from all causes in participants treated with intensive control compared with those managed with standard control (5% vs 4%, respectively), and the very intensive control approach was abandoned.
Hypertension
In addition to assessing the effects of differential glycemic control, the UKPDS provided a randomized comparison between more intensive blood pressure control (targeting a systolic blood pressure less than 150 mmHg) and less intensive blood pressure control (targeting a systolic blood pressure less than 180 mmHg) in a large cohort of participants with newly diagnosed type 2 DM.80 Study results demonstrated that intensive blood pressure control was associated with a decreased risk of retinopathy progression. Of 1148 hypertensive participants in the UKPDS, 758 were allocated to more intensive control of blood pressure and 390 to less intensive control with a median follow-up of 8.4 years. More intensive blood pressure control resulted in a 37% reduction in microvascular complications of DM, predominantly a reduced risk of retinal photocoagulation, compared with less intensive control. An earlier report assessing the effects of various blood pressure medications on diabetic retinopathy had suggested that there might be a specific benefit of angiotensin-converting enzyme (ACE) inhibition, even in normotensive persons. The UKPDS included a randomized comparison of beta-blockers and ACE inhibitors within the more intensive blood pressure control arm. Benefit from more intensive blood pressure control was noted in both the beta-blocker and ACE inhibitor treatment groups, with no statistically significant difference between them, suggesting that the treatment effect was probably attributable to blood pressure reduction and not to a specific effect of ACE inhibition.
The ACCORD study attempted to extend the results of the UKPDS by assessing the effect of very tight blood pressure control on retinopathy. In this study, 4733 of the 10 251 participants with type 2 DM were randomly assigned to very intensive control of blood pressure (targeting a systolic blood pressure less than 120 mmHg) or standard blood pressure control (targeting a systolic blood pressure less than 140 mmHg). A subset of 1263 participants in the blood pressure trial was evaluated for progression of retinopathy just as in the glycemia arm of the study, with comparison of fundus photographs at baseline and 4 years.78 Rate of progression of retinopathy was not significantly different in the two groups (10.4% of those treated intensively compared with 8.8% of those treated with standard care, with an adjusted odds ratio of 1.23; 95% CI 0.84–1.79; P = 0.29). The results of the UKPDS and ACCORD study are not necessarily contradictory in this regard, given the very different targets used for more and less intensive control of blood pressure between the two trials.
Dyslipidemia
Elevated levels of plasma cholesterol were associated with greater severity of retinal hard exudates in the WESDR and in the ETRDS.81,82 Independent of coincident retinal thickening, the severity of retinal hard exudates at baseline was associated with decreased visual acuity in the ETDRS. The severity of retinal hard exudates was also a significant risk factor for moderate visual loss during the course of the study. Elevated levels of plasma triglycerides were associated with a greater risk of developing high-risk PDR in the ETDRS patients.83 Two recent randomized controlled clinical trials evaluating the plasma lipid-modulatory agent fenofibrate in combination with statins in individuals with elevated plasma lipids have demonstrated that fenofibrate reduces the risk of diabetic retinopathy progression while only providing modest alterations in the plasma lipid profile.78,84 It is presently uncertain whether the effects of fenofibrate on diabetic retinopathy are secondary to its plasma lipid-modulatory activity or to some other mechanism.
Other extraocular factors
Diabetic retinopathy can worsen precipitously in the setting of pregnancy. Chapter 92 (Pregnancy-related diseases) reviews the natural history of retinopathy in pregnancy. Diabetic nephropathy, as measured by albuminuria, proteinuria, or manifestations of renal failure, has been inconsistently associated with progression of retinopathy.83,85,86 Anemia has been associated with progression of diabetic retinopathy in two small case series and two epidemiologic studies.83,87–89 The ETDRS found association between decrease in hematocrit and increase in the incidence of high-risk PDR in an adjusted multivariate model. A few reports have suggested an association between diabetic neuropathy or cardiovascular autonomic neuropathy and progression of retinopathy.83,90,91 Significant progress has been made in understanding the heritable contributions to the development of DM, particularly the type 1 form and certain familial and syndromic variants of the disease, but the identification of genetic risk factors for development and progression of diabetic retinopathy has been challenging. Chapter 46 (Diabetic retinopathy: Genetics and etiologic mechanisms) reviews our present knowledge about the genetics of diabetic retinopathy.
Ophthalmic evaluation
A comprehensive eye examination in a person with DM includes: measurement of visual acuity and intraocular pressure; evaluation of the anterior segment by slit-lamp biomicroscopy; gonioscopy when warranted (such as in the setting of elevated intraocular pressure, neovascularization of the iris, or glaucoma); and dilated funduscopic examination.92 Evaluation of the anterior segment prior to dilation of the pupil may allow visualization of neovascularization of the iris or anterior chamber angle not visible following mydriasis. Dilation of the pupil is important for adequate assessment of the posterior segment. In the absence of pupil dilation, only 50% of eyes are correctly diagnosed for the presence and severity of retinopathy.93
Ancillary ocular imaging
Fundus photography
Fundus photography is a valuable clinical tool for evaluating progression of retinopathy in individual patients and in participants in clinical trials. Photography is used in clinical practice to document the status of retinopathy and effects of treatment. Though not always as sensitive as ophthalmoscopy at detecting subtle features of diabetic retinopathy such as IRMA and early extraretinal neovascularization, photography can be useful in documenting certain findings in select patients. For example, it can be used to record the extent and distribution of hard exudates in DME, the extent of retinal alterations in severe NPDR, and the appearance of laser photocoagulation burns. Chapter 48 (Proliferative diabetic retinopathy) discusses its role in documenting the extent and characteristics of neovascularization, fibrous proliferation, and retinal traction. The development of digital systems capable of high-resolution images immediately accessible to the clinician has expanded the role of fundus photography in clinical practice, facilitating record-keeping, information-sharing among providers, and use of images as a teaching tool with patients.
Fluorescein angiography
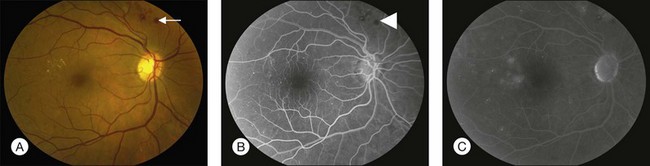
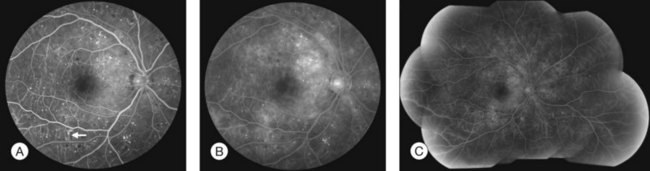
Fluorescein angiography (FA), consisting of photography or videography of the fundus using cameras equipped with appropriate filters following intravenous injection of the hydrocarbon dye fluorescein sodium, has been used clinically in ophthalmology for over 40 years and is described in detail in Chapter 1 (Fluorescein angiography). FA has multiple uses in the clinical evaluation of diabetic retinopathy. Because intravenous injection of fluorescein sodium can be associated with life-threatening adverse reactions (with risk of death estimated at approximately 1/200 000),94 FA for evaluation of diabetic retinopathy is largely confined to settings in which important aspects of management hinge on the results of the test. FA has been used extensively for evaluation of diabetic retinopathy, and is not known to pose any special hazards in DM. Nephropathy or renal failure is not a contraindication to testing.95 In NPDR, FA is most commonly indicated for further characterization of DME diagnosed on ophthalmoscopy (Fig. 47.2), and its utility in this setting is discussed below in the section “Clinical evaluation of diabetic macular edema.”
Commonly used grading systems for severity of diabetic retinopathy do not consider findings on FA, and FA is not indicated for classification of disease. While FA is a sensitive means for detection of early features of NPDR such as microaneurysms and retinal capillary hyperpermeability, it is not clinically indicated to screen for mild retinopathy.92
Optical coherence tomography
Optical coherence tomography (OCT), which utilizes low-coherence interferometry involving near-infrared light for cross-sectional imaging of intraocular structures, has emerged over the last decade as a fast, noninvasive means of imaging the retina, vitreoretinal interface, and the retinal pigment epithelium (RPE) in NPDR and other macular diseases. The basic principles of OCT and the applications of this technology to evaluation of the retina are discussed in Chapter 3 (Optical coherence tomography). In NPDR, OCT is commonly used to characterize DME (Fig. 47.3) and abnormalities of the vitreoretinal interface.
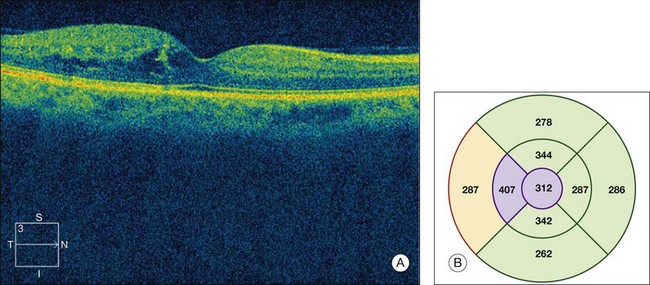
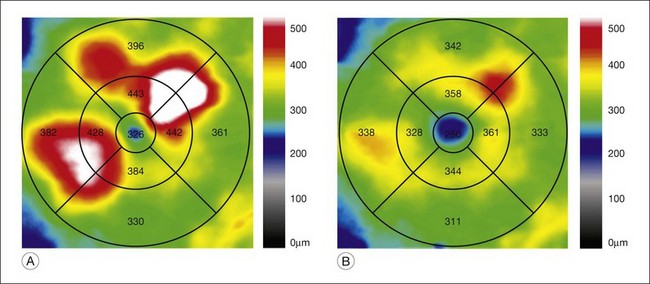
Fig. 47.3 OCT characterization of macular thickening in NPDR and DME. (A) A 6 mm horizontal line scan obtained with a spectral domain OCT system (Cirrus, Carl Zeiss Meditec, Dublin, CA) imaging the macula of the eye illustrated in Fig. 47.2 shows mild retinal thickening temporally, corresponding to the area of microaneurysms leaking on FA. (B) The retinal thickness map generated by automated segmentation of a 6×6 mm 512×128 Macular Cube scan shows mean thickness values for nine standard subfields. Mean thickness is greater than in 99% of normals in the central and inner temporal subfields (shaded purple) and greater than in 95% of normals in the outer temporal subfield (shaded red), based on a comparison to data in the Cirrus normative database.
(National Eye Institute, Bethesda, MD.)
Investigators of the Diabetic Retinopathy Clinical Research Network (DRCR.net),96 a collaborative network of over 100 sites in the United States dedicated to multicenter clinical research of diabetic retinopathy, have rigorously evaluated OCT as a test yielding measures of macular thickness in diabetic eyes. The standardization required for DRCR.net clinical trials has necessitated use of a common OCT platform and scanning technique. OCT scanning in DRCR.net studies to date involves acquisition of images of the macula by certified operators after pupil dilation, with use of a time-domain system called the Stratus OCT (Carl Zeiss Meditec, Inc., Dublin, CA) and a scanning algorithm known as the fast macular thickness map, which obtains 128 axial scans (A scans) along each of six radial lines (each 6 mm in length) intersecting at a common center, with a total scan time of 1.9 seconds. Stratus processing software includes an automated segmentation algorithm that identifies an inner and outer retinal border on line scans and calculates retinal thickness. A retinal thickness map is generated using data from all line scans obtained by the scanning algorithm. Output includes center-point thickness, total macular volume, and mean values for retinal thickness in a grid comprised of a central subfield, four inner subfields, and four outer subfields. Assessment of the quality of output depends on assessment of other parameters such as signal strength and standard deviation of center-point thickness. Software offers a comparison of thickness values to those from a normative database of measurements obtained from normal individuals.
DRCR.net investigators compared central subfield mean thickness (CSMT) values in 97 diabetics with minimal or no retinopathy and no central macular thickening on examination to normal values for nondiabetics in the Stratus OCT database.97 Results showed no significant difference between CSMT of diabetic eyes with minimal or no retinopathy and normal values imputed from nondiabetic individuals in the database, suggesting that the presence of DM is not associated with clinically important changes in CSMT in the absence of retinopathy. The study noted a statistically significant difference between CSMT in men and women, similar to findings in other reports.
DRCR.net investigators evaluated the reproducibility of OCT in eyes with DME, and established thresholds indicative of meaningful change in retinal thickness. In a prospective multicenter one-day study evaluating diurnal variation of DME, 212 eyes of 107 participants with DME involving the foveal center on biomicroscopy and CSMT of 225 microns or greater were imaged multiple times on Stratus OCT and the scans were evaluated by a reading center.98 Both eyes were imaged six times during the day, and at each of these six sittings a pair of scans was generated, with repeat imaging done for scans of suboptimal quality. Of a possible 1284 pairs, 1223 were analyzed. Reproducibility was better for CSMT than for center-point thickness, not surprising considering that CSMT incorporates more data points. The median absolute difference between replicate measurements of CSMT was 7 µm. Expressed as a percentage difference between the two measurements, the half-width of the 95% CI for a change in retinal thickness for CSMT was 10% for eyes with CSMT less than 400 µm, and 13% for eyes with CSMT equal to or greater than 400µm. The authors concluded that a change in CSMT greater than 11% using the Stratus OCT for DME is likely to be real.
The rapid pace of technological progress, resulting in recent improvements such as spectral domain imaging and image-registration capability in some systems, makes for substantial variability in image acquisition, processing, and output metrics among presently available OCT platforms. For example, the spectral domain Cirrus OCT (Carl Zeiss Meditec, Dublin, CA), though its output is similar in many ways to that of the time domain Stratus OCT, uses a distinct automated segmentation algorithm that results in retinal thickness values that are approximately 30–55µm greater than those reported by the Stratus OCT in eyes with DME.99 Meaningful interpretation of an OCT scan requires familiarity with the system utilized, including understanding of scan acquisition, indicators of scan quality, processing of raw data, algorithms for automated segmentation, and format of output metrics, as well as knowledge of any normative database used by system software to compare a given set of measurements to a normal range. Caution is warranted in comparing OCT scans obtained using different systems, and clinical researchers using OCT must grapple with such issues in planning studies that require standardization of procedures among clinical sites. The DRCR.net is presently evaluating issues related to integrating new OCT systems into future research studies.
Funduscopic lesions of nonproliferative diabetic retinopathy
Small or nonperfused microaneurysms may not be discernible on ophthalmoscopy, but those that are visible appear as small deep-red dots between 25 and 100µm in diameter within the retina (see Figs 47.2A, 47.4). Microaneurysms in NPDR typically arise in the posterior pole, but they can also be present in the midperipheral and peripheral retina, particularly in more severe retinopathy. They may be solitary or may appear in clusters. They may remain stable across months or even years, but many appear and eventually disappear. On FA, microaneurysms are visible during arteriovenous transit as hyperfluorescent dots within the retina (see Fig. 47.2B). This hyperfluorescence typically persists in later phases of the angiogram, and may or may not be associated with leakage in mid- and late frames (see Fig. 47.2C). FA is a sensitive means of detecting microaneurysms, and may reveal lesions that were poorly visible or not visible on ophthalmoscopy.
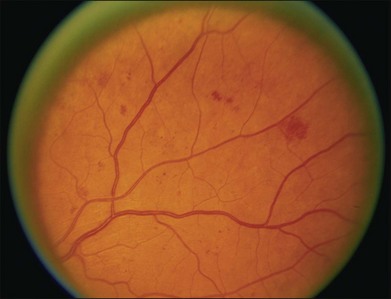
Intraretinal hemorrhages in NPDR are variable in appearance, just as in other retinal diseases (Figs 47.2A, 47.4). Dot-blot hemorrhages are typically small with sharply demarcated borders, and are sometimes indistinguishable from microaneurysms on ophthalmoscopy. Flame hemorrhages can be larger, and manifest wispy margins as a consequence of their location in the nerve fiber layer. Intraretinal hemorrhages appear hypofluorescent on FA, blocking normal fluorescence from the underlying choroid, and consequently FA offers ready distinction between microaneurysms and hemorrhages (Fig. 47.2B). Intraretinal hemorrhages can be present in the posterior pole and in more peripheral retina, and frequently appear and disappear over weeks or months. Hemorrhages on the optic disc are not typical for diabetic retinopathy, and should raise suspicion for neovascularization or a comorbid condition affecting the optic nerve head. Variability in the density of hemorrhages between one sector of the retina and another is common, but striking asymmetry sometimes suggests a superimposed process such as a branch retinal vein occlusion.
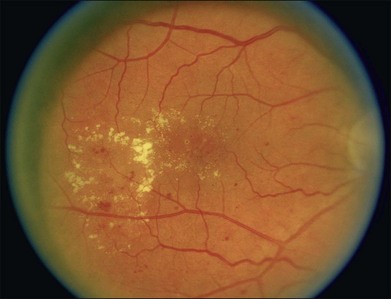
Hard exudates are visible on ophthalmoscopy as sharply demarcated yellow-white deposits within the retina (Figs 47.2A, 47.5). They are visible on OCT line scans as hyperreflective foci within the retina. With stereoscopic viewing they are readily distinguishable from drusen, which reside external to the retina. Hard exudates are often distributed at the border between edematous and nonedematous retina. They may form a circinate ring around areas of prominent vascular hyperpermeability such as a cluster of microaneurysms. They tend to form in the posterior pole in association with macular thickening, but small collections are sometimes present in more peripheral retina. They are hypofluorescent on FA, blocking underlying choroidal fluorescence (see Fig. 47.2B). Hard exudates may appear and disappear over months or years. When severe, they may undergo organization and may cause subretinal fibrosis.
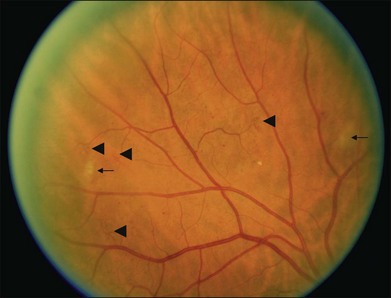
Cotton-wool spots, patches of relative ischemia affecting the nerve fiber layer of the retina, are visible on ophthalmoscopy as small white patches with wispy borders situated in the inner retina (Fig. 47.6). They are hypofluorescent on FA, blocking underlying choroidal fluorescence. They commonly appear and disappear over weeks or months.
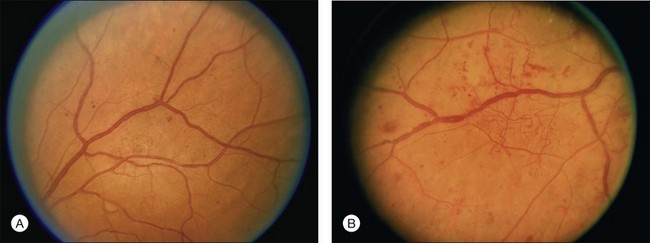
The major retinal vessels can exhibit changes in appearance in the setting of advanced retinopathy. Arterioles may appear thin or white. Venules may appear dilated and tortuous. Venous loops are occasionally present. Venous beading consists of localized areas of change in vessel caliber, visible as alternating regions of relative dilation and constriction (Fig. 47.7).
Intraretinal microvascular abnormalities (IRMA) appear as segments of dilated and tortuous retinal vasculature amidst retinal vessels that are normally too small to be visible on ophthalmoscopy (see Fig. 47.6). They are usually readily distinguishable from extraretinal neovascularization on careful biomicroscopy. On FA they appear hyperfluorescent during the arteriovenous transit phase, may leak in later phases, and are often situated at the borders of areas of capillary nonperfusion. They may persist for months or years.
Classification of diabetic retinopathy
The Diabetic Retinopathy Study, a landmark clinical trial that established the efficacy of scatter laser photocoagulation for reduction of severe vision loss secondary to PDR, used an adaptation of the Airlie House classification of diabetic retinopathy originally developed in 1968.100 This modified Airlie House system was extended for grading severity of retinopathy in the ETDRS.101 Grading of retinopathy in the ETDRS involved evaluation of seven-field 30-degree nonsimultaneous stereo color fundus photographs by trained readers. Over 30 characteristics were separately graded, using standard photographs to define thresholds for scoring (see Figs 47.4, 47.5, 47.6, 47.7 for some of the standard photographs utilized in the system), and a summary grade was assigned. The ETDRS diabetic retinopathy severity scale was evaluated for its reproducibility as part of the study and was validated as a grading system with prognostic power.101–103 ETDRS investigators assigned thresholds to define mild NPDR, moderate NPDR, severe NPDR, early PDR, and high-risk PDR (Box 47.1). The 5-year rates of development of high-risk PDR in eyes randomly assigned to deferral of photocoagulation (no laser treatment unless features of high-risk PDR developed) for eyes with mild, moderate, and severe NPDR at baseline were 15.5%, 26.5%, and 56%, respectively.
Box 47.1
Classification of diabetic retinopathy in the ETDRS
At least one microaneurysm, AND criteria not met for more severe retinopathy.
Hemorrhages/microaneurysms ≥ standard photograph 2A (Fig. 47.4); AND/OR cotton-wool spots, venous beading, or IRMA definitely present; AND criteria not met for more severe retinopathy
Cotton-wool spots, venous beading, and IRMA definitely present in at least two of photographic fields 4 to 7; OR two of the three preceding features present in at least two of fields 4 to 7 and hemorrhages/microaneurysms present in fields 4 to 7 ≥ standard photograph 2A (Fig. 47.4) in at least one of them; OR IRMA present in each of fields 4 to 7 and ≥ standard photograph 8A (Fig. 47.6) in at least two of them; AND criteria not met for more severe retinopathy.
New vessels; AND criteria not met for high-risk PDR.
New vessels on or within one disc diameter of the optic disc (neovascularization of the disc [NVD]) ≥ standard photograph 10A (approximately 1/4 to 1/3 disc area) with or without vitreous or preretinal hemorrhage; OR vitreous and/or preretinal hemorrhage accompanied by new vessels, either NVD < standard photograph 10A or new vessels elsewhere (NVE) ≥ 1/4 disc area.
Grading and classification of retinopathy in the ETDRS involved evaluation of modified Airlie House seven-field 30-degree non-simultaneous stereo color fundus photographs by trained readers. Photographic fields 4 and 6 image superior retina and are tangential to both a vertical line through the center of the optic disc and a horizontal line crossing its superior border. Photographic fields 5 and 7 image inferior retina and are tangential to both a vertical line through the center of the optic disc and a horizontal line crossing its inferior border. A set of standard photographs was used to define thresholds for grading and classification (see Figs 47.3, 47.4, 47.5, 47.6 for some of the standard photographs utilized in the system).
The prognostic utility of a 1-step or a 2-or-greater-step progression in the ETDRS diabetic retinopathy severity scale has been evaluated using data from the WESDR.104 Findings indicated that 1-step or 2-or-greater-step worsening in level of retinopathy over 4 years strongly predicted the development of PDR during the subsequent 6 years. The ETDRS diabetic retinopathy severity scale remains the standard for photographic grading of retinopathy in clinical trials. The schema is impractical for routine clinical use because of its complexity and its basis in photographic – not ophthalmoscopic – assessment of the fundus, but the ETDRS definitions for mild, moderate, and severe NPDR and early and high-risk PDR were incorporated into clinical practice. A 4–2–1 rule was popularized to simplify the definition of severe NPDR.105 Upon examination of the four midperipheral quadrants of the retina, the presence of any one of the following features was considered sufficient for diagnosis of severe NPDR (in the absence of evidence for PDR): (1) severe intraretinal hemorrhages and microaneurysms in all four quadrants (≥ standard photograph 2A [see Fig. 47.4]); (2) venous beading in two or more quadrants; or (3) moderate IRMA in at least one quadrant (≥ standard photograph 8A [see Fig. 47.6]). If any two of these features were present, the retinopathy was considered very severe. It is worth pointing out that the 4–2–1 rule uses a threshold for definition of severe NPDR inclusive of milder retinopathy than the definition of severe NPDR used in the ETDRS.
In answer to the need for a simplified classification of diabetic retinopathy to facilitate communication among clinicians worldwide, the Global Diabetic Retinopathy Project Group published proposed International Clinical Diabetic Retinopathy and Diabetic Macular Edema Severity Scales in 2003 (Table 47.1).106 The classification was developed using evidence from studies such as the ETDRS and WESDR to draw distinctions in retinopathy severity most important for prognosis and management, and approximates the definitions used in the ETDRS.
Table 47.1 Disease severity scales for diabetic retinopathy and diabetic macular edema
| Proposed disease severity level | Findings observable on dilated ophthalmoscopy |
|---|---|
| No apparent retinopathy | No abnormalities |
| Mild NPDR | Microaneurysms only |
| Moderate NPDR | More than just microaneurysms but less than severe NPDR |
| Severe NPDR | |
| PDR | |
| No apparent DME | No retinal thickening or hard exudates in the posterior pole |
| Mild DME | Some retinal thickening or hard exudates in the posterior pole, distant from the center of the macula |
| Moderate DME | Retinal thickening or hard exudates near the center of the macula but not involving the center |
| Severe DME | Retinal thickening or hard exudates involving the center of the macula |
DME is defined as retinal thickening, assessed by stereoscopic evaluation of the fundus by slit-lamp biomicroscopy or assessment of photographs. Hard exudates are a sign of present or past retinal thickening.
(Adapted with permission from Wilkinson CP, Ferris FL 3rd, Klein RE, et al. Proposed international clinical diabetic retinopathy and diabetic macular edema disease severity scales. Ophthalmology 2003;110:1677–82.)
Clinical evaluation of diabetic macular edema
Distribution of retinal thickening and hard exudates
The ETDRS defined clinically significant macular edema (CSME) as any of the following noted on biomicroscopy: (1) thickening of the retina at or within 500 µm of the center of the macula; (2) hard exudates at or within 500 µm of the center of the macula, if associated with thickening of the adjacent retina (not residual hard exudates remaining after the disappearance of retinal thickening); or (3) a zone or zones of retinal thickening one disc area or larger, any part of which is within one disc diameter of the center of the macula.38
The definition for CSME was based on observation that retinal thickening or hard exudation involving or threatening the fovea frequently leads to vision loss. Careful assessment of the distribution of retinal thickening and hard exudates and their relation to the center of the macula remains paramount to management of DME. Severity of DME in the International Clinical Diabetic Macular Edema Disease Severity Scale is based solely on whether retinal thickening and hard exudates involve or threaten the center of the macula, reflecting the importance of foveal involvement for prognosis and management.106
While diagnosis on biomicroscopic examination remains the clinical standard for detection of DME, OCT is increasingly used as a fast and noninvasive tool to quantitatively map areas of macular thickening (see Fig. 47.3). Subtle changes in distribution of thickening over time and relationship to the fovea can be documented with good-quality scans that serially image the same region of the macula (Fig. 47.8). The standardization afforded by OCT has proven valuable in clinical practice and in research. Hard exudates can be visualized on OCT as hyperreflective foci within the retina, but biomicroscopic examination and fundus photography remain important to document their extent and proximity to the fovea.
Magnitude of retinal thickening
The degree of thickening at any given point in the retina has traditionally been estimated on biomicroscopy and stereoscopic photographs, but OCT has recently emerged as a superior means of quantifying retinal thickness. The sensitivity of OCT for retinal thickening exceeds that of contact lens-assisted biomicroscopy performed by experienced examiners.107 Correlation between the estimated degree of retinal thickening at the center of the macula on stereoscopic photographs and the center-point thickness measured on time domain OCT is modest, reflecting the limitations of grading retinal thickness on photographs.108
OCT processing yields several metrics useful in characterizing the thickness of the retina in DME. For example, the Stratus OCT used by DRCR.net sites calculates a center-point thickness, CSMT, inner and outer subfield mean thicknesses, and macular volume for commonly used scanning algorithms. A DRCR.net study concluded that CSMT is well suited as a metric for central macular thickness in clinical research, with high reproducibility and good correlation to other metrics in the setting of DME.109 Mean thickness in other subfields and total macular volume are useful in assessing extrafoveal macular edema.
OCT is capable of detecting areas of subtle macular edema that are sometimes not suspected on ophthalmoscopy (Fig. 47.8B). Easy detection of such “subclinical” thickening has added a new and provocative facet to management of DME, challenging clinicians to incorporate knowledge of more mild pathology into clinical decision-making. Conversely, OCT can illustrate areas of retinal thinning that sometimes result from advanced retinopathy. Occasionally, the presence of mild macular edema in retina that would be thinner than normal in the absence of such edema can result in a retinal thickness that appears “normal” relative to typical thickness in diabetics without retinopathy. Such abnormal thickening of retina that would otherwise be abnormally thin can make it challenging to define what constitutes complete resolution of macular edema in some eyes.
Retinal microvascular alterations and vascular hyperpermeability
The retinal microvasculature and any areas of capillary nonperfusion are best imaged in the arteriovenous transit phase of the angiogram. Microaneurysms and microvascular abnormalities, sometimes unsuspected on ophthalmoscopy, are readily visualized (Fig. 47.2). The absence of normal hyperfluorescence from capillaries in a region where they should usually exist indicates capillary nonperfusion (Fig. 47.9). Areas of foveal capillary nonperfusion manifest as an abnormally large foveal avascular zone (FAZ) or as irregularity in the borders of the FAZ. Unfortunately, visualization of capillary nonperfusion requires resolution near the limit of present camera systems, and even slight decreases in image quality (such as from poor focus or cataract) can impair assessment. The retina in areas of capillary nonperfusion may be edematous, normal thickness, or thin.
Stay updated, free articles. Join our Telegram channel

Full access? Get Clinical Tree


