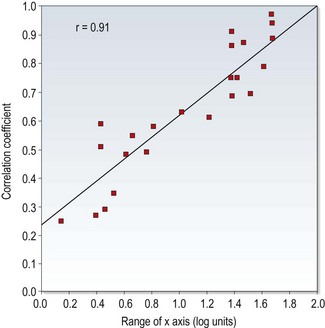
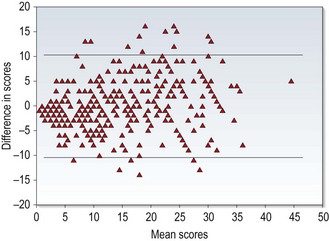
1 Evidence-based optometry means integrating individual clinical expertise with the best currently available evidence from the research literature.1 A significant amount of evidence-based eye care is associated with treatments and their effectiveness and this information is typically provided by the results from randomised controlled trials (RCTs) or the collation of results from several RCTs within systematic reviews and meta-analyses.2 However, the diagnostic tests and procedures used in optometric practice should also be evidence based and what should always be avoided is the use of exam procedures based on anecdotal evidence, tradition or habit. The research literature should be regularly reviewed. There may be reports of newly developed techniques or instruments that are superior to the ones you typically use or even studies indicating that old and forgotten tests are actually better than commonly used ones.3 Currently professional bodies provide clinical guidelines that are based on research evidence and academic researchers write review articles, books and give lectures and this seems to be the preferred source of information for many optometrists.4 You may not need to review the research literature yourself, although it seems likely that this will become more common in future years as evidence-based optometry becomes an integral part of the undergraduate and postgraduate curriculum.4,5 If you wish to review the literature, one very useful free access website is PubMed (www.pubmed.com), which is provided by the US National Library of Medicine and includes the abstracts or summaries of all the main optometry and ophthalmology research journals. An increasing desire for research evidence to be freely provided to as many people as possible means that a growing number of the full articles are also free to access. Questions from clinicians on optometric internet/e-mail discussion groups can often be fully answered by a quick PubMed search that can provide a much better level of evidence than anecdotal suggestions based on one or two patient encounters. Full access to one or more of the main international optometry research journals, Ophthalmic and Physiological Optics, Optometry and Vision Science, Clinical and Experimental Optometry, Journal of Optometry and Contact Lens and Anterior Eye depends on which professional bodies you belong to, but note that the first three journals provide free access to a number of hot topic papers at www.whatshotoptometry.org. The usefulness of optometric tests is typically assessed by either comparing the test against an appropriate gold standard and/or assessing its repeatability.6 For example, a test that is being used as an objective measure of subjective refraction should be assessed by how closely the results match subjective refraction results and new tonometers are assessed by their agreement with the results of Goldmann Applanation Tonometry (GAT). Clearly the appropriateness of the gold standard test in these studies is critical. For example, Calvin and colleagues used the von Graefe phoria measurement as the gold standard test to assess the usefulness of the cover test and suggested that the cover test was occasionally inaccurate.7 The gold standard in this area should be the cover test and not the von Graefe. The cover test is the only test that discriminates between strabismus and heterophoria, it is objective and not reliant on subject responses and subsequent studies have shown it to be far more repeatable than the von Graefe, which they indicate is unreliable and does not appear to warrant its widespread use.3,8,9 The Calvin study7 should have used the cover test as the gold standard and they would then have reported the limitations of the von Graefe. The gold standard test must also be appropriately measured. For example, Salchow et al. compared autorefraction results after LASIK refractive surgery against the gold standard of subjective refraction.10 Subjective refraction was an appropriate choice of gold standard, but was inappropriately measured. The authors concluded that autorefraction compared very poorly against subjective refraction post-LASIK. However, inspection of the results clearly indicates that the majority of the subjective refractions (particularly of the hyperopes) provided a result of plano. This suggests that a normal or near normal VA resulted in a ‘brief’ subjective refraction and a result of plano. Finally, any limitations of the gold standard test must be recognised. For example, GAT is known to provide high intra-ocular pressure (IOP) readings on thick corneas and low readings with thin corneas.11 This has tended to be ignored until recently when significant reductions in IOP have been found after refractive surgery (section 7.7). If a tonometer that was resistant to corneal thickness effects had been compared to GAT, it would have been shown to be variable. The conclusion would have been that the new tonometer was somewhat variable compared to GAT. The use of subjective refraction as a gold standard assessment of refractive error has meant that there has been little or no comparison of the various methods used in subjective refraction. Previous studies have tended to compare the various tests against each other. For example, West and Somers compared the various binocular balancing tests and found that they all gave similar results and concluded that they were therefore all equally useful.12 Johnson and colleagues reported a similar finding when comparing subjective tests for astigmatism.13 These are not surprising findings and are limited by an unhelpful study design. A very good but under-utilised approach is to use some measure of patient satisfaction as the gold standard. If patients are happy with the results of subjective refraction using a particular test, then the test must be providing appropriate results and vice-versa. Hanlon and colleagues used this approach in a comparison of techniques used to determine the reading addition.14 They examined 37 patients that were dissatisfied with the near vision in their new spectacles. From the case history information in the review (recheck) examination, it was determined whether the improper add was too low or too high. For each patient, their reading addition was then determined using four methods (age, ½ amplitude of accommodation, NRA/PRA balance and binocular cross-cylinder). The percentage of adds for each test that gave the same result as the improper add or worse (higher than an improper add determined too high or lower than an improper add determined as too low) was calculated (section 4.14) The study would have been even better if they had confirmed that the patients were subsequently satisfied with their changed spectacles (i.e., that it really was the gold standard). This technique of using patient satisfaction as the gold standard test could be usefully employed to compare the various techniques used in distance refraction, particularly those that assess astigmatism and binocular balancing. In the past, test comparison studies tended to quantify the relationship between the test and gold standard using correlation coefficients. This is not appropriate for two reasons. First, a high correlation coefficient just indicates there is a strong relationship between the two sets of data and does not necessarily mean that agreement between the tests is good.6,15 For example, if the test results were always twice as big as the gold standard test, the correlation coefficient would be 1.0, but agreement would be very poor. In addition, correlation coefficients are very much affected by the range of values used in the analysis.6,15,16 If a small range of values is used in calculations the correlation coefficient is likely to be much smaller than if a larger range is used. This is highlighted in Figure 1.1, which shows a plot of correlation coefficients between visual acuity and other clinical measures of visual function versus the range of visual acuity of the subjects used in the studies. A much better analysis, commonly known as a Bland-Altman plot, shows the 95% confidence limits of the difference between the test and gold standard (Figure 1.2).6,15 The extent to which the 95% Bland-Altman agreement figures are clinically acceptable should be discussed by the authors of a paper and ideally acceptable limits should be determined prior to any assessment.6 Fig. 1.1 Correlation coefficients from the literature between high contrast visual acuity and other spatial vision measures are plotted as a function of the range of high-contrast acuities in those studies. The solid line is the regression line and the correlation coefficient for the plotted data points is 0.91. (Redrawn with permission from Haegerstrom-Portnoy G, Schneck ME, Lott LA, Brabyn JA. The relation between visual acuity and other spatial vision measures. Optometry and Vision Science 77:653–62, ©The American Academy of Optometry, 2000.) Fig. 1.2 A Bland-Altman plot showing agreement between optometrist grading of melanocytic fundal lesions and the gold standard assessment by an ocular oncologist versus the average score for each lesion. (Reprinted with permission from Hemmerdinger C, Beech M, Groenewald C and Damato B. Validation of an online referral guide for melanocytic fundus lesions. Ophthalmic and Physiological Optics 31:574–9. ©The College of Optometrists, 2011.) Repeatability assesses the ability of a measurement to be consistently produced. It is sometimes called precision or reliability and particularly in older reports has been quantified in terms of correlation coefficients. The limitations of correlation coefficients have already been discussed and it is better to assess repeatability in terms of the coefficient of repeatability (COR) or similar.6 This represents the 95% confidence limits of the difference between the test and retest scores and can be displayed using Bland-Altman plots (Figure 1.2).15 Correlation coefficients can be used when comparing tests that do not use the same units, but their limitations need to be realised. In particular, a large range of values should be used, so that correlation coefficients are not artificially low. Concordance values (the percentage of patients getting exactly the same score on test and retest) have also been used to indicate that a test is repeatable. However, a high proportion of patients often obtaining exactly the same score on follow-up visits indicates that the step sizes on the test are too big rather than that the test is repeatable.17 For example, a visual acuity chart containing only 20/20 (6/6) and 20/200 (6/60) lines would provide very high concordance but would be of very little value. Repeatability studies providing COR data indicate the size of the change in score due to chance and a clinically significant change in score is anything larger than the COR (at least for tests with a continuous scale).18 Repeatability appears to be a very important quality of a test, as an unreliable test is likely to correlate poorly with a gold standard and have poor discriminative ability.19 As these studies are also relatively quick and simple, the results of repeatability studies should be available for all clinical tests. Research journals such as those listed earlier include a rigorous review process so that the majority of papers include minimal problems and many list the limitations of the study within the report. However, not all research reports necessarily provide accurate information and a study could be flawed for a variety of reasons.20,21 In addition, articles on the internet and in professional magazines are unlikely to provide the same level of scrutiny and it is very useful to be able to critique a research report, rather than just accept its conclusions. Various criteria can be used to assess the methodological quality of research articles and a high quality paper should include the following20,21: • The paper should be easy to read and understand. Particularly in the area of the assessment of clinical and diagnostic techniques, there should be little that a clinician cannot understand. The rationale behind any complicated statistical analyses should be explained in a simple way. A paper that is difficult to understand often indicates a poorly written paper rather than any lack of understanding on the part of the reader. • The introduction of a paper should include the purpose of the study and discuss pertinent previous work. • The methods section should be clear and precise. Another researcher should be able to replicate the study from the information provided in the methods section. It is usually necessary to randomise the order in which tests are performed to ensure that there are no significant learning or fatigue effects that could affect the data. • In studies where tests are compared against a gold standard, the clinicians should be blind to the results from the other test. • The subject sample should be clearly outlined. A sufficiently large sample and a broad spectrum of subjects should be used to ensure no recruitment bias. In assessments of diagnostic tests, the patient sample must be representative of patients you would be examining in practice. For example, some Primary Open Angle Glaucoma (POAG) research studies include patients with moderate to severe POAG and healthy controls. This may be reasonable for an initial study, but likely tells you little about how well a new test would perform in discriminating between very early POAG and normal, healthy eyes in practice. • In diagnostic studies, it is sometimes reported that a significant difference was found between a group of patients with an ocular abnormality and a control group. It should be noted that this only indicates that there is a difference between the averages of the two groups. It does not indicate how well the test predicts whether an individual patient has the abnormality or not. • The authors may indicate the limitations of the study. The majority of research studies have some limitations and it is very helpful to the reader if the authors indicate them. It also suggests that the authors are not exaggerating the findings of their study. In many countries, glaucoma and other eye diseases are detected by ‘opportunistic case finding’ in that patients are self-selecting and they are detected as part of an eye examination that includes some assessment of ocular health and visual function.22 Professional bodies within different countries generally provide evidence-based guidelines which tend to suggest which tests are appropriate for different patient demographics and perhaps for certain signs and symptoms. There has been a tendency, however, particularly with the increased use of clinical assistants within optometric practice (section 1.3.5) to increasingly ‘screen’ patients with tests such as visual fields and non-contact tonometry to attempt to ‘not miss anything’.23 This approach is examined below and highlights the importance of understanding diagnostic indices of optometric tests.
Evidence-based eye examinations
1.1 Evidence-based optometry
1.1.1 Reviewing the research literature
1.1.2 Evaluating the usefulness of optometric tests
1.1.3 Analysis in clinical test comparison studies
1.1.4 Analysis of test repeatability
1.1.5 Critically appraising a research paper
1.2 ‘Screen everybody, so i don’t miss any glaucoma’: is this reasonable?
Evidence-based eye examinations


