CHAPTER 42 Evaluation of Nasal Breathing Function with Objective Airway Testing
Nasal Breathing Function
Physiologic Factors
Although the sensation of unrestricted nasal breathing is a complex phenomenon that may be influenced by factors other than airflow, there is a correlation between the amount of airflow and the symptom of nasal obstruction.1–3 Factors affecting the stimulation of cold receptors in the nasal vestibule, skin, and mucosa and changes in the atrophic mucosa of rhinitis sicca may be interpreted by a patient as nasal obstruction despite the presence of unrestricted airflow.
“Normal” changes in airflow and the sensation of obstruction occur during the nasal cycle.4 During quiet nasal respiration, one side of the nose is usually more “congested” than the other. This cyclic engorgement of the nasal turbinates is part of normal physiologic function of the nose that warms and humidifies the air. We do not currently understand why the cycling occurs, but it allows us to have at least one nostril that is unobstructed relative to the other during normal breathing. In most people, these cycles last around 2 to 4 hours. In some subjects, however, there is no “cycle” at all, cycles are extremely shortened or elongated, or cycles involve nostrils being concurrently either “blocked” or “open.” Another normal response of the nose is the “opening up” of the nose associated with an elevated pulse that occurs during exercise. It is also normal for the nose to become more congested when a person is lying down and for relative congestion to occur on the dependent side when a person is lying in the lateral recumbent position. These normal physiologic phenomena have been studied with objective testing of the nasal airway.
Anatomy
The Nasal Valve
Distinction between Valve and Valve Area (Region)
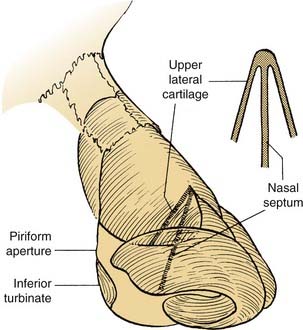
Kern5 distinguished between the nasal valve and the nasal valve area. The nasal valve is a slitlike opening between the caudal edge of the upper lateral cartilage and the nasal septum. The valve is only a part of the nasal valve area. Dutch otolaryngologist and physiologist Pieter J Mink (1859-1941) called this slitlike opening the “ostium internum” and considered it to be the narrowest part of the nasal airway.6 Other names are os internum, limen vestibuli, limen nasi, liminal valve, and “liminal chink.” Limen nasi (limen vestibuli) refers to a specific anatomic ridge (boundary) on the lateral nasal wall formed by the lower end of the upper lateral cartilage that separates the vestibule from the remainder of the nasal cavity.7 The valve has also been called the narrowest part of the nasal airway,8 and it would thus generally be the main determinant of nasal resistance. Plastic casts show that the smallest area is at the isthmus nasi close to the piriform aperture.9 A model based on magnetic resonance imaging data suggests that the greatest drop in pressure occurs anterior to the inferior turbinate.10
Description of Valve Area (Region)
The nasal valve area (Fig. 42-1) is the functional unit that “includes the distal end of the upper lateral cartilage, the head of the inferior turbinate, the caudal septum, and the remainder of the tissues surrounding the piriform aperture” (floor of the nose, lateral fibrofatty tissue, and frontal process of the maxilla).11 This is the “flow-limiting segment” with the “Mink” valve as its distal orifice.11a Other designations for the valve area are “valve region,” minimal cross-sectional area (mCSA), and cross-sectional area 2 (CSA2).5 In the rest of this chapter, we use the term valve region to refer to this anatomic unit in order to avoid confusion of the term “area” with the measurement of a cross-section. The valve region is the anterior part of the nose where the minimal cross-sectional area occurs. Bridger and Proctor,12 using rhinomanometry and a plastic catheter passed along the floor of the nose, found that instead of a solitary highest resistance point, the resistance was spread across the valve region and that beyond that only a little additional resistance was noted. Using a similar method, Haight and Cole8 found that the greatest resistance drop occurred at the anterior end of the inferior turbinate in the first few millimeters of the bony cavum. They demonstrated that the site of greatest resistance was in the same location even after decongestion. Extending this study to a larger group of subjects, Hirschberg and associates13 found that before decongestion, the most restrictive portion of the nose (78% of the resistance) was in the first 4 cm, with 56% of the resistance in the first 2 cm. After decongestion the greatest resistance (88%) was in the first 2 cm. This finding demonstrated that the anterior tip of the inferior turbinate is the site of most resistance in the nasal airway for some patients before but not after decongestion.
The valve region is bounded by compliant and mobile as well as rigid components, giving the region a dynamic character.14 Any change in dimension can alter the cross-sectional area and thus affect airway resistance exponentially. Therefore, the effect of changes in the valve region is greater than elsewhere in the nose. This fact reinforces the importance of not distorting the anterior nasal structures during performance of an objective test. This region of the nose has been noted to account for half of the airflow resistance of the entire respiratory tract. It is the most common site of pathology causing significant obstruction.14
Site of Sensation of Obstruction
Vestibular Skin versus Caval Mucosa
Exposure to aromatic substances such as menthol, camphor, and eucalyptol causes the sensation of increased nasal patency despite the absence of change in nasal resistance.15,16 These volatile oils increase the sensitivity of cold receptors by raising the temperature at which they respond. With the increase in cold receptor reactivity in nerve endings, the subject feels that the nose is more open.17
Lidocaine injected in the nasal vestibule causes the sensation of nasal obstruction in subjects, without any change in nasal resistance. This finding supports the hypothesis that the level of activity of the cold receptors affects the sensation of obstruction. Cold receptors reside primarily in the vestibular skin; this location is supported by the finding that, when an air jet is directed at the inside of the nose, the area of greatest sensitivity to the sensation of airflow is in the nasal vestibule.18
Investigators have also found evidence for menthol-sensitive receptors in the nasal mucosa.19,20 Most of the nasal mucosa is located posterior to the vestibule in the cavum of the nose. Conflicting results have been obtained when the nasal mucosa was anesthetized, with investigators finding that it caused a sensation of more, unchanged, or less patency.20 Clarke and Jones21 reported that if airflow is carefully controlled, nasal mucosal anesthesia has little effect on sensation, suggesting that the most important receptors for the sensation of patency are in the vestibule.21 Aldren and Tolley19 concluded that both vestibular skin and the caval mucosa contribute to the sensation of patency or obstruction, but that the nerve endings in the vestibule have the greatest effect. Clarke and Jones21 thought that, rather than cold receptors detecting airflow, it is more likely that flow sensation results from an interplay of “peripheral signals—tactile, thermal and perhaps chemical.”21 Eccles16 believed that any damage to trigeminal sensory nerve endings, whether vestibular or caval, may cause a sensation of nasal stuffiness even though resistance is unchanged or decreased.
Wight and colleagues22 found that radical turbinectomy results in a greater likelihood of improvement in symptoms than anterior turbinectomy, even though both lead to a decrease in resistance. There are two possible explanations for this finding. One is that more than airflow is involved in the experience of symptoms in the patients who had turbinate surgery. The second is that an airflow phenomenon occurs along the unresected portion of the turbinate, which causes persistent symptoms. It is of smaller magnitude than the larger anterior pressure drop and so is not reflected in the result of improved resistance. This theory would suggest that it might still be important to correct pathologic conditions in a more posterior location to provide symptomatic relief. This suggestion is consistent with the statement by Bachmann23 that the effect of the anatomy in the posterior sector of the nose has been undervalued.
Assessment of Nasal Breathing Function
Patient History
The first way of assessing nasal breathing function is by taking a patient’s history. The patient is asked specifically about the symptom of nasal obstruction. If it is present, the side of obstruction, its severity, frequency, and duration, and exacerbating factors are recorded. In addition, questionnaires are sometimes used for assignment of specific scores for symptoms and quality-of-life issues related to nasal obstruction.1 A good questionnaire should be valid, reliable, and responsive to changes. Questionnaires may be generic (measuring general health), such as the Medical Outcome Survey Short Form 36 (SF-36), or disease-specific, such as the Rhinitis Quality of Life Questionnaire (RQLQ), the Sino-nasal Outcome Test (SNOT-20), and the Rhinosinusitis Disability Index (RSDI).24 Several other methods have been used for recording the severity of symptoms.25–27 A common method asks the patient to record the severity of a blockage by using the descriptors “none,” “mild,” “moderate,” and “severe.” Sipilä and coworkers28 used four categories for severity of symptoms, including “very patent” for the sensation that the airway was more open than normal. All of these descriptions represent the patient’s subjective evaluation of nasal breathing function.
Nasal Examination
Another way of evaluating nasal breathing is the physical examination of the nose. Methods of recording rhinoscopic findings can be detailed.29 These methods include an assessment by the physician of the appearance of the intranasal anatomy, the cross-sectional area, and the condition of the lining tissues of the nose. This assessment is made with the aid of a speculum and headlight or head mirror. In addition, endoscopy may be performed, typically with a small flexible scope but sometimes with a rigid scope.
Maneuvers performed as part of the examination can help elucidate the nature of a nasal obstruction. One simple test is to occlude one side of the patient’s nose at a time and ask the patient to compare the nasal breathing through the two sides. It is very important that the examiner then looks to see whether his/her visual assessment of the airway matches the patient’s subjective impression. To assess the effect of the nasal valve, the patient’s cheek can be drawn back (as in the presence of Cottle’s sign)30 to see whether a significant decrease in obstruction occurs. Alternatively, the patient can be asked how much improvement in breathing is noted when the valve area is held open with a nasal speculum, with one of the commercially available adhesive plastic strips or dilators, or with a wax curette. These tests are easy to perform and are noninvasive; however, they require subjective appraisal by the patient and clinician and thus are not easily quantified objectively.
Objective Testing of the Nasal Airway
History of Objective Testing of the Airway—Starting with Some Simple Office Maneuvers
At the turn of the 20th century, objective testing methods used included having the patient breathe on a mirror or glass plate (rhinohygrometry), assessing the sound of a forced expiration through the nose, and evaluating the pitch of the sound made by a patient humming while first one and then the other side of the nose was occluded.31,32 The mark made by warm airflow in rhinohygrometry has been quantitated.33 Foxen and colleagues31 and Kosoy34 have described the history of the development of rhinomanometry. Various types of equipment and methods have been developed for performing this measurement.35 Rhinomanometry, the assessment of transnasal pressure and flow, has been a useful tool. The early rhinomanometers had a long warm-up time, producing variations in measurements when the machine was first turned on. In the past, recordings of pressure and flow have been made with strip-chart recorders, oscilloscopes, and x-y plotters. In the late 1970s rhinomanometry was first performed using the then-newer technology of the desktop computer. The computerization of airway testing allowed simultaneous storage, calculation, analysis, and printing of test results.36,37 In the early 1980s, the first reports of acoustic rhinometry emerged. Because of its relative ease of use, acoustic rhinometry became one of the more widespread methods of objective airway assessment.
Criteria for a Good Objective Test of the Nasal Airway
A number of desirable criteria for a nasal airway test have been described.38 They include ease of performance with readily available equipment; no discomfort for the patient; no interference with the nasal anatomy or airflow; an objective means of assessment that is accurate, reproducible, and standardized; availability of normal values; use of physiologic levels of the parameters measured; and clinical usefulness. Available tests vary in their ability to fulfill these criteria.
Tests That Assess Intranasal Dimensions and Cross-Sectional Area
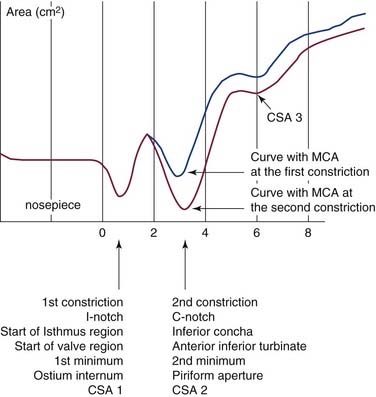
The cross-sectional area of the nose can be assessed by computed tomography (CT), magnetic resonance imaging, fiberoptic endoscopy,39 rhinostereometry, and acoustic rhinometry. Acoustic rhinometry, the most commonly used of these methods, analyzes the changes in a reflected incident sound wave (“click”) that is passed into the nose. The various anatomic structures inside the nose, such as the inferior turbinates, septum, and middle turbinates, cause changes and distortions in the reflected wave. The cross-sectional area may be estimated from the magnitude of the distortions, and the distance of the reflected anatomy can be estimated from changes in the reflected sound wave. Acoustic rhinometry gives a profile of the cross-sectional areas through the nose and the volume of the nasal cavity (Fig. 42-2). Investigators have found a correlation between cross-sectional area as measured by CT scanning and that measured by acoustic rhinometry.32,40 In addition, magnetic resonance imaging data have been correlated with cross-sectional area as measured by acoustic rhinometry in the decongested nose.41 There is a correlation between volume measured by acoustic rhinometry and that measured by use of a water displacement method.32 The application of acoustic rhinometry is described in more detail later on.
Rhinostereometry involves the use of a microscope for assessing changes in nasal congestion.42 Rhinostereometry has been shown to be useful for the detection of the nasal cycle; however, a good correlation of results with those of acoustic rhinometry is not observed when the two are directly compared.43 This method has been used for research into the effects of medication on nasal mucosal blood flow.
There has been growing interest in the use of CT with computational fluid dynamics (CFD). This method entails using high-resolution CT images to define the airspace of the nose. Then computer software is applied to this airspace to calculate its fluid dynamics and to derive the airflow vectors throughout the nasal airway. This technique is being explored as investigators continue the quest for optimal parameters that correlate with the symptom of nasal obstruction.44
Tests That Assess the Air Stream through the Nose
Measurement of Peak Nasal Airflow
The readily available peak expiratory flowmeter has been used for assessment of the nasal airway, and the results are correlated with nasal resistance,45 but may be unreliable possibly due to changes in effort.46 A nasal peak inspiratory flowmeter has been studied.47 In children, the measurement of peak nasal inspiratory flow has the drawback of depending on the extent of cooperation of the child and on the subjective impression of the observer about when a maximal effort has been made.48 Measurement of peak inspiratory flow is less sensitive than rhinomanometry for detecting changes in nasal patency after histamine challenge49 and with increasing doses of xylometazoline.50 Measurements with the portable nasal spirometer have been shown to correlate well with results of rhinomanometry for the detection of the nasal cycle.51 This is a simple measurement that requires minimal equipment.
Simultaneous Measurement of Transnasal Pressure and Airflow: Rhinomanometry
Rhinomanometry is the simultaneous measurement of transnasal pressure and airflow. Rhinorheomanometry, rhinomanometry, rhinometry, and rhinomanography are names that have been applied to these measurements. The International Standards Committee for the Objective Assessment of the Nasal Airway has chosen the term rhinomanometry.52 In subsequent sections, we describe equipment and methods for performing rhinomanometry as well as reported results and clinical applications.
Other Methods of Objective Assessment of the Nose
Other objective tests have been performed for assessment of various components of the nasal airway. Investigators have used laser Doppler velocimetry to study mucosal blood flow in the nose.53 Manometric rhinometry54 is a technique in which the volume of air in the nose is assessed by closing off the nose, removing a volume of air, and then recording the resultant pressure change. In forced oscillation rhinomanometry,55–57 the oscillation of a loudspeaker provides a complex signal of sinusoidal sound waves, which is coupled to the patient through a small mask and a pneumotachometer. Nasometry measures the oral and nasal acoustic ratio across a specified frequency range. This test may be performed more easily than rhinomanometry, particularly in children, because it does not require a mask or a pressure cannula.58 Olfactory testing and tests of ciliary function are objective assessments of nasal function covered in other chapters.
Comparison of Acoustic Rhinometry and Rhinomanometry
Of all the methods described, rhinomanometry and acoustic rhinometry are the most commonly used. With the current microprocessor-assisted devices, equipment capable of rapid and sophisticated airway assessment has become readily available. There is a correlation between the cross-sectional area of the nasal airway measured by acoustic rhinometry and the area found from calculations based on data from rhinomanometry.32 The results of both acoustic rhinometry and rhinomanometry are abnormal in habitual snorers.59 There is a correlation between the results of rhinomanometry and acoustic rhinometry in a study of normal subjects before and after decongestion, but the relationship is weak.60 Investigators have found comparable results for acoustic rhinometry and rhinomanometry when performing nasal challenge testing.61,62 The two techniques provide complementary information.14 Rhinomanometry determines nasal patency in terms more representative of how difficult it is for a person to breathe, and acoustic rhinometry is preferable to study rapidly changing mucovascular conditions and nasal volume changes. Both methods can give information about a site of obstruction, but acoustic rhinometry gives more precise anatomic information.
Intranasal Sites Assessed by Rhinomanometry and Acoustic Rhinometry
Various Sites of the Minimal Cross-Sectional Area Verified by Rhinomanometry and Acoustic Rhinometry
Rhinomanometry, when performed with the use of the pressure drop across the entire nose, largely reflects this narrowest effective cross-sectional area of the nasal airway, because the greatest part of the resistance drop occurs at the narrowest site. We call this assessment of the smallest dimension found by rhinomanometry the physiologic MCA estimate. Acoustic rhinometric measurements yield an area-distance display that allows the measurement of the smallest cross-sectional area for the anatomic presentation of the instrument. We refer to this smallest dimension determined by acoustic rhinometry the anatomic MCA estimate. Acoustic rhinometry also yields the distance to the narrowest area. Figure 42-2 illustrates how the MCA can move after decongestion. One of us (JC) suggests naming the cross-sectional areas found by acoustic rhinometry CSA1, CSA2, and CSA3. The ability of acoustic rhinometry to evaluate the valve region has been confirmed by CT and endoscopy. The extent to which the physiologic MCA estimate and the anatomic MCA estimate are similar reflects the extent to which acoustic rhinometry and rhinomanometry provide similar assessments of the nasal airway.
Acoustic Rhinometry
Technique
A typical graph before and after administration of decongestant is shown in Figure 42-2. The minimal cross-sectional areas (CSAs) usually observed are CSA1, CSA2, and CSA3. Some publications may describe these as “valleys” or I-notch (isthmus-notch). Recommended standards and interpretation methods have been recorded for adults and children.63–66
Reporting Results
The graph is usually printed with results “before” and “after” decongestion; cross-sectional areas CSA1, CSA2, CSA3, and estimated volume are recorded. The congestion factor may be calculated and the sides compared with each other. A consensus report from the European Community by Clement and Gordts67 provides standardization recommendations. CSA1 is usually the nasal valve area; CSA2 may be located at the anterior head of the inferior and/or middle turbinate. Nasal examination, endoscopy, or both should be used for correlating the area of CSA2 for an individual patient. The values of CSA1, CSA2, and CSA3 (mid-posterior end of the middle turbinate) are recorded and compared with normative values.
Rhinomanometry
Technique
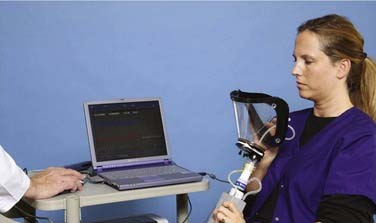
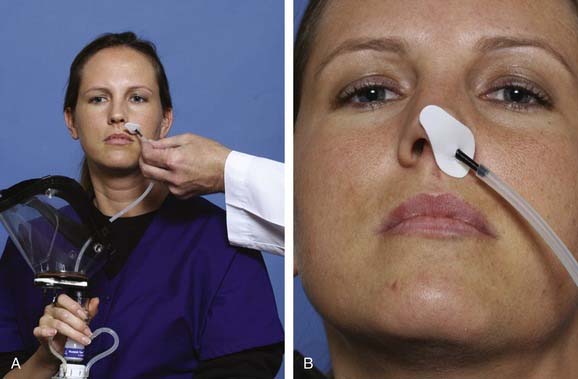
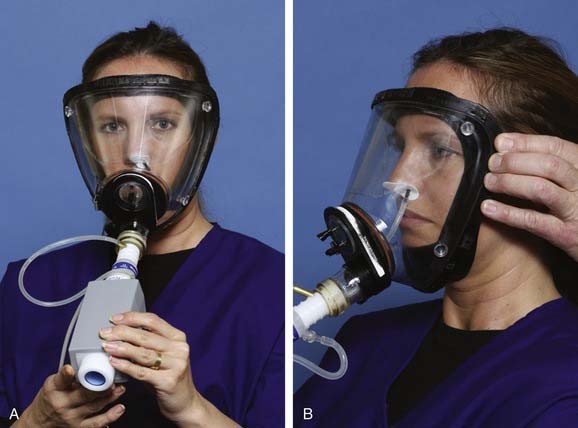
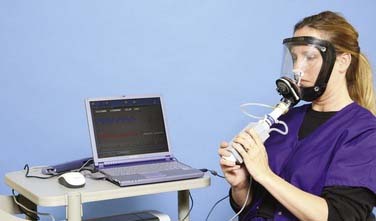
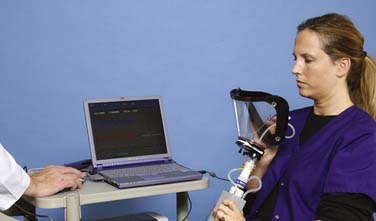
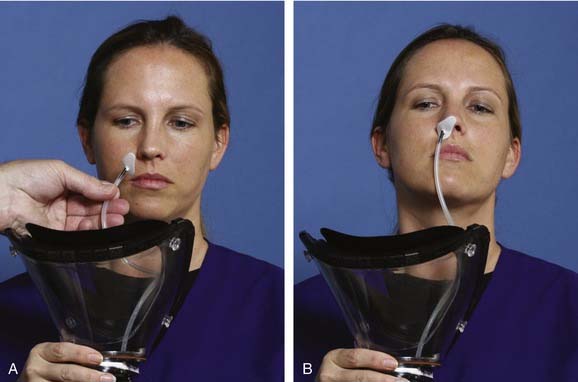
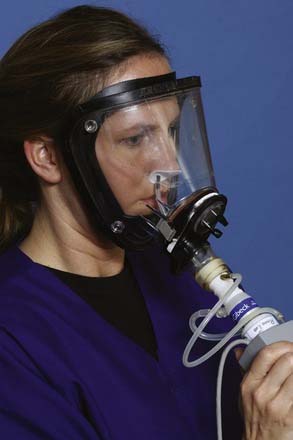
Before proceeding with the testing, the tester should calibrate the device as recommended by the manufacturer. The International Committee on Standardization of Rhinomanometry has concluded that active anterior rhinomanometry is the preferred method of measurement.52,68,69 Refer to Figures 42-3 to 42-11 for the description and illustration of the method of rhinomanometry.
Stay updated, free articles. Join our Telegram channel

Full access? Get Clinical Tree


