CHAPTER 134 Electrophysiologic Assessment of Hearing
This chapter describes the range of electrophysiologic techniques that can be used to assess hearing sensitivity, and to assist in the differential diagnosis of the site of a lesion within the auditory system for individuals with impaired hearing. These measures include otoacoustic emissions (OAEs), electrocochleography (ECoG), auditory brainstem response (ABR), auditory steady-state responses (ASSRs), middle and long latency evoked potentials, and a similar range of electrically evoked auditory potentials. This chapter provides the reader with an overview of these measures: how they are recorded, their strengths, their weaknesses, and potential clinical applications. Chapter 133 expands this focus to provide case studies and a series of examples of how these evoked potentials can be used to inform clinical decision making.
Otoacoustic Emissions
In 1978, Kemp1 showed that the healthy inner ear emitted very low intensity sounds that could be measured using a sensitive microphone sealed into the ear canal. These responses not only occurred spontaneously, but also could be evoked. Kemp theorized that these low-level acoustic signals originated from the outer hair cells (OHCs) of the cochlea and were a by-product of the nonlinear processing of the healthy inner ear. In the years that followed, support for Kemp’s theories grew. In the early 1980s, Brownell2 showed that OHCs were capable of changing shape (contracting and elongating) when stimulated, and in the 1990s, Mammo and Ashmore3 showed that electrical stimulation of isolated OHCs could move or modify the motion of the basilar membrane.
The general thinking today is that the normal cochlea functions much like a highly tuned, exquisitely sensitive amplifier, and it is the inherently nonlinear nature of such a system that results in the generation of OAEs. Consistent with this theory are observations that ears with damaged OHCs generally exhibit reduced sensitivity, broader tuning, and absent OAEs.4–7 This link between the presence or absence of OAEs and the function of the OHCs has made OAEs a powerful tool for researchers and for clinicians.
There are two general classes of OAEs: spontaneous and evoked. Spontaneous OAEs are low-level acoustic signals that can be recorded in the ear canal without any external stimulation. Spontaneous OAEs are recorded only in 50% to 70% of ears with normal hearing sensitivity.8,9 They are recorded more frequently in women than men,10,11 and in some cases are intense enough to be detected without amplification or sophisticated recording equipment.12,13 The presence of spontaneous OAEs is not strongly correlated with the presence of tinnitus, and the amplitude and the frequency of the spontaneous OAE can vary significantly across time.14,15 All these factors limit the clinical applicability of spontaneous OAEs. Although their presence may indicate that at least a portion of the OHC system is intact, their absence is not clinically significant.
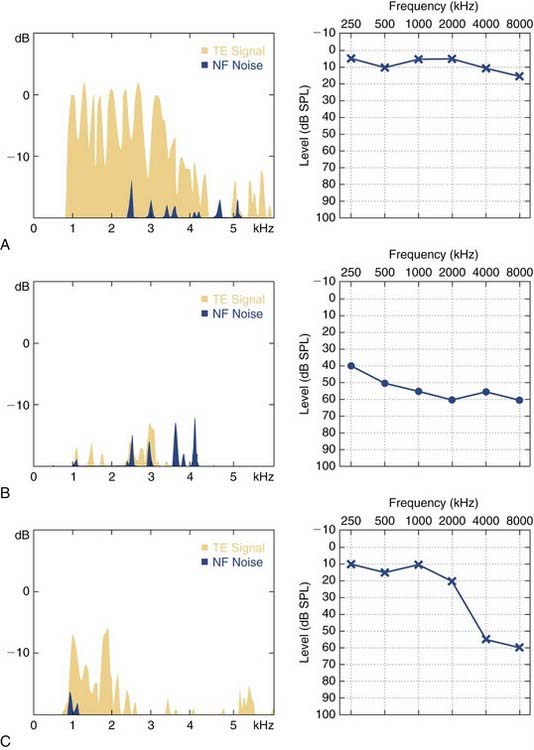
TEOAEs are usually analyzed in the frequency domain. Despite the fact that the stimulus used to elicit the TEOAE is broadband, the response itself provides frequency-specific information about the status of the cochlea between approximately 1000 Hz and 4000 Hz. Typical criteria used to establish the presence or absence of a response within a specific frequency band are signal-to-noise ratios of greater than 6 dB coupled with reproducibility measures of more than 90%. The presence of TEOAEs in ears with normal middle ear function suggests normal OHC function and is considered to be indicative of normal audiometric sensitivity. Conversely, the absence of TEOAEs within a specific frequency band is typically interpreted as evidence of audiometric thresholds worse than 25 to 30 dB HL.7
Figure 134-1 shows audiograms and TEOAEs recorded from three different listeners. Figure 134-1A shows results obtained from an individual with normal hearing; B and C show results from individuals with sensorineural hearing loss (SNHL). The TEOAEs recorded from the listener with normal hearing are robust for frequencies ranging from 1000 to 4000 Hz. The subject whose data are shown in Figure 134-1B has a relatively flat, moderate SNHL and no measurable TEOAE. Figure 134-1C shows results obtained from an individual with normal hearing for frequencies less than 2000 Hz and a moderate SNHL for audiometric frequencies between 3000 Hz and 8000 Hz. This subject has measurable TEOAEs only for frequencies less than 2500 Hz. No response was obtained for frequencies between 3000 Hz and 8000 Hz. The presence of TEOAEs suggests normal OHC function, and typically indicates that the listener has good audiometric sensitivity, at least for frequencies ranging from 1000 to 4000 Hz.
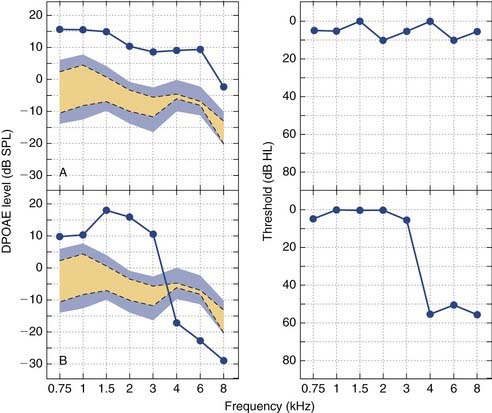
Studies have shown that the most robust DPOAEs are recorded when the frequency ratio of F2 to F1 is approximately 1.2.16,17 Additionally, for clinical applications, the levels of the two tones typically are set at 65 dB SPL and 55 dB SPL (L1 and L2) because these levels most accurately identify the ear as either normal hearing or hearing impaired.18 By systematically varying the frequency of the two primary tones, DPOAEs can be recorded across a wide frequency range from 1000 Hz through approximately 8000 Hz. The amount of energy at the 2F1-F2 frequency that is recorded in the ear canal is compared with estimates of the noise floor of the recording system. DPOAE amplitude-to-noise ratios of approximately 6 dB typically are required before a response is considered present. To interpret the response, the amplitude of the DPOAE is compared with normative values.6
Figure 134-2 shows the relationship between DPOAEs and audiometric thresholds for two subjects. Figure 134-2A shows DPOAE results for a listener with normal hearing. DPOAE amplitudes ranging from −5 to 15 dB SPL were obtained for each of the test frequencies. These amplitudes were compared with the normative ranges, which are indicated by the shading on the figure. Responses above the top boundary of the shaded area are consistent with normal DPOAEs and indicate normal hearing. Responses below the lower boundary are consistent with abnormal DPOAEs and indicate hearing loss. Responses falling within the shaded region are equivocal because amplitudes in this range can be produced by ears with normal and impaired hearing. The DPOAE results shown in Figure 134-2A are above the upper boundary of the shaded region, indicating normal DPOAEs and normal hearing. The DPOAE results shown in Figure 134-2B are for a listener with normal hearing through 3000 Hz and a high-frequency hearing loss from 4000 to 8000 Hz. Consistent with these audiometric findings, DPOAEs recorded for frequencies less than 4000 Hz are normal; however, DPOAEs from 4000 to 8000 Hz fall below the lower boundary of the shaded region, indicating abnormal DPOAEs and hearing loss. Consistent with the results shown in Figure 134-2, the absence of DPOAEs in a patient with normal middle ear function suggests audiometric thresholds greater than 30 to 35 dB HL.6
Clinical Applications
DPOAEs and TEOAEs have become a routine part of the audiologic assessment battery in many clinics nationwide. Both of these OAEs assess the same underlying cochlear phenomenon. A finding that a patient has robust evoked OAEs, regardless of the type, is a strong indicator that the patient has normal or near-normal OHC function. This finding is typically correlated with normal hearing sensitivity. Neither DPOAEs nor TEOAEs are reliably recorded in ears with conductive pathology, nor are they recorded from individuals with more than a mild to moderate degree of SNHL. There is some indication that TEOAEs may be more sensitive to very mild amounts of hearing loss than DPOAEs, particularly at 1000 Hz. Conversely, DPOAEs may be slightly more sensitive to mild degrees of hearing loss for frequencies between 4000 Hz and 6000 Hz.7,19
The strength of evoked OAEs as a clinical tool is for screening (see Chapter 133). These responses can be recorded from neonates. They are not affected by sleep or sedation, and do not require application of recording electrodes or active participation by the child. Absence of evoked OAEs does not indicate that a child is deaf, however, and the presence of an evoked OAE does not tell anything about the integrity of the auditory nerve or central auditory system. Evoked OAEs have been recorded in profoundly hearing-impaired individuals whose hearing loss is the result of neural involvement.
The amplitude of an evoked OAE is not strongly correlated with audiometric sensitivity.6 Evoked OAEs cannot be used to determine the degree of hearing loss an individual patient has at a given frequency. Evoked OAE amplitudes are known to be stable and repeatable across time, however, with estimates of test-retest variability ranging from ±3 to 5 dB.20 Clinically, a change in evoked OAE amplitude of more than 4 to 5 dB may signal a change in hearing sensitivity relative to a previously established baseline. Consequently, many clinicians use evoked OAEs to help monitor hearing during or immediately after ototoxic drug exposure. For patients who are very sick at the time of testing, the objective nature of the evoked OAE test itself may prove to be more reliable than behavioral thresholds, and changes in the evoked OAEs may precede changes in cochlear sensitivity.
Finally, auditory neuropathy and auditory dyssynchrony are terms that are used to describe a condition in which a patient presents with measurable evoked OAEs or cochlear microphonics or both, but with a grossly abnormal or absent ABR. The implication is that for these individuals, the hearing loss is not cochlear in origin, but is the result of some type of nonspecific damage or dysfunction of the auditory nerve. Individuals diagnosed with auditory neuropathy may or may not have other peripheral neuropathies. Audiometric thresholds can vary widely from normal to profound, but many individuals with this disorder have poor speech discrimination and receive limited benefit from amplification.21–23
Although many children diagnosed with auditory neuropathy have been shown to benefit from cochlear implantation, others have not shown any benefit.24,25 Imaging studies have shown that some of these children do not have a viable cochlear nerve despite having residual OHCs, a measurable cochlear microphonic, and robust OAEs.26 The observation of measurable evoked OAEs in a child who is being considered for cochlear implantation should suggest the medical team working with that child proceed with caution. Care must be taken to rule out the possibility that technical problems were the cause for the absent ABR, and every effort should be made to obtain behavioral thresholds before surgery. Such caution is warranted because there are numerous reports in the literature of individuals with absent ABRs and measurable evoked OAEs who are able to attain reasonable levels of word recognition without the use of a cochlear implant.
Electrocochleography
The CM is an intracellular evoked potential that consists of a series of deflections that follow the stimulus and reflect the instantaneous displacement of the basilar membrane.27 The SP is characterized by a DC shift in the baseline that occurs during stimulation. It is thought to be a measure of the net depolarization of the hair cells within the organ of Corti.28,29 Neither the CM nor the SP has a measurable response latency—a fact that often makes separation of these neural potentials from the stimulus artifact problematic. Presence of a CM or SP or both can be interpreted as being consistent with the presence of viable cochlear hair cells.
ECoG can be recorded noninvasively from numerous different recording electrode positions. The largest amplitude responses are obtained when a transtympanic electrode positioned on or near the promontory of the middle ear is used for recording. As the recording electrode is moved away from the cochlea, the amplitude of the response decreases.30,31 It is still possible, however, to record ECoG from an ear canal or mastoid electrode if use of a transtympanic or tympanic membrane electrode is not feasible.
Clinical Applications
It is possible to use ECoG to assess auditory sensitivity. If a transtympanic or tympanic membrane recording electrode is used, ECoG thresholds can be recorded at stimulation levels that are near or only slightly above behavioral detection thresholds, and several authors have reported finding good correlations between ECoG and behavioral hearing thresholds.32–34 Many patients do not tolerate placement of a tympanic or transtympanic recording electrode, however, and no study has shown that threshold estimates obtained using ECoG are superior to estimates obtained using the more easily recorded ABR. As a result, in recent years interest in this application for ECoG has waned. Today, the two primary clinical applications of ECoG are as a means of evaluating patients suspected to have Meniere’s disease and as a method of assessing the response of the auditory nerve during otoneurologic surgery.
Meniere’s disease is a progressive, debilitating disorder characterized by episodic and recurrent vertigo, fluctuating SNHL, a sensation of aural fullness, and tinnitus. The underlying cause of this disorder is thought to be increased endolymphatic pressure within the scala media. There is no way to confirm the presence of endolymphatic hydrops in vivo, and although the disorder was originally described in the medical literature more than a century ago,35 diagnosing Meniere’s disease remains a challenge.
Several studies have shown that ECoG recordings from individuals diagnosed with classic Meniere’s disease exhibit enlarged SPs compared with recordings from individuals with normal hearing or SNHL resulting from an etiology other than Meniere’s disease.33 This observation led to the use of the SP : AP ratio in the diagnostic process at many otolaryngology clinics across the United States. In a meta-analysis of the literature published before 2000, Ferraro36 showed that mean SP/AP ratios in normal ears range from approximately 0.16 to 0.31. SP : AP ratios larger than approximately 0.4 or 0.5 were considered abnormally large consistent with a possible diagnosis of Meniere’s disease. The sensitivity and specificity of this electrophysiologic procedure is relatively low, causing many clinicians to question its role in the diagnostic process.37 What does seem clear is that although the observation of an enlarged SP : AP ratio may support a diagnosis of Meniere’s disease, the finding of a normal SP : AP ratio is of limited diagnostic significance.
Auditory Brainstem Response
The ABR is a far-field recording of the synchronized response of numerous neurons in the auditory pathways within the brainstem. The ABR was first described by Sohmer and Feinmesser in 1967.38 Shortly thereafter, Jewett and others39,40 published a series of studies that contained more detailed descriptions of the ABR. Since that time, research has focused on how best to record and interpret this evoked potential, and today the ABR has become a routine part of standard clinical practice.
In normal-hearing adults, the ABR consists of a series of vertex positive peaks or waves that are traditionally labeled with roman numerals I to V. Wave I of the click-evoked ABR occurs with a latency of approximately 1.5 ms in normal-hearing adults. Each of the subsequent peaks follows at approximately 1-ms intervals such that wave V is recorded 5 to 6 ms after onset of the stimulus. The individual peaks of the ABR reflect the response from neurons located at progressively more central locations within the auditory pathways. Wave I is a measure of the collective response of numerous auditory nerve fibers. Wave V reflects neural activity generated primarily from neurons located within the lateral lemniscal tracks that run between the superior olivary complex and the inferior colliculi.41
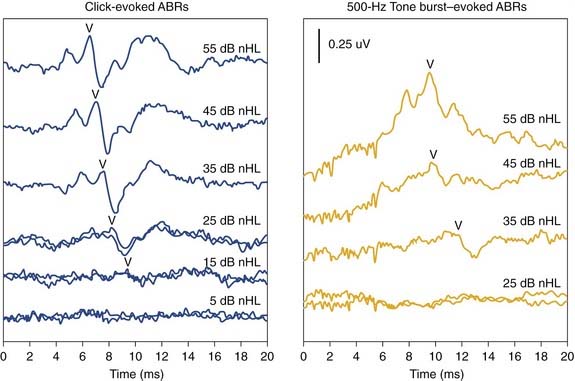
The effect of intensity on the ABR is illustrated in Figure 134-3. As intensity is decreases, the amplitude of the individual peaks of the ABR decreases, and the latency increases. Near behavioral detection thresholds, the only component of the ABR that can still be resolved is wave V. Figure 134-3 also illustrates the effect of stimulus type on the ABR. The left panel of the figure shows responses recorded using clicks. The right panel shows responses recorded using 500-Hz tone bursts. When low frequencies are used, the response morphology changes. The early peaks of the ABR often become more difficult to identify, peak latencies increase, and response thresholds are slightly elevated relative to behavioral detection thresholds. These trends reflect the fact that, compared with responses recorded using click stimuli, low-frequency tone bursts result in a recording that is dominated by neural activity originating near the apex of the cochlear partition where cross-fiber synchrony is reduced.
At birth, the ABR consists primarily of three peaks corresponding to waves I, III, and V of the adult ABR. In very young infants, the amplitude of wave I may be equal to or sometimes even larger than the amplitude of wave V, and the absolute latency of all three waves (I, III, and V) and the I-III and I-V interpeak intervals are prolonged relative to adult norms.42–44 As a child matures, absolute and interpeak latencies shorten, waves II and IV become more pronounced, and the relative amplitude of wave V increases until the ABR attains its normal adult form by approximately 2 years of age.42,45,46 These maturational changes in the ABR are significant enough to require the use of age-matched normative data for children younger than 2 years. Although it is possible to record the ABR in premature infants 27 to 30 weeks of gestation, there is evidence of threshold elevation in these very young infants.44,47 This elevation is most likely a product of an immature auditory system and the suboptimal test environment that is typical of most neonatal intensive care units.


