4 Many kinds of diseases can affect the posterior segment of the eyes. To make a correct diagnosis and establish an adequate treatment, one must combine a proper history of the patient’s symptoms with a detailed ocular examination. Determination of the nature and duration of the visual symptoms, including past ocular and systemic history, should be the first step toward the correct diagnosis. Ophthalmic examination in children, in particular, requires a special combination of patience and energy because of the limited communication and cooperation possible with this group of patients. Following the history, we proceed with measurement of the visual acuity, slit-lamp biomicroscopic examination, and the ophthalmoscopy, which always should be done with the patient’s pupils dilated to allow a wider view of the periphery of the ocular fundus. Numerous ophthalmoscopically visible features of the vitreous, for example, are anomalies attributable either to structural changes, such as the floaters of syneresis and the ringlike form associated with posterior vitreous detachment, or to invasive elements, such as blood, white blood cell masses, or fibrovascular tissues. The retina is also normally transparent, allowing the choroid and retinal pigment epithelium (RPE) to be visible. With injury, the retina may become opaque, obscuring the retinal vessels and underlying details. There are also complementary imaging diagnostic procedures, such as fluorescein (FA) and indocyanine green (ICG) angiography, ultrasonography, optical coherence tomography (OCT), and electrophysiologic testing, that can be used as adjunct methods of examining the posterior fundus and retinal function. This technique uses an essential instrument for fundus examination, particularly when a high degree of magnification is desired. It is used in conjunction with a handheld lens or a diagnostic contact lens and provides a high-quality magnified stereoscopic image of the fundus. It is also useful in determining whether the location of a lesion is preretinal (neovascularization, vitreous hemorrhage), intraretinal (cotton-wool exudative spots, flame-shaped hemorrhages), or subretinal (choroidal neovascularization, drusen); in detecting cystoid macular edema; and in diagnosing clinically significant macular thickening. This technique provides optical sections of the vitreous body. If an elevation or depression of a chorioretinal lesion is present, the slit beam on the retina will appear curved rather than straight. In some cases, when there is very little subretinal fluid, illumination of the retinal vessels with the slit beam produces shadows of the vessels at the level of the RPE, indicating the presence of retinal elevation. If a slit beam of the biomicroscope is placed across an elevated retinal lesion, the behavior of the scattered light also provides important diagnostic clues. Often the borders of a small serous detachment or RPE detachment can be made to glow by positioning the slit beam across the elevation, making the lesion easier to demarcate. This technique is useful in evaluating the posterior pole for the presence of a macular hole or for detecting cystic spaces within the retina. Noncontact lens slit-lamp biomicroscopy more often is performed with aspheric 60-, 78-, or 90- diopter lenses. They all produce a real, inverted image for the examiner. The lens is held in front of the patient’s eye, and the slit lamp is used to produce a vertical beam to illuminate the retina. The higher the power of the lens, the less the magnification. This technique is good for the study of the vitreous, retina posterior to the equator, and optic nerve. It has the advantage of not disturbing the cornea, and so it can be used before an angiogram is performed. The difficulty with this method is that the examiner does not have control over the movement of the patient’s eye; and, as with other forms of indirect ophthalmoscopy, the image is inverted.1 Contact lens slit-lamp biomicroscopy should be performed with the patient under topical anesthesia and a coupling gel, which usually is methylcellulose. To place the lens, the patient should look up while the examiner puts the lens in the inferior limbus. Then the patient directs his or her gaze toward the examiner to center the lens on the cornea, thus providing a view of the posterior pole. The Goldmann three-mirror lens is the most common contact lens. Its three mirrors are of different size and angle orientation. The smaller the mirror, the more peripheral image it produces. During the examination, the lens can be rotated 360 degrees so that all areas of the retina and anterior chamber can be evaluated.2 Contact lens biomicroscopy is needed to differentiate a macular cyst from a macular hole. The “slit-beam sign” described by Watzke-Allen3 and later modified by Margherio and colleagues4 is a reliable test. Using a contact lens, a slit-beam light slightly narrower than the lesion is focused on the retina, and the patient is asked to describe what he or she sees. If a complete interruption or an interruption greater than one half the width of the slit is seen, the patient is considered to have a full-thickness hole. No interruption or distortion in the slit correlates best with a pseudohole, or lamellar hole. Panfunduscopic lenses, such as the Rodenstock lens, Volk Quadraspheric, and Mainster lens, are very useful for examination, panretinal photocoagulation, and angiography. Helmholtz introduced the direct ophthalmoscope in 1850, although prior descriptions of primitive tools existed before then; since that time, light sources have evolved from candle to electric light.5 The direct ophthalmoscope is the simplest and most common way to examine the fundus, and it is widely used by medical students and nonophthalmologists. The basic principle of this method consists of illuminating the patient’s fundus and looking at the patient’s retina. The difficulty of this method is to align optically both axes of illumination and observation. Some other disadvantages of this method include the position of the ophthalmoscope close to the patient’s eye, the small field of view, restricted visualization of the periphery, significant media opacities that greater limit the resolution of the images, and finally the monocular image produced. On the other hand, it is a relatively inexpensive and portable device that can be used without pupillary dilation. Magnification of the patient’s fundus can be calculated by considering the dioptric power of the eye, which is about 60 diopters, acting as a magnifier for the retina. This magnifier will be in focus when held one sixtieth of a meter from the retina. By convention, the usual viewing distance is considered to be one fourth of a meter. The ratio of these two fractions expresses the magnification offered by the direct ophthalmoscope: 15 times. Schepens first introduced the binocular indirect ophthalmoscope in 1947, and since that time, it has been the standard ophthalmic instrument for examining the posterior structures of the eye, supplanting the limitations of the direct ophthalmoscope.5 It consists of an illuminating headpiece with modified oculars and an energy source. It is used with a condensing lens, and the field of view (usually 45 degrees) depends on the pupillary dilation and dioptric power of the viewing lens. This method permits stereopsis, examination of the entire retinal periphery (with scleral depression in some cases), and examination through media opacities usually not seen with direct ophthalmoscopy. The principal disadvantage of this method is the learning process necessary to understand the real inverted image produced by this method of examination. To obtain good images, we must adjust the head-piece and eyepieces first. To align each ocular, one must close one eye at a time, followed by setting the illumination in a way that the light fills the superior part of the field of view, thereby avoiding the glare produced by the returning light from the ocular fundus. The patient’s pupils should be dilated, and the condensing lens should be held 2 to 3 inches from the patient’s eye, with its most convex side facing the examiner between the thumb and the first finger. The right hand is free to hold the patient’s eyelids and complete the retinal drawings. The examiner moves the lens slightly toward or away from the eye until the image of the fundus completely fills the lens. The magnification obtained with indirect ophthalmoscopy can be calculated by dividing the dioptric power of the eye by the dioptric power of the viewing lens. For a typical eye and a 20-diopter lens, the magnification is 60/20 or −3 times. The negative sign implies that the image is inverted. The examiner should have a systematic routine to cover all quadrants of the fundus, beginning with the periphery and ending with the posterior pole. Because of Bell’s phenomenon, the patient initially will look up when first confronted with a bright light; so the examiner should start looking at the superior quadrants first, followed by a clockwise examination of the periphery, and ending with examination of the macula. The patient should keep both eyes opened during the examination. If the patient does not respond to verbal direction, the examiner should ask the patient to look at the examiner’s thumb with the fellow eye while being examined. Additional information can be obtained by determining how light diffuses through objects in the fundus using various ophthalmoscopic techniques. This is especially true for fluid-filled structures, such as pigment epithelial detachments. It is also possible to use retroillumination, particularly when using slit-lamp biomicroscopy, to view certain structures in the vitreous. This is an important way to look for inflammatory cells in the posterior vitreous. The plane of focus is shifted a few millimeters or so in front of the retina. Using light reflected from the retina to retroilluminate the vitreous, inflammatory cells are seen as small, dark dots. These same dots are light tan when viewed directly. When using retroillumination, it is easier to find and see a greater number of cells than with direct illumination. In diabetic patients, sometimes microaneurysms are difficult to differentiate ophthalmoscopically from dot hemorrhages. The first are seen as tiny, well-defined lesions, whereas the dot hemorrhages have fuzzier borders and are deeper in the retina. FA may help by showing microaneurysms as hyperfluorescent dots; hemorrhages, on the other hand, are hypofluorescent lesions. It is more difficult to distinguish neovascularization from an intraretinal microvascular abnormality (IRMA). This is particularly true if an IRMA is extensive and neovascularization has not yet developed wheel-like networks or other typical characteristics. IRMAs are shunt vessels between an artery and a vein within the retina, whereas neovascularization forms tufts of vessels, usually from veins, with a tendency to grow in an anteroposterior direction using the vitreous as a scaffold. In these cases, biomicroscopy with a contact lens provides the best way to recognize these features.
Clinical Examination of the Ocular Fundus
Slit-Lamp Biomicroscopy of the Ocular Fundus
Ophthalmoscopy
| Color | Fundus Characteristic |
| Red | Attached retina, retinal arterioles, choroidal vessels, intraretinal hemorrhages, inner portion of retinal breaks (holes or tears). The center of the macula. |
| Blue | Detached retina, retinal veins, outlines of retinal breaks. |
| Green | Vitreous opacities, vitreous hemorrhages, preretinal hemorrhages, intraocular foreign bodies, vitreous membranes. |
| Brown | Uveal tissue, melanomas, border of ora serrata |
| Black | Pigment clumping in or under the retina, demarcation lines, pigmented scars, lattice degeneration. |
Scleral depression can be used to bring the peripheral retina into view in cases where the ophthalmoscopy alone is insufficient or to study the vitreous traction at the vitreous base. It can be done with a metal depressor or with a cotton-tipped applicator. To move the depression circumferentially, the depressor is moved in the opposite direction of the image on the lens because the image is inverted.
The retinal map is the summary of the retinal examination, and the location and different kinds of lesions are standardized by colors (Table 4–1). To draw the lesions, some examiners place the retinal drawing paper on the supine patient’s chest, with the 12 o’clock position toward the feet of the patient. In that way, the drawing represents what is visualized in the condensing lens; at the end, all that must be done is to turn the paper upside down to have the actual drawing. The second outer line on the paper represents the ora serrata, and the equator corresponds to the next innermost ring. The posterior pole is the area defined by an imaginary circle, formed by the radial clock hour marks, and the optic disc is the small circle offset from the center.
Visual Function Diagnostic Tests
The nature of the visual dysfunction may be specific or unique in some inherited dystrophies. Therefore, judicious use of visual function tests might determine both the nature and the site of visual dysfunction and confirm or rule out a diagnosis. These tests measure the visual process at different levels and, combined, offer a noninvasive anatomic dissection of retinal function and dysfunction.
These tests can be divided into two groups: psychophysical tests and electrophysiologic tests. Psychophysical tests are subjective requiring the participation and cooperation of the patient. They include visual acuity, contrast sensitivity, color vision, visual field, dark adaptation, and retinal sensitivity profiles. The first three tests measure central function exclusively, whereas the last three measure central and peripheral function.
The electrophysiologic tests are objective and do not require active participation of the patient. Two electrophysiologic tests, which measure general retinal function, are the electroretinogram (ERG) and electrooculogram (EOG). Two other objective tests that measure central function are the focal ERG, an exclusive test of outer retina, and the visually evoked cortical potential response (VER), a measure of central vision from the receptor back through the optic nerve to the visual cortex. VER can be done in infants as young as 6 months of age.6 Amblyopia or damage in the visual pathways can be determined by comparing the responses from each eye.
The characteristics of an ERG that identify its relative normality are its waveform and its amplitude. Focal abnormalities of the retina reduce the amplitude of the ERG but have little effect on its waveform if the involved area is electrically silent, as in retinal detachment. Diseases that involve the inner retina, such as diabetic retinopathy, result in a loss of oscillatory potentials and the B-wave with relative preservation of the A-wave. Diseases involving receptors usually are associated with a reduction of ERG, and variability in ERG amplitude has been associated with refractive error,7 age,8 sex,8 and pigmentation.9
The EOG is an adjunct to ERG. It is generally abnormal when the ERG is abnormal, but the reverse is not true. An abnormal EOG, for example, with a normal ERG, is the hallmark for Best disease.
The VER represents the responses of the brain to a sudden stimulus. The temporal half of the retina causes a response in the cortex of the same side, the nasal in the contralateral cortex. These responses are summed in the recording, and VER abnormalities can result from abnormalities from the retina, optic tracts, optic radiations, or visual cortex. In persons with advanced retinal disease, such as retinitis pigmentosa, where the ERG may not be recordable, the flash VER may be a useful test for the evaluation of the visual function. In addition, its bright stimulus can be used to advantage in the presence of opaque media, such as vitreous hemorrhage, when it is impractical to perform a standard flash VER or ERG.10
Fluorescein Angiography
Fundus angiography is done with two different dyes, one principally for retinal angiography (i.e., sodium fluorescein) and one for choroidal angiography (i.e., ICG). FA was developed first, and more is known about the correlation between histopathology and angiographic findings with fluorescein than for indocyanine green. Therefore, FA serves as the prototype for learning fundus angiography. ICG angiography has become practical more recently with the development of digital imaging systems, but the significance of many of the indocyanine green angiographic findings is not known with certainty; however, ICG angiography has offered new insights into the pathophysiology of several disease states.
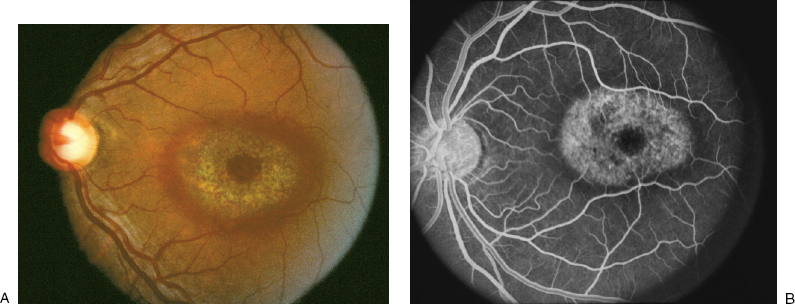
Analysis of the movement of the dye reveals information about blood flow dynamics and in the process also shows the anatomy of the retinal vessels. Certain diseases cause a breakdown in the blood ocular barrier, which results in the presence of fluorescein in areas or structures that ordinarily do not contain fluorescein. These areas then are more fluorescent than they otherwise should be and are called hyperfluorescent (Table 4–2). By convention, leakage of fluorescein into a space results in pooling of the fluorescein, whereas leakage into a tissue causes staining. Hyperfluorescence can also be the result of fluorescein in vascular structures being more easily visible (Fig. 4–1).
| Transmitted fluorescence | Geographic atrophy, Bull’s-eye maculopathy, macular hole, atrophic scars. |
| Leakage | |
| Abnormal vessels | Angiomas, hemangiomas, vascular tumors |
| Choroid | Melanoma, CNV, hemangioma |
| Optic nerve | Peripapillary vascular loops |
| Retina | Occlusive diseases, neovascularization |
| Pooling | Neurosensory detachment, RPE detachment |
| Staining | Scleral, interstitial tissue |
CNV, choroidal neovascularization; RPE, retinal pigment epithelium.
To interpret a fluorescein angiogram properly, it is necessary first to have a good mental picture of how a normal fundus should look. The fluorescein angiogram in question is compared with the mental picture of the normal angiogram. How the two differ offers clues to the pathophysiology involved. The fluorescein angiogram is examined for the principal location of the abnormality, which helps to limit the number of possibilities. Next the pattern of fluorescence is evaluated. Is the principal change hyperfluorescence (Table 4–2) or hypofluorescence (Table 4–3)? Integration of anatomic location and pattern of fluorescence further limit the possibilities. If the angiogram shows hyperfluorescence that seems to be predominantly in the vitreous, for example, the number of possibilities is limited to diseases like proliferative diabetic retinopathy, proliferative sickle cell retinopathy, and other retinovascular diseases.
Fluorescein angiography is used in diabetic retinopathy to evaluate macular edema, capillary nonperfusion, and retinal neovascularization. Although the diagnosis of these entities usually is made by careful ophthalmoscopy, angiography helps to quantify and document the degree of pathology present. This documentation also extends to measuring the response to treatment.
Diabetic patients (Fig. 4–2 and Chapter 12‘s Fig. 12–5) often have a breakdown in the competency of the blood ocular barrier. This is manifested by dye leakage from the retinal capillaries. This leakage occurs in two main forms: The first is leakage from small aneurysmal dilations called, appropriately enough, microaneurysms. Leakage from microaneurysms is seen as focal areas of hyperfluorescence, increasing during the angiographic study, centered on the microaneurysms. Some capillaries leak diffusely throughout their entire length. Patients with diffuse leakage often have boggy maculae with widespread edema. The second form of leakage is from larger areas of capillary nonperfusion found in later stages of diabetic retinopathy. The leakage may come from either the arteries or the veins and is commonly ascribed to consequences of ischemia, even though the arterioles presumably contain oxygenated blood.