CHAPTER 143 Clinical Assessment and Surgical Treatment of Conductive Hearing Loss
An applied understanding of the mechanics of the conductive portion of the auditory periphery and a physiologically directed assessment of the external and middle ear are the cornerstones to optimizing hearing results and minimizing the incidence of complications after surgical reconstruction for conductive hearing loss. This chapter summarizes fundamental physical properties of the conductive portion of the auditory system, outlines an appropriate diagnostic evaluation, and proposes a framework for planning surgical treatment of external auditory canal (EAC) and middle ear defects (Box 143-1).
Box 143-1 Pathologic Conditions Leading to Conductive Hearing Loss
Mechanical Properties of the Conductive Hearing Pathway
Sound Transfer in the Middle Ear
Sound, defined in the physical dimension, is vibratory energy produced by an object that possesses inertia and elasticity. Within the frequency range for human sound perception, 10 Hz to 24 kHz, there are no limitations to the type of vibration required to generate audible sensations of sound, provided that the source moves from one position to the other and back again. Alternating condensation and rarefaction of sound pressure passes through the external ear structures to the tympanic membrane. The speed of the sound wave is proportional to the density of the medium through which it passes.1,2
The acoustic resistance to the passage of sound through a medium is termed impedance. The transduction of vibratory energy from the air in the EAC (low impedance) to the cochlear fluids (high impedance) is possible as a result of the impedance matching function of the middle ear. This complex system consists of frequency-dependent stiffness and inertia reactances, along with a frequency-independent frictional component. Conditions that alter ossicular stiffness, such as otosclerosis, produce prominently low-frequency hearing loss. Changes in the mass of the middle ear structures, classically described as producing high-frequency deficits, actually result in hearing losses that vary according to where the mass change occurs on the tympanic membrane or ossicular chain.3 Tympanosclerosis, which affects the mass and the stiffness of the ossicular chain, results in a flat hearing loss recorded at high and low frequencies.
In 1868, Helmholtz4 defined the principles of impedance matching by the middle ear. He proposed three levers to accomplish the required pressure transformation. The tympanic membrane, which is rigidly fixed at the periphery and mobile centrally, acts as a catenary lever, exerting its force on the malleus handle in response to pressure changes transmitted through the EAC.5 A twofold gain in sound pressure level is generated at the malleus. Although the pars flaccida seems to allow free movement of the malleus head in the epitympanum and may decrease middle ear/external ear atmospheric pressure differences, it has only a minor acoustic role in humans.6
The ossicular lever is produced when the incus and the malleus rotate as a unit around an axis extending from the anterior mallear ligament through the incudal ligament.7 The ossicular lever taken alone produces a small mechanical advantage for sound transmission. Further studies by Tonndorf and Khanna5 showed the catenary lever was tightly coupled to the ossicular lever because the tympanic membrane is extensively adherent to the malleus handle. Corrected calculations revealed a combined catenary and ossicular lever ratio of 1 : 2.3. According to studies done on fresh cadaver human temporal bones, the mean sound pressure gain produced by the human middle ear is 26.6 dB, and is centered around its resonant frequency (0.9 to 1 kHz). Beyond 1 kHz, the pressure gain measured at the stapes footplate decreases at a rate of −8.6 dB/octave.8
The hydraulic lever assists the transmission of the sound pressure, which is collected over the larger tympanic membrane and passed on to the much smaller stapedial footplate. For the hydraulic lever to be functional, the stapes should move in a “piston-like” fashion, which has been elegantly described by Guinan and Peake.9 The increased force is proportional to the ratio of the areas of the tympanic membrane to the footplate. The area of the tympanic membrane is approximately 85 mm2, and that of the stapes footplate is 3.2 mm2.10 After studying 43 human temporal bones, Saunders11 concluded that the “areal ratio” was the most important component of the middle ear impedance matching system. Ratios varied from ear to ear, but averaged 20.8 : 1.
The pinnae gather sound from an arc of 135 degrees relative to the direction of the head and increase sound pressure by 6 dB. They reject sounds arriving from the rear, which assists in the determination of sound origin.2 The EAC is a closed cylinder approximately 2.5 to 3.5 cm in length. Because ear canal resonance occurs at a frequency whose wavelength is four times the canal length, the corresponding resonant frequency is roughly 3500 Hz. The addition of the conchal component of the pinna increases the EAC length, resulting in a lower resonant frequency, which has been measured at 2700 Hz. The overall increase in sound pressure transduction caused by external ear structures and measured at the tympanic membrane is estimated at 15 to 22 dB.10,12
Specific Defects in the Conductive Auditory Periphery and Resultant Hearing Loss
In his 1978 review, Austin1 identified five categories of anatomic defects in the middle ear sound-conducting system and described each within the context of the associated prototypic hearing loss (Table 143-1). In the first category, tympanic membrane perforation with undisturbed ossicular continuity produced a hearing loss that was linearly proportional to the size of the perforation (loss of areal ratio plus loss of catenary lever). The degree of hearing loss, flat across speech frequencies, was not altered by the location of the perforation on the drumhead.
Table 143-1 Specific Lesions of the Conductive Apparatus and Associated Hearing Loss
| Classification | Component Disrupted | Expected Loss (dB) |
|---|---|---|
| Perforation of tympanic membrane | Loss of areal ratio, catenary lever | Proportional to size of perforation |
| Perforation of tympanic membrane with ossicular interruption | Hydraulic lever, areal ratio, catenary lever | 38.3 |
| Total loss of tympanic membrane and ossicular chain | Hydraulic lever, areal ratio, catenary lever, phase cancellation | 50 |
| Ossicular interruption with intact tympanic membrane | Hydraulic lever, areal ratio, catenary lever, phase cancellation, reflection of sound energy away from middle ear at tympanic membrane | 55-60 |
| Ossicular interruption with intact tympanic membrane and closure of oval window (distinct congenital malformation) | Hydraulic lever, areal ratio, catenary lever, phase cancellation, reflection of sound energy away from middle ear at tympanic membrane | 55-60 |
From Austin DF. Sound conduction of the diseased ear. J Laryngol Otol. 1978;92:367; and Austin DF. Acoustic mechanisms in middle ear sound transfer. Otolaryngol Clin North Am. 1994;27:641.
The fifth category described various congenital malformations with ossicular disruption and closure of the oval window; also included were cases of obliterative otosclerosis with closure of the oval and round windows behind an intact drum. The expected flat loss from such a defect is 60 dB.2
Diagnostic Evaluation
The Weber test is effective in lateralizing hearing loss. The fork is gently struck by the examiner and placed on the forehead or on the vertex of the skull, and the patient states on which side he or she hears the tone more clearly. Placement of the tuning fork over the nasal bones or on the teeth may present a stronger stimulus for Weber testing in difficult-to-test patients.13 Lateralization of the tone represents either a conductive loss ipsilateral to the side of localization or a sensorineural loss greater in the contralateral ear. The 256-Hz tuning fork is the most sensitive of the available frequencies,14 but it can yield an unacceptable number of false-positive results. The most clinically useful single fork is the 512-Hz fork.15
Rinne testing using all three fork frequencies can accurately estimate the conductive component of a hearing deficit (Table 143-2).16 The test is performed by activating the tuning fork and by placing it firmly on the skin over the cribriform area of the mastoid bone. When the tone can no longer be heard, the fork is placed, tines oriented parallel to the head/frontal plane, in front of the meatus of the EAC. The patient indicates whether the tone is present or absent. A negative or abnormal Rinne result is found when bone conduction is perceived longer than air conduction. A positive, or normal, result occurs when the air conduction is greater than bone. Tuning fork testing should be carried out in any patient before surgery for a conductive anomaly to verify audiometric results and to establish a baseline for comparison for postoperative assessment.
Table 143-2 Degree of Hearing Loss Estimated by Rinne Testing
| Rinne Test Result* | Estimated Conductive Loss (dB) |
|---|---|
| Negative, 256 Hz | Mild conductive loss of 20-30 |
| Positive, 512 Hz and 1024 Hz | |
| Negative, 256 Hz and 512 Hz | Moderate conductive loss of 30-45 |
| Positive, 1024 Hz | |
| Negative, 256 Hz, 512 Hz, 1024 Hz | Severe conductive loss of 45-60 |
* Negative Rinne test = bone conduction greater than air conduction (abnormal). Positive Rinne test = air conduction greater than bone conduction (normal).
From Miltenburg DM. The validity of tuning fork tests in diagnosing hearing loss. J Otolaryngol. 1994;23:254.
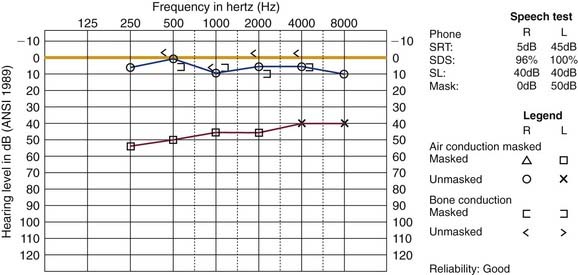
Pure-tone audiometry and speech testing follow in the workup. The diagnosis of a conductive loss is made in the presence of an air-bone gap on the pure-tone audiogram with speech testing commensurate to the results measured audiometrically (Fig. 143-1). Concurrent sensorineural deficits should be noted. Falsely depressed bone-conducted hearing levels can present in patients with ossicular abnormalities secondary to earlier discussed impedance mismatching.1
Stay updated, free articles. Join our Telegram channel

Full access? Get Clinical Tree


