and Wolfgang Drexler2
(1)
Center for Medical Physics and Biomedical Engineering, Medical University of Vienna, Waehringer Guertel 18-20/4L, Vienna, A-1090, Austria
(2)
Center for Medical Physics and Biomedical Engineering, Medical University of Vienna, General Hospital Vienna, Vienna, Austria
In the light of vast evidence, it is well accepted that there is choroidal involvement in the pathogenesis of many ocular diseases of the posterior pole. Histology of choroidal thickness (ChT) has revealed increased ChT correlated with a higher density of vessels in the superficial choroidal layers in open angle glaucoma [1], atrophy to choroidal capillary structure [2], and neovascularization in the choriocapillaris [3, 4] in aging and in age-related macular degeneration. Histological studies investigated biological structures in the eye with comparable high resolution to optical coherence tomography, but these were accompanied by preparation artifacts, shrinkages, and lack of blood supply to sustain vasculature volume [5]. Clinically the choroid is visualized by indocyanine green angiography, the insertion of a dye into the bloodstream that will stain blood vessels, even capillaries. This method shows alterations of choroidal vascular filling time and morphology already in elderly healthy subjects [6]. However, it lacks the third dimension and its use can be toxic and there is a risk of mortality.
Commercial OCTs at 800 nm are clinically used to image the retina and when used for choroidal imaging have a success rate of 74 % for reliably showing choroidal/scleral interface [7]. With the introduction of enhanced depth imaging (EDI) into commercial OCT systems, a new clinical investigation method for the choroid was presented [8]. Applying EDI, commercial OCT devices demonstrate choroidal penetration in scanned volumes only in thin choroids or by limiting imaging to few two-dimensional scans [8–10].
Recent interest in the choroid led a study with 3D-1,060 nm-OCT investigate choroidal thickness confined to central and four peripheral measurement locations in a healthy Japanese population [11]. However, analyzing the measurement at several image locations neglects the remaining data collected over the entire imaged field. Therefore, a method for mapping choroidal thickness needed to be developed that enabled statistical analysis of the entire imaged volume. The first study of choroidal visualization performance aimed to quantify the complete 3D-1,060 nm-OCT scan with ChT-maps in healthy subjects.
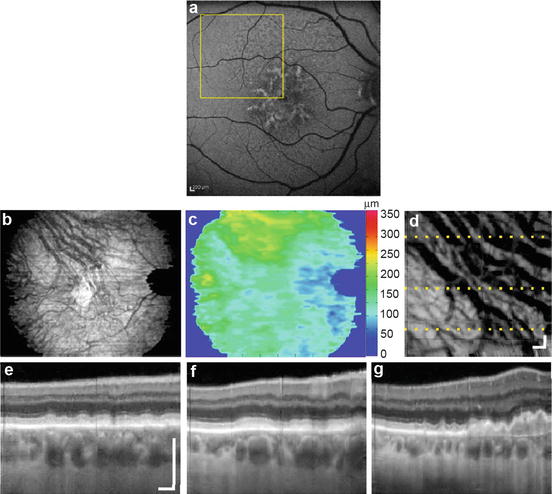
In a study with 34 healthy subjects, three-dimensional (3D) OCT volumes were acquired at 1,060 nm with 15–20 μm transverse resolution, about 7 μm axial resolution and 512 voxel per depth scan. For ChT-maps, a field of 36° × 36° scans with each degree corresponding to ∼288 μm [12], centered on the fovea, was used. The OCT volume was averaged in both transversal directions within a field of ∼1° to remove speckle and increase sensitivity. Axial ChT was defined as the distance between the center of the peaks originating from the RPE/Bruch’s membrane/choriocapillaris (RBC) complex [13] and the choroidal-scleral interface (CSI). For the investigation of the ChT variation throughout the entire field of view, thickness maps were generated based on manual segmentation with segmentation in every 4th tomogram at the RBC complex and the CSI (Fig. 60.1). Two-dimensional ChT-maps, generated by local subtraction of the segmented height profiles were smoothed by transversal filtering, and splining between the slices, followed by a final two-dimensional median filter using a 15 × 15 kernel size. The resulting pixel distance was converted into optical distance using the depth sampling calibration for the 1,060 nm OCT system and further to physiological distance using a group refractive index of n = 1.4 (based on the refractive index of blood). This resulted in thickness maps for individual eyes.
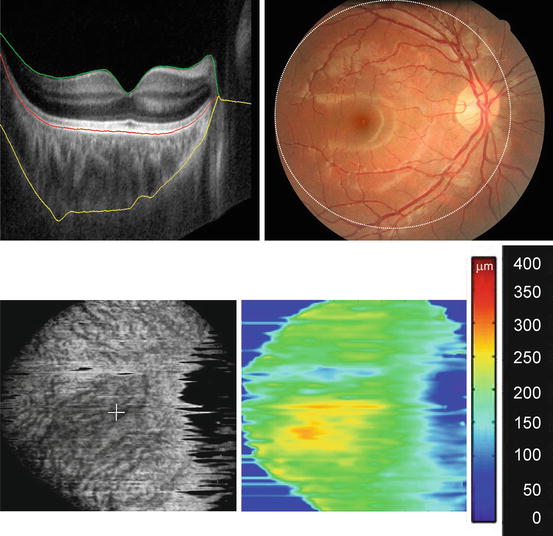
Fig. 60.1
1,060 nm OCT and choroidal thickness map generation in an example of automatic choroidal segmentation (yellow line border between sclera and choroid, red line RPE-Bruch’s membrane/choriocapillaris complex, green line retina/vitreous interface). OCT image is taken within the area circled in fundus photograph. Choroid is segmented and averaged shown enface (lower left image) Choroidal thickness map generated for a healthy eye (lower right image)
For the statistical analysis of mean and variation of the ChT-maps of individual with similar ametropia, all the maps were aligned to each other in respect to the macula and optic nerve position with Matlab software (The MathWorks, Inc., Natick, USA). After correcting for differences in transversal area size with axial eye length (AL), an intensity overlay was introduced to exclude unreliable portions of the images with less than five measurements at one location. The images were evaluated along the depth-scan direction. ChT-maps were grouped by considering the eyes’ refraction as myopic (AL ≥ 24.5 mm, n = 16), emmetropic (24.5 > AL ≥ 23.4 mm, n = 20), or hyperopic eyes (AL < 23.4 mm, n = 28) based on the normal AL variation with refraction and age [14–16]. Groups are described as characteristically myopic (long ALs), emmetropic (mid-length eyes), and hyperopic (short eyes). Mean and SD was obtained to create a compound map of average thickness for these three groups of eyes with color-coded thickness. For illustrating the location and extent of variation in the data sets, the coefficient of variation was found useful to allow comparison of widely different means. The coefficient of variation is expressed in percentage of the standard deviation from the mean.
Central ChT was measured beneath the fovea. Hyperopic eyes had a central ChT of 358 ± 96 μm (mean ± SD) and had the thickest choroid inferiorly but still within a 1,500 μm distance from the center. Emmetropic eyes had a ChT of 341 ± 95 μm, while myopic eyes had the thinnest choroid of the three groups with a central ChT of 213 ± 58 μm (P < 0.001, ANOVA, Bonferroni post-hoc testing) and an increase of thickness about 1,500 μm superior to the center (Fig. 60.2). The coefficient of variation was lowest in hyperopic eyes being less than 30 % over the majority of the ChT-map area. This study revealed also a decrease of ChT with age at the central and inferior location in eyes with longer ALs typically associated with myopia which is in agreement with the findings of other investigators [8, 11]. The mean of this study was much higher than found in studies with commercial systems (Table 60.1).
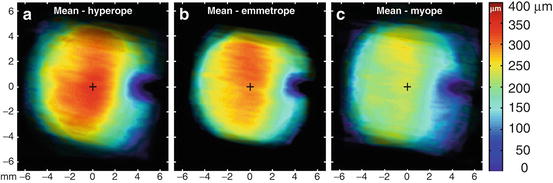
Fig. 60.2
Choroidal thickness maps grouped by axial eye length (AL) show a decrease in thickness mean with increasing AL (hyperope: AL<23.4 mm N = 28 eyes, emmetrope: 24.5> AL ≥23.4 mm N = 20 eyes, myope: AL ≥ 24.5 mm N = 16 eyes) [20]
Table 60.1
Choroidal thickness in healthy subjects measured with different OCTs
Investigators | Methods | Central choroidal thickness (mean ± SD) |
|---|---|---|
Manjunath et al. [7] | Commercial OCT at 800 nm | 272 ± 81 μm |
Margolis and Spaide [8] | Commercial OCT with enhanced depth imaging at 800 nm | 287 ± 76 μm |
Zhang et al. [31] | Commercial OCT at 800 nm | 172.1 (95 % CI 163.7–180.5) μm |
Ikuno et al. [11] | Long wavelength OCT at 1 μm | 354 ± 111 μm |
Esmaeelpour et al. [20] | Long wavelength OCT at 1,060 nm | 315 ± 106 μm |
The healthy retina with macula and in its center, the fovea, has a structure that is accessible to localized averaged measurement: starting with the fovea centralis as an important measurement point and widening in concentric rings as suggested by the ETDRS study grid [17]. The ETDRS grid lends itself for measuring the choroid within the macula region, since the choroid is a major supplier of the macula and its measurement is in this region of foremost interest [18]. However, the choroidal structure is unlike the retinal structure mainly a network of vessels with a characteristic segmental structure [19]. Choroidal thickness between the nasal, temporal, superior, and inferior fundus is distributed differently depending on age and AL [20]. Therefore, mapping in a region beyond the macula may allow a superior analysis. However, manual mapping is time consuming even if used only for research data.
60.1 Automatic Choroidal Thickness Segmentation
There are several challenges to automated choroidal segmentation. The first challenge is the low signal-to-noise ratio within the choroid and a washed out and irregular interface to the sclera. That is why previous OCT segmentation algorithms developed for the retina do not perform well with respect to choroidal segmentation requirements. Retinal segmentation algorithms vary depending on the number of layers to be segmented and on their robustness in the presence of speckle, shadows, morphologic irregularities (i.e., vessels, physiologic structural changes at the fovea and optic nerve head), and pathological changes in the tissue. In general most of the existing approaches tend to be very sensitive to noise or missing data and often rely on well-contrasted boundaries or uniform layer structure. Intensity threshold-based algorithms utilize simple analysis along the depth scan’s intensity profiles or find borders by investigating intensity gradients and are frequently confused by missing data, which leads to nonphysiologic results [21–26], thus, making them unsuitable for choroidal segmentation.
The second challenge is not being able to compare OCT images to the choroid itself in vivo for determining the true interface. One can only compare between different imaging modalities. Torzicky et al. segmented automatically in polarization-sensitive (PS) OCT images determining the anterior boundary of the choroid, the RPE, based on depolarization, and the posterior boundary, the CSI, based on the birefringence of the sclera [27]. The exact interface between choroid and sclera became subject to controversy because automatic segmentation of PS OCT images seems to overestimate choroidal thickness when compared to intensity based OCT imaging.
Kajic et al. achieved a robust automated choroid segmentation by using a statistical model that was built upon training data from manual segmentations by human operators [28]. Its advantage is that it can actively learn and determine the segmentation line in a low-signal, noisy environment such as in OCT tomograms in the region of the choroid without having to rely on boundary edge information. Statistical models can reproduce specific patterns of variability in shape and texture by analyzing the variations in shape across the training set. The key step of the statistical model training is the dimensionality reduction of the large set of features from the training data set. This is to enable the computational cost of the optimization method that is used to fit the model to the real data later on. The idea behind this concept is to find statistical dependencies between the produced features and reduce the dimensionality of the space by identifying only a certain number of the most prominent properties in the data set, represented by the most important eigenvectors.
To lower dimensions and to reduce multidimensional data sets for analysis, principal component analysis (PCA) is used. It is the standard vector space transform technique. It operates by calculating the eigenvalue decomposition of a data covariance matrix or singular value decomposition of a data matrix. Ideally, a relatively small number of eigenvectors with greatest eigenvalues can completely describe the original data.
The resulting pixel distance was converted into optical distance using the depth sampling calibration for the 1,060 nm OCT system and further to the anatomical distance. This resulted in thickness maps for individual eyes. Choroidal segmentation performed with a statistical model had as little as 13 % difference to manual segmentation, an error rate computed per tomogram, in a total of 871 tomograms, as a ratio of incorrectly classified pixels and the total layer surface. The reported difference between automated and manual retinal segmentation was comparable to the difference between manual and automated segmentation in the choroid [29]. Interobserver variability, measured by reimaging seven subjects (five healthy and two with dry AMD pathology) and comparing automatic segmentation of subfoveal ChT, ranged between 0 % and 10 % with a median of 1 % difference between the first and the second image [30]. Segmentation proved reliable even in the presence of low signal (thick choroid), retinal pigment epithelium (RPE) detachments and atrophy, drusen, shadowing, and other artifacts.
Choroidal segmentation developed by other investigators [31] since uses vessel segmentation to identify the lower boundary of the choroid and envelope a surface to the lower vessels segmentation with a thin plate spline (TPS) approach [32]. While the segmentation is working, the main drawback responsible for a high rate of reported non-repeatability seems to be imaging OCT at 800 nm and not achieving the depth penetration needed for imaging the choroid.
60.2 Automatic Segmentation in Pathology
The generation of choroidal thickness maps was developed and applied first for normal healthy subjects to build a normative base. The choroid may be a novel biomarker for the major blinding eye diseases such as age-related macular degeneration and diabetes retinopathy. Statistical analysis using thickness maps in healthy proved practical to isolate areas of thinning or thickening and the extent of thickness alteration with axial eye length beside the classical measurement in the macula center. By illustrating how much a thinner choroid is related to an increasing AL, it becomes obvious that in studies of the choroid pathological eyes need to be matched not only by age but also by AL. Choroidal thickness mapping has also been established for swept source OCT, although segmented manually and investigators suggested applying the grid used by the Early Treatment Diabetic Retinopathy Study (ETDRS) [17] to facilitate reading of thickness values per area [33].
The use of choroidal thickness mapping was extended from healthy subjects to subjects with diabetes type 2 with a range of mild to clinically significant diabetic maculopathy [34]. A significantly lower choroidal thickness than healthy controls (P < 0.05) was found. Similarly in subjects with type 1 diabetes, choroidal thickness was reduced when compared to normal healthy subjects (Fig. 60.3) [30]. In type 1 diabetes choroidal thinning was not related to blood glycated hemoglobin or disease duration.
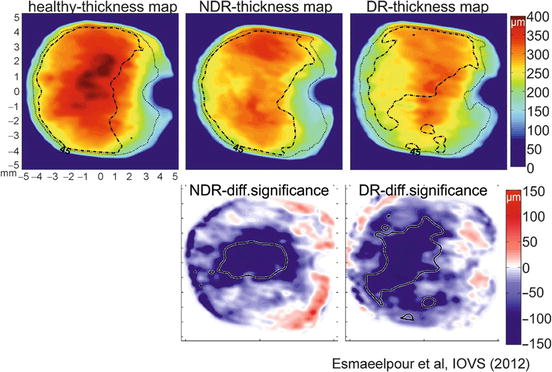
Fig. 60.3
Choroidal thickness and statistical difference contour maps in type 1 diabetes: choroidal thickness maps averaged for two disease stage groups compared with a healthy control group demonstrate that thickness is significantly decreased in NDR and DR group (NDR no diabetic retinopathy, DR diabetic retinopathy, first row averaged thickness maps with broken contour line representing 30 % variation), lower row; difference maps with central area of thinning, contour line represents P < 0.05
Capillary dropout in eyes with diabetes retinopathy is well documented [2, 35]. With current commercial OCTs, the choriocapillaris is not discernible as it is below the axial resolution of the present 800 and 1,060 nm instruments [36]. The magnitude of choroidal thickness alterations visualized in diabetes studies using thickness maps exceeds possible capillaries change [2, 37]. In both types of diabetes, choroidal thickness change is also present when clinical signs preceding retinopathy such as microaneurisms are not visible in the retina. This may suggest its role in hypoxia-induced injury and ischemia in the retina [38].
Vascular impairment in the choroid is also accounted for ischemia’s role in AMD [39, 40]. A preliminary study on subjects with early AMD changes showed a decrease in choroidal thickness [41]. Drusen are deposits below the RPE and their presentation and area are suggested as biomarker for advancing into neovascular AMD [42] and have been associated with choroidal blood flow changes [43]. However, there are no studies with direct association with the choroid below the affected areas.
Another type of deposit associated with AMD are reticular pseudodrusen, which are granular hyper-reflective deposits in the subretinal space [44] suggested to be markers for inflammatory or atrophic vascular changes of the choroidal stroma [45, 46]. Using choroidal thickness mapping in 25 subjects with various types of AMD and pseudodrusen, we found a similarity between the shape of the affected area seen in autofluorescence images and areas with thicker choroid (Fig. 60.4). Thickness map observations show that choroidal areas coinciding with pseudodrusen area are thicker than other choroidal locations [47]. Using choroidal subfoveal thickness to relate to pseudorusen may be misleading as it is more likely to be associated with the severity of AMD rather than pseudodrusen.