Fig. 55.1
Corneal OCT images obtained with three possible scan geometries. (a) Divergent “sector” scan geometry. (b) A corneal image taken with a retinal OCT scanner using the sector scan geometry. The scan width was 3 mm. Note weak reflections outside of the central 1 mm and obvious motion artifacts in the corneal contour. (c) Concentric or “arc” scan geometry. (d) An OCT image taken with an arc-scanning OCT prototype. The scan width was 4 mm. Note the obvious motion artifact. (e) “Rectangular” or “telecentric” scan geometry. (f) An OCT image taken with the wide-field anterior segment OCT prototype with rectangular scan geometry. The scan width was 10 mm
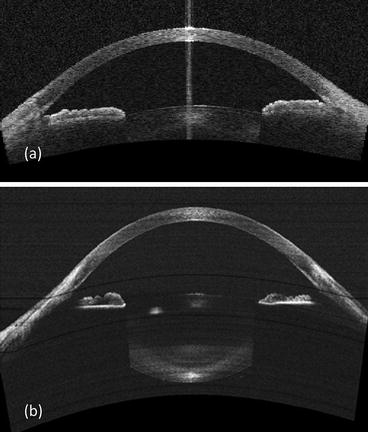
Fig. 55.2
Wide-field anterior eye scans obtained with a time-domain OCT (a) and a swept-source OCT (b)
Combining the rectangular scan geometry and the 1,310 nm wavelength Izatt anterior segment OCT engine, Professor David Huang collaborated with Professor Izatt’s laboratory and developed a practical anterior segment OCT scanner. It can provide angle-to-angle wide-field full-range anterior eye scans (16-mm scan width and up to 8-mm scan depth in air) containing the cornea and the crystalline lens in the same image (Fig. 55.2a). The rectangular scan readily gave accurate biometric measurements such as the anterior chamber depth and width [12]. Later we used an anterior segment OCT prototype system (Carl Zeiss Meditec, Inc., Dublin, CA) with similar performance to map 10-mm diameter corneal thickness (pachymetry) with high repeatability [13].
The original OCT technology is now classified as time-domain OCT, in which the reference mirror is moved through a range of delay, and the resulting inference patterns between the sample and reference beams are processed into an axial scan. The scanning speed in time-domain OCT is limited by having to physically cycle the reference mirror through the delay range. These systems can only collect a few thousands of axial scans per second. At this speed, quantitative corneal shape measurements such as the corneal topography are not possible due to the limited sampling rate and the influence of the eye movement. Luckily, new generation Fourier-domain OCT technology has been developed to speed up image acquisition. In Fourier-domain OCT, the reference mirror is stationary, and the axial scan is generated by Fourier transformation of spectral interference patterns between the sample and reference reflections. Advantages of Fourier-domain OCT include improvements in scanning speed and signal-to-noise ratio that are achieved through elimination of reference mirror movement and simultaneous detection of reflections from all layers of the target. There are two main ways of designing and constructing Fourier-domain OCT instruments. The first one is called spectrometer-based (or spectral-domain) OCT, in which the interferometric signal is detected by a spectrometer equipped with a high-speed line scan detector, such as a charge-coupled device (CCD) or complementary metal oxide semiconductor (CMOS) line camera. Spectrometer-based OCT systems capable of 6,700–310,000 axial scans per second were reported [14–16]. The second one is called swept-source OCT, which uses high-speed tunable lasers [17]. Swept-source OCT offers several advantages over spectrometer-based OCT, including reduced fringe washout, lower sensitivity roll-off with imaging depth, and longer imaging range, higher detection efficiencies [18]. The introduction of Fourier domain mode locking (FDML) enabled dramatic increases in sweep speeds by using a long fiber optic delay line in the laser cavity [19]. Anterior segment swept-source OCT instruments with imaging speed of 100,000–400,000 axial scans per second enabled 3D imaging of the entire cornea in 500–125 ms [18, 20, 21].
The increased sensitivity of both Fourier-domain OCT system designs comes at the price of limited usable imaging depth. The symmetric overlapping image artifact in Fourier-domain OCT images, referred to in the literature as the complex conjugate or mirror image artifact, occurs whenever the sample imaging depth spans both positive and negative distances compared with the length of the set reference path in the Fourier-domain OCT interferometer [22]. Practical 840 nm hybrid retinal/corneal Fourier-domain OCT systems have sufficient speed and sensitivity for anterior segment imaging. However, their maximum imaging depth and width are usually limited to approximately 2 and 6 mm due to scanning optics optimized for retinal imaging. Dedicated Fourier-domain OCT corneal imaging systems allow both high speed and wide field of scan. Extended imaging depth can be achieved using full-depth (complex conjugate ambiguity resolution) or swept-source technology (Fig. 55.2b) [14, 15, 21].
55.1.2 Wavelength Affects Resolution and Penetration
Due to the technological limitations of detectors and accessibility of light sources, three optical frequency windows are commonly used in OCT imaging: centered at 840, 1,050, and 1,310 nm, respectively. An optimal choice of the OCT working wavelength depends on the application of interest. The axial resolution of an OCT system is proportional to the square of the central wavelength and inverse proportional to the bandwidth of the light source. Therefore, the shorter wavelength and broader bandwidth provide better resolution. To achieve maximum axial resolution (1–4 μm), for example, in retinal imaging, a spectral window centered at 840 nm is typically used. To get information from deeper layers with relatively high axial resolution of 6–15 μm, say, imaging of the anterior segment of the human eye, broadband light centered at 1,310 nm can be applied. OCT imaging with the central wavelength of 1,050 nm usually provides medium axial resolution of 4–10 μm [23].
On the other hand, OCT has a limited ability to image through opaque tissue due to signal attenuation by scattering. Scattering is wavelength dependent – the shorter the wavelength, the greater the scattering. In other words, longer wavelength gives deeper penetration. For scattering objects much smaller than infrared wavelength (i.e., collagen fibrils), scattering scales inversely with the fourth power of wavelength (the Raleigh approximation) [24]. Based on this approximate upper limit, the penetration of 1,310 nm light could be as much as six times deeper than that of 840 nm light. Indeed, we observe that 1,050 nm and 1,310 nm OCT is able to penetrate limbal tissue to visualize the scleral spur and angle recess (Fig. 55.3b, c), while 840 nm OCT cannot (Fig. 55.3a).
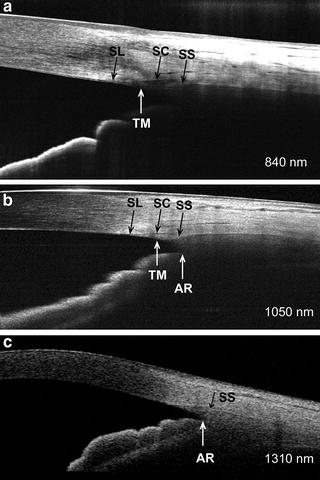
Fig. 55.3
A comparison of the anterior chamber angle imaged with 840 nm (a), 1,050 nm (b), and 1,310 nm (c) OCT systems. AR angle recess, SC Schlemm’s canal, SL Schwalbe’s line, SS scleral spur, and TM trabecular meshwork
Moreover, light at the 1,310 nm wavelength is strongly absorbed by water – resulting in a retinal exposure that is less than 7 % of the power incident on the cornea (Fig. 55.4). In contrast, almost the entire 840 nm wavelength light that strikes the eye reaches the retina unabsorbed. Because most 1,310 nm light does not reach the sensitive retinal tissue, much higher power levels can be safely used on the eye. The eye exposure limit set by the American National Standards Institute (ANSI) [25] for extended eye exposure is 15 mW for 1,310 nm wavelength, compared to 0.7 mW for 840 nm wavelength. The ability to use 20 times more power for corneal and anterior segment OCT imaging means that scanning can be performed 20 times faster without sacrificing signal level.
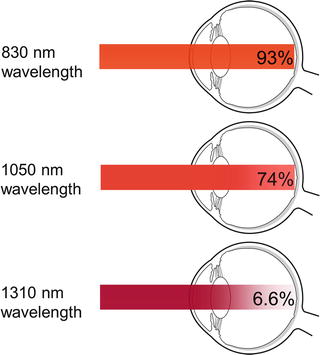
Fig. 55.4
Illustration showing the attenuation of light in the average eye in a single pass from the cornea to the retina. The calculations are based on 22 mm of water in front of the cornea
55.1.3 Commercial Anterior Segment OCT Systems
The first commercial version of anterior segment OCT instruments (Visante and SL-OCT) introduced to the market in 2005/2006 was time-domain OCT systems. Later, Fourier-domain OCT systems (RTVue, Cirrus, Spectralis, Envisu, Casia, etc.) with speeds between 17,000 and 52,000 axial scans per second became available (Table 55.1). All current commercial anterior segment OCT systems operate in the near infrared, at either 840–870 or 1,310 nm. The longer wavelength of 1,310 nm penetrates more deeply through the sclera, limbus, angle, and iris. The shorter wavelength range of 840–850 nm cannot penetrate the sclera or iris, but can offer much higher resolution (Table 55.1). The 1,310 nm systems cannot perform retinal imaging due to water absorption in the vitreous medium. The 840–850 nm OCT systems are generally capable of both anterior segment and retinal imaging. However, the hybrid retina/cornea platforms have limited anterior segment imaging width. To image the entire width and depth of the anterior chamber, dedicated anterior segment scanning optics are necessary (Visante, SL-OCT, Casia, in Table 55.1).
Table 55.1
Commercial OCT systems capable of anterior segment imaging
Manufacturer | Device | Axial resolution (μm) | Wavelength(nm) | Speed (A-scan/second) | Type |
|---|---|---|---|---|---|
Bioptigen | Envisu | 3 | 840 | 17,000 | Fourier domain |
Carl Zeiss Meditec | Visante | 18 | 1,310 | 2,000 | Time domain |
Carl Zeiss Meditec | Cirrus | 5 | 840 | 27,000 | Fourier domain |
Heidelberg | SL-OCT | 18 | 1,310 | 200 | Time domain |
Heidelberg | Spectralis | 3.9 | 870 | 40,000 | Fourier domain |
Optopol | Copernicus HR | 3 | 850 | 52,000 | Fourier domain |
Optovue | RTVue-CAM | 5 | 840 | 26,000 | Fourier domain |
Optovue | iVue | 5 | 840 | 26,000 | Fourier domain |
Tomey | Casia | 10 | 1,310 | 30,000 | Fourier domain |
55.2 Diagnostic and Surgical Applications
55.2.1 Mapping of Corneal Thickness
The measurement of corneal thickness (pachymetry) has important diagnostic and surgical applications. Central corneal thickness is routinely used to monitor corneal edema and endothelial function [26–29], manage ocular hypertension [30, 31], and plan common keratorefractive surgeries such as laser in situ keratomileusis (LASIK) and photorefractive keratectomy (PRK).
Ultrasound pachymetry [32, 33] and several other techniques [34–37] provide only spot measurements, while scanning-slit optical pachymetry [38, 39], very high-frequency ultrasound imaging [40, 41], and optical coherence tomography allow mapping of a wide area of the cornea. Pachymetric mapping provides several advantages over spot measurements. Mapping can reveal abnormal patterns such as keratoconus and pellucid marginal degeneration. It also allows preoperative planning for surgeries that do not primarily concern just the center of the cornea, such as astigmatic keratotomy, intracorneal ring segment implantation, phototherapeutic keratectomy (PTK), and lamellar keratoplasty.
We used a time-domain anterior segment OCT prototype (Carl Zeiss Meditec Inc.) to study corneal thickness mapping [13]. The prototype is similar in performance to Zeiss Visante™ model which was approved by FDA in 2005. It operates at a wavelength of 1,310 nm with a scanning speed of 2000 axial scans per second. The cornea was scanned with 10-mm radial lines on 8 meridians centered on the vertex reflection. Each meridional line consisted of 128 A-scans. The entire scan pattern had 1,024 A-scans and was acquired in approximately 0.5 s. A cross-sectional OCT image is illustrated in Fig. 55.5a.
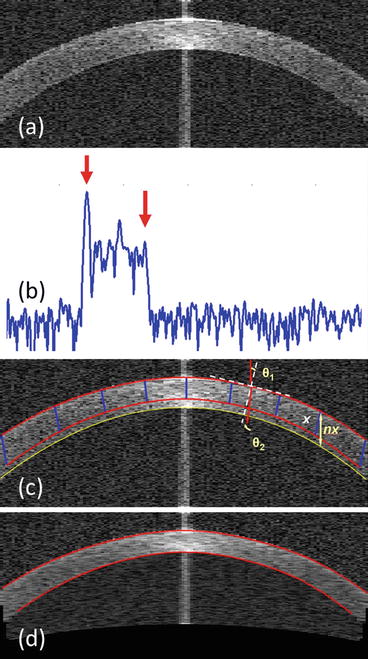
Fig. 55.5
OCT corneal thickness measurement. (a) Cross-sectional OCT image on a corneal meridian. (b) An OCT axial scan from pericentral cornea plotted on a logarithmic scale. The arrows mark the signal peaks at the anterior (left) and posterior (right) corneal boundaries located by the automated algorithm. (c) “Dewarp” to correct the image distortion due to refraction and transition of the corneal group index at the air–corneal interface. The OCT beam reached the cornea with incident angle θ1 and refracted by angle θ2. The yellow double arrowhead line represents the optical path length nx that OCT records. The blue lines indicated the physical distance x that the OCT beam travels in tissue. (d) Dewarped OCT cross section overlaid with detected corneal boundaries
An automated computer algorithm was developed to locate the anterior and posterior corneal surfaces by identifying the signal peaks at the air–tear film and cornea–aqueous interfaces on each A-scan (Fig. 55.5b).
OCT uses light to probe the eye. The light changes its propagation direction at the interface between air and cornea due to refraction and causes significant distortion in OCT images. Image distortions due to refraction may also occur at other tissue index transition surfaces such as the cornea–aqueous interface. Moreover, OCT records the optical path length that the light travels rather than the physical dimensions. So a “dewarp” algorithm is needed to correct the beam refraction and to transform optical delay into actual physical dimensions (Eq. 55.1).
where x is the physical distance, and n is the group index of the medium.
(55.1)
Westphal et al. reported a backward transformation method using Fermat’s principle by finding the minimum path to the corrected pixel [42]. They used backward transformation instead of forward transformation because the raw image in their study was distorted by the sector scan geometry, and in turn the incidence angle calculation was difficult. The anterior segment OCT prototype used in our study had a rectangular scan geometry (Fig. 55.1e, f). The normal of the interface and the incidence angle of the beam could be easily defined once the refraction interface is located. Therefore, a forward transformation using Snell’s law was used for “dewarping” in our studies [22, 43]. The normal and the incidence angle (θ 1 in Fig. 55.5c) was calculated at each axial scan location (i.e., column of pixels). The beam propagating direction passing the interface was decided by θ 2.
According to Snell’s Law: n 1 sin θ 1 = n 2 sin θ 2
We have
where n 1 is the refractive index of the first medium, which equals 1.0 for air; n 2 is the group index of the second medium, which is 1.389 for human cornea (n cornea ) at 1.3-μm wavelength [44].
(55.2)
The axial difference between the anterior (red line) and posterior (yellow) corneal surfaces represents the optical path length through cornea (nx, denoted by a yellow double-head arrow in Fig. 55.5c). The raw axial scans were then resampled along the refraction directions with a scaling factor of 1/n cornea . Figure 55.5d showed an example of corneal OCT image after “dewarping.”
Corneal thickness was measured from the dewarped image (Fig. 55.5d) as the distance between the anterior and posterior surfaces along lines perpendicular to the anterior surface. A corneal thickness profile was generated from each meridional cross section. The computer algorithm registered the eight corneal cross sections and computed the corneal thickness (pachymetry) map by interpolation. The pachymetry map was presented on a banded color scale (Fig. 55.6). The map was divided into zones and sectors. The sector mean, maximum, and minimum pachymetry measurements within a diameter (D) less than 7 mm were computed. Reproducibility was assessed by the pooled standard deviations of the repeated measurements.
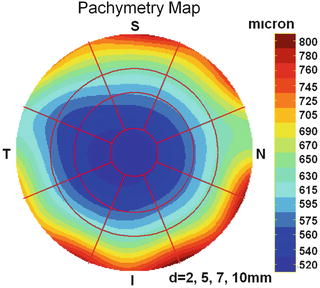
Fig. 55.6
OCT pachymetry (corneal thickness) map
Forty-two eyes of 21 normal subjects were used in our clinical study [13]. The OCT pachymetry mapping and ultrasound central pachymetry (50 MHz CorneoGage 2, Sonogage, Cleveland, OH) were obtained three times on each eye. The average central (D < 2 mm) OCT corneal thickness (OCTMean) was compared with the ultrasound pachymetry. The OCT measurements correlated very well with ultrasound pachymetry (Pearson correlation r = 0.97). The Bland–Altman analysis showed that the OCT measurements were slightly thinner than those obtained with ultrasound pachymetry. The difference between the OCTMean and ultrasound was −6.4 μm (95 % limits of agreement: −23.2 to 10.4 μm). The difference was statistically (t-test, P < 0.001) but not clinically significant. Overall, the repeatability of the mean corneal thickness was roughly 2 μm for the three zones within the 7-mm diameter in OCT pachymetry maps.
Our results show that OCT is a reliable method of mapping corneal thickness. In our clinical practice, OCT is now routinely used to screen prospective patients seeking keratorefractive surgery. The thickness map is used to detect thin spots that may indicate keratoconus or pellucid marginal degeneration and to calculate the predicted residual stromal bed thickness after LASIK or PRK. We also track the disease progression in patients with corneal edema (swelling) with OCT. Because the measurement does not require contact, it is more easily tolerated than measurement with an ultrasound probe.
55.2.2 Epithelial Thickness Mapping
The corneal epithelium is the first cellular layer of the human cornea and protects the eye. Accurate and reproducible measurement of corneal epithelial thickness provides important information for assessing corneal remodeling after refractive surgeries such as photorefractive keratectomy and LASIK [45]. Moreover, deviations from normal epithelial thickness could be an early sign of keratoconus [46].
Fourier-domain OCT instruments can provide scan speeds 10–100 times faster than time-domain OCT instruments [47]. The enhanced speeds minimize the effect of eye movements during data acquisition and also allow higher definition imaging due to denser axial scans in the same transverse scan length. The higher scan speed also facilitates frame averaging that suppresses speckle noise. The epithelium–Bowman’s layer boundary is a relatively weak interface presented in corneal OCT images.
We used a Fourier-domain OCT (RTVue-CAM, Optovue, Inc.) to investigate automatic epithelial thickness mapping. In this study, we enhanced the epithelial boundary by acquiring five repeated images and averaging them after the registration. The averaged image had higher signal-to-noise ratio than the single frame. Moreover, the Fourier-domain OCT system used in our study had an axial resolution of 5 μm, which is two to three times higher than that of time-domain instruments used in previous studies [48–51]. Not only does the higher resolution and higher speed of Fourier-domain OCT improve image quality, it also makes the automated corneal epithelial thickness mapping possible.
A “Pachymetry + Cpwr” scan pattern (6-mm scan diameter, 8 radials, 1,024 axial scans each, repeated five times) centered at the pupil center was used to map the cornea (Fig. 55.7a). Fourier-domain OCT image data were exported and processed with custom software. For each OCT scan, five repeated radial cross-sectional images on each meridian were registered and averaged (Fig. 55.7b). Next the air–tear interface and the epithelium–Bowman’s layer boundary were automatically identified with a computer algorithm by increased signal intensity at corresponding boundaries (Fig. 55.7c, d) [52]. Corneal epithelial thickness was measured as the distance between the air–tear and the epithelium–Bowman’s interfaces perpendicular to the anterior surface at the point of measurement. An epithelial thickness profile was generated from each meridional cross section. A 6-mm diameter epithelial thickness map was generated by interpolating epithelial thickness profiles calculated from each meridian. Only the central 5-mm diameter map was used for calculating epithelial thickness-based variables. The epithelial thickness map was divided into three zones by diameter and hemispheres: central 2 mm, superior 2–5 mm, and inferior 2–5 mm (Fig. 55.8a).
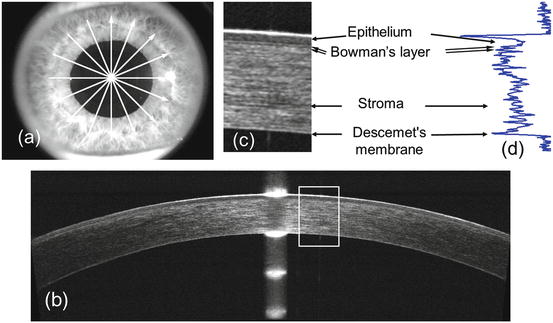
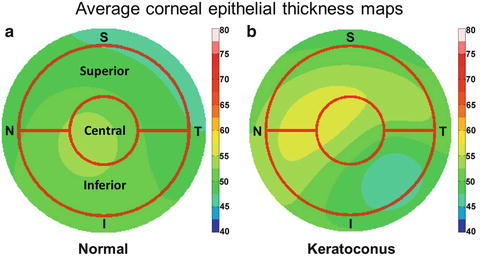
Fig. 55.7
(a) The “Pachymetry + Pwr” scan pattern consisted of 8 radial scans. (b) A cross-sectional corneal optical coherence tomography (OCT) image (average of five repeated frames). (c) A magnified section of OCT image shown in (b). (d) A corneal axial scan
Fig. 55.8
Average epithelial thickness maps of the normal (a) and keratoconic (b) eyes
One hundred and three eyes of 54 normal subjects were involved in this study. Each eye was scanned three times within a single visit. Subjects were repositioned after each OCT scan. The average age of the normal subjects was 46.3 ± 13.4 years (range 19–65 years). The average steep K was 44.4 ± 1.4 diopter (D) (range 41.0–47.8 D) and the minimum corneal thickness was 529.1 ± 27.5 μm. The repeatability of central, superior, and inferior epithelial thickness measurement was less than 1.0 μm by pooled standard deviation. The average central, superior, and inferior epithelial thicknesses were 52.8 ± 3.9, 49.4 ± 3.8, and 51.2 ± 3.6 μm, respectively. The average epithelial thickness maps of all normal subjects were calculated (Fig. 55.8a). The left eye maps were mirrored to the right eye to calculate the average map of both eyes.
55.2.3 Keratoconus Screening
Keratoconus is the most important contraindication for laser refractive surgeries. Undetected corneal ectatic disorders can result in accelerated, progressive keratectasia and unpredictable visual outcome after LASIK and PRK. Current detection of early stage keratoconus (referred to as forme fruste keratoconus or FFK in medical literatures) relies primarily on Placido ring-based corneal topography [53–55]. However, topography does not screen out all eyes at risk [56]. Corneal thinning is a characteristic feature of keratoconus. Studies showed that the OCT pachymetric parameters listed in Table 55.2 are helpful in detecting the keratoconic eccentric focal thinning patterns [57]. If one parameter is abnormal (lower than the cutoff value), the cornea is likely to have keratoconus. If two or more parameters are abnormal, then the eye is very likely to have keratoconus or other ectatic conditions such as pellucid marginal degeneration [58].
Table 55.2
Cutoff values for optical coherence tomography pachymetric parameters. I-S inferior–superior octant difference, IT-SN inferotemporal–superonasal octant difference. The diagnostic cutoff threshold is 2.3 standard deviations below normal average (1st percentile of normal distribution). All measurements are made within central 5-mm diameter of the map
Pachymetric parameters | Minimum | Minimum–maximum | I-S | IT-SN |
|---|---|---|---|---|
Cutoff (unit: μm) | 472 | −62 | −52 | −51 |
The human corneal epithelium covers the surface of the cornea where it protects the eye and plays an important role in maintaining high optical quality. In diseases such as keratoconus, the thickness of the epithelium becomes altered to reduce corneal surface irregularity [46]. Therefore, the presence of an irregular stroma may be less measurable by frontal surface corneal topography. Analyzing the corneal epithelial and stromal thicknesses and shapes separately can facilitate the detection of the disease in its early stage [46, 59, 60]. We also used epithelial map information for keratoconus detection. We conducted a cross-sectional observational study involving 145 eyes from 76 normal subject and 35 keratoconic eyes from 22 patients. We calculated the average epithelial thickness map of keratoconic eyes (Fig. 55.8b) using the method described in Sect. 55.2.2 “epithelial thickness mapping.” Five diagnostic variables, including minimum, superior–inferior (S-I), minimum–maximum (MIN-MAX), map standard deviation (MSD), and pattern standard deviation (PSD), were calculated.
Several corneal epithelial thickness-based variables developed in this study showed good (minimum, AROC = 0.84; MIN-MAX, AROC = 0.88; RMSV, AROC = 0.89) to excellent (PSD, AROC = 1.00) diagnostic power in differentiating keratoconic from normal eyes. By far, PSD was the best variable. With a cutoff value of 0.057, PSD alone gave 100 % specificity and 100 % sensitivity. These variables could be applied to epithelial thickness maps from other imaging systems as well (e.g., very high-frequency ultrasound). Moreover, these variables may be useful for detecting forme fruste keratoconus (FFK or subclinical keratoconus). Further studies are needed to evaluate the performance of these variables in FFK detection.
55.2.4 Measuring Corneal Refractive Power
The refractive power of the cornea is determined by the anterior and posterior corneal surfaces. It is commonly measured by manual keratometer or simulated keratometry (Sim-K) from computerized corneal topography systems. Keratometry measures the anterior surface power and extrapolates total corneal power assuming the ratio of anterior and posterior radius is fixed. This assumption, however, leads to measurement error in the corneal power for eyes that have undergone refractive surgeries such as LASIK. Consequently, the calculated corneal power change deviates from the actual refractive change after LASIK.
The wide-field high-speed anterior segment OCT is capable of direct measurement of both anterior and posterior surfaces, thereby avoiding the erroneous assumption. In a study of 32 eyes from 17 LASIK patients, we evaluated the repeatability of OCT-based corneal power measurement by pooled standard deviation [61]. The repeatability is 0.79D for the anterior surface and 0.10D for the posterior surface. The former value is not as good as the conventional corneal topography systems, which usually have repeatability less than 0.25D. The main limitation is most likely the scanning speed. At 2,000 axial scan per second, eye movement during OCT scans still produces noticeable error in corneal power measurement. Nevertheless, if we combine the OCT-measured pachymetry map and anterior corneal topography, the resulting total corneal power can closely track the refractive change after LASIK [61].
55.2.5 LASIK Anatomy
An important use for OCT in LASIK surgery is in measuring the thickness of the flap and the residual stromal bed. In the LASIK procedure (Fig. 55.9), both the flap dissection and the laser treatment weaken the corneal structure. If the remaining stromal bed is less than 250 μm or if the eye has a preexisting condition that has weakened the cornea, there is a high risk of developing keratectasia or progressive focal thinning and bulging forward of the cornea [56]. To avoid this complication, a method is needed to measure the flap and stromal bed thickness [62].
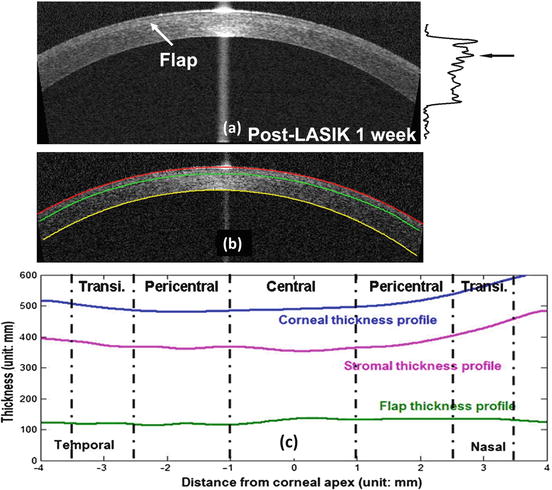
Fig. 55.9


(a) A post-LASIK 1 week OCT scan of 1,310 nm time-domain OCT. Arrows mark the location of the flap interface. (b) Corneal boundaries and flap interface overlaid on the OCT image. (c) Corneal, stromal bed, and flap thickness profiles
Stay updated, free articles. Join our Telegram channel
Full access? Get Clinical Tree
