Fig. 23.1
Overall OCT system block diagram with akinetic all-semiconductor laser. Callouts note key system parameters of consideration when utilizing an all-semiconductor akinetic source. An all-semiconductor laser allows for simplification of the OCT system by providing a linear sweep, an electronic k-clock for triggering data acquisition, and programmability of system/laser parameters
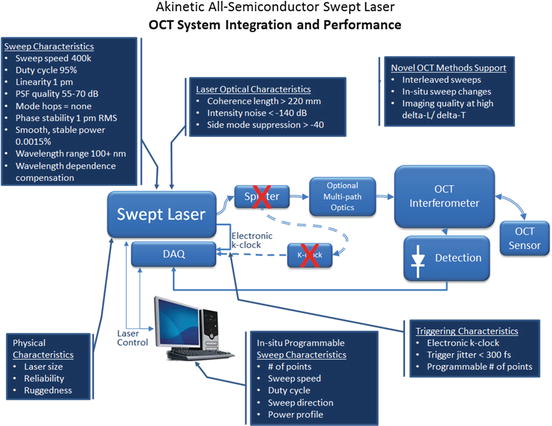
Fig. 23.2
The all-semiconductor akinetic approach promises small, inexpensive swept lasers enabling excellent image quality
Table 23.1
Comparison of characteristics of various swept laser approaches, including akinetic, mechanically tuned external cavity and MEMS-tuned external cavity
Swept laser technology characteristics | |||
|---|---|---|---|
Performance parameter | Akinetic monolithic cavity optoelectronic integrated design | Mechanically tuned external cavity | MEMS-tuned external cavity (micro-electromechanical) |
Maximum sweep | Limited by laser diode resistance capacitance time constant product | Limited by mechanical factors and electrical drive interface | Limited by mechanical factors and electrical drive interface |
Repetition rate | |||
Coherence length and associated spectral line width | Short optical cavity length results in single longitudinal mode operation and long coherence length | Most often multiple longitudinal mode due to long cavity length | Generally smaller cavity length and possible single longitudinal mode operation |
Sweep repetition rate adjustability | Continuously adjustable | Typically fixed | Typically fixed |
Power output | Moderate | Highly design dependent | Highly design dependent |
Sweep to sweep power repeatability | Actively controlled, highly repeatable | Typically determined by gain profile of device | Typically determined by gain profile of device |
Size | Diode laser package plus driver electronics | Typically needs to accommodate several packaged devices and interconnections | Typically has several packaged devices and interconnections |
Sweep linearity | Controlled by accuracy of tuning tables and software algorithms | Sweep linearity often limited by momentum of mechanical tuning structure | Controlled by accuracy of tuning tables and software algorithms |
Sweep drift over time | Controlled by long-term aging of semiconductor active region and internal system recalibration mechanism | Affected by mechanical wear and mechanical flexure aging | Effected by mechanical wear and mechanical flexure aging |
Phase stability/wavelength repeatability | Lack of kinetic movement with all-electronic control supports high repeatability | Mechanical hysteresis and acceleration limit repeatability | Mechanical hysteresis and acceleration and MEMS flexure non-idealities limit repeatability |
In this section the akinetic laser’s performance extant in early 2013 will be explored, and how the performance impacts OCT system performance will be discussed. It is anticipated that capabilities will continue to advance as the all-semiconductor laser design and implementation continues to mature.
23.3.1 Coherence Length/Imaging Depth Range
This section addresses achievable coherence length. In a later section on imaging depth range and multipath imaging, the application of longer coherence length on OCT will be investigated.
Long coherence length is a key factor in the following OCT conditions:
Facilitating deep imaging, (such as anterior eye segment, full axial eye length OCT)
Allowing for distance variation between the probe and the tissue (such as esophageal and lower GI imaging or in certain OCT-guided surgery applications)
Enabling advanced OCT measurement techniques, such as superimposed multipath OCT, polarization-sensitive OCT [48], or phase-sensitive OCT [49]
Accommodating differing length sensors or allowing less expensive sensors that are differing in length
Typical obstacles to long coherence length are finesse of the cavity and time-based shifting of the center wavelength [50]. The all-semiconductor laser cavity is short (∼2 mm in length) and monolithically constructed within the semiconductor, minimizing the mechanical variation that might limit coherence length (Fig. 23.3).
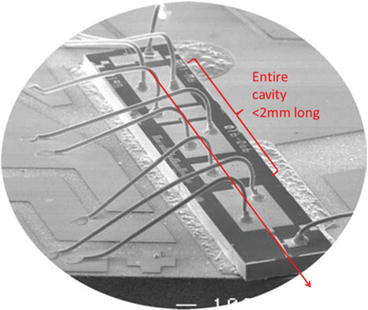
Fig. 23.3
SEM image of the bonded laser chip. The optical path is less than 2 mm long and in a single mechanical part, reducing cavity variation and leading to high coherence length, as well as eliminating the typical inter- and intracavity reflections that can create ghosting with other swept lasers
The coherence length, z c , is related to the full-width at half maximum (FWHM) instantaneous line width of a Gaussian profile laser, δλ, via [51].

(23.1)
The mirror penetration inherent in the all-semiconductor laser’s distributed Bragg reflector (DBR)-like structure increases the finesse of the cavity by a factor of approximately nine times, resulting in a narrow line width. The small dimensions of the laser cavity, and the fact that the entire cavity is on a single rigid structure, substantially reduce cavity length variation.
23.3.1.1 Coherence Length Performance
An example coherence length measurement is shown in Fig. 23.4. The measurement shows the point spread function (PSF) as a function of imaging depth range Fig. 23.5. The PSF drops off very slowly with imaging depth. The resulting coherence length is in excess of 220 mm (∼8.6 in., line width of 1.3 GHz, or 7.7 pm line width at 1,310 nm), even at sweep repetition rates up to at least 320 kHz.
Fig. 23.4
Coherence length test apparatus. The swept wavelength laser is split into two beams with a fiber directional coupler. The two coupler output ports are coupled into Faraday rotation mirrors (FRM to reduce polarization dependency) [52]. One of the two arms consists of a movable reference reflector that allows for path length adjustment in this Michelson interferometer configuration. Finally the reflected beams are added together in the coupler and the combined beam is detected by a photodetector. The interference of the signal in the receiving photodetector is used to analyze coherence length [53]
Fig. 23.5
Coherence length test data confirmed at least 220 mm at both 1,310 and 1,550 nm, 8 kHz to at least 320 kHz sweep rate
The two most common ways to measure coherence length is to look for the −3 dB reduction of the amplitude of interferogram from a fixed reflector or to look for the −6 dB roll-off point of the point spread function (PSF) for the same signal [54, 55].
Another factor that can change coherence length in some lasers is the sweep rate. Typically, a faster sweep rate implies a lower coherence length. Due to the lack of physical motion, sweep rate has only a weak effect on the coherence length of the all-semiconductor laser. As such, the same coherence length is obtained whether running at 4 k sweeps per second (sps) or to beyond 320 k sps.
23.3.1.2 Coherence Homogeneity in Different Wavelength Portions of the Sweep
Kinetic swept lasers often have a characteristic sweep rate that varies significantly over the duration of the sweep. This change in sweep rate and nonlinearity often leads to the nonhomogeneous coherence length across the sweep. However, no discernible difference in the coherence length at the beginning, middle, or ending portions of the sweep in the akinetic swept laser has been observed.
23.3.1.3 User-Adjusted Coherence Length
User-adjusted coherence length, an upcoming function for the akinetic laser, illustrates a unique characteristic of the laser: it is a software platform allowing detailed control over the laser’s behavior. One of the implications of this control is that the coherence length can be adjusted with software. This capability can allow coherence length tuning to reduce unwanted signals in the OCT images caused by multiple reflections [56].
23.3.1.4 Imaging Depth Range Should Be Limited by Nyquist, Not Limited by the Laser
In high-speed systems with all-semiconductor swept lasers, it is increasingly likely that imaging depth range will be constrained by the Nyquist frequency limit of the detection of the interferogram [57] rather than by the long coherence length. One must also ensure that the detection amplifier bandwidth does not further limit the useful imaging depth range. Figure 23.6 shows imaging depth range as a function of sweep repetition rate for a 1,310 nm swept wavelength laser at various sweep conditions. These plots show that the imaging depth is often limited by the sampling rate of the receiver and not the coherence length of the swept laser. For longer coherence lengths at higher speeds, the sweep width is reduced to ensure the return frequencies were below the Nyquist limit.
Fig. 23.6
A good laser will allow the imaging range to be limited by Nyquist, not the coherence length of the laser. The charts indicate the maximum imaging depth range due to Nyquist limits at different sweep rates, with curves for different measurement rates (different colored plots). Also shown is the coherence length limit. Shaded areas indicate combinations of measurement rate, sweep rate, and imaging depth range that are valid for imaging. The right-hand chart zooms in on short imaging depth range for clarity
23.3.2 Sweep Speed
There are a number of reasons that rapid laser sweep speed can be important for OCT. These include the following:
Experimental data shows that moving from any wavelength to an adjacent wavelength with the all-semiconductor laser takes ∼2 ns. This measurement was obtained using a reference interferometer with known free spectral range as a frequency-to-amplitude converter. The resulting photo-detected signal was then measured with a high-speed oscilloscope. The measured time for the wavelength of the laser to change as a result of a step change in the control currents to the laser cavity is shown in Fig. 23.7. An amplitude change in the light transmitted through the interferometer corresponds to a wavelength change in the output of the laser. In the measurement shown, a step change in current occurring over 2.5 ns creates a step change in wavelength in approximately 2.5 ns.
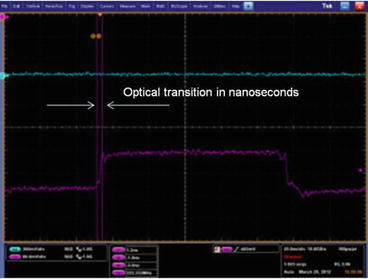
Fig. 23.7
High-speed oscilloscope trace showing full optical transition in <2.5 ns
Akinetic laser module designs in early 2013 can drive the laser up to 400,000,000 wavelength points per second. This can yield up to roughly 400,000 A-scans per second with 1,000 points per sweep or 2,000 points at 200,000 sweeps per second. Unlike some mechanically driven lasers, the speed is software controlled. The akinetic laser can be programmed for any speeds over a range from 4,000 to 400,000 sweeps per second. The low repetition rate value of 4,000 sweeps per second is not a fundamental limitation and could be made arbitrarily low.
In lab experiments, all-semiconductor lasers have been demonstrated at 1 million sweeps per second, thus ensuring a growth path with akinetic technology for faster future sweep rates to enable fast, high-resolution 3D imaging. For the longer term, it is believed that the akinetic technology can be pushed to roughly 2 million sweeps per second.
23.3.3 Duty Cycle
The akinetic semiconductor laser’s fast tuning from any wavelength to any other wavelength means that the time from the end of a sweep to the beginning of a sweep is short, permitting a high duty cycle with little dead time between sweeps.
Historically, achieving a sweep with a swept-wavelength laser required generating and dissipating momentum in a mechanical tuning mechanism [25]. Mechanically tuned lasers must start moving from an initial position of a physical tuning actuator, accelerate the actuator (building momentum), maintain the actuator tuning rate for the useful part of the sweep, decelerate the actuator, stop, reaccelerate, and so on (Fig. 23.8).
Fig. 23.8
Mechanically tuned lasers transition through accelerate/decelerate cycles, generating and dissipating momentum, that are not pertinent for akinetic lasers
With some mechanical lasers, portions of this accelerate-decelerate cycle can be expedited but not eliminated [63], resulting in only a portion of the sweep that is actually useful for imaging. In the past, delays in the data acquisition system made this delay inconsequential because it took time to get the data transferred. In today’s data acquisition, however, system measurement is virtually continuous. With these streaming-type data acquisition systems, high duty cycle afforded by the all-semiconductor laser increases total throughput and imaging speed (Fig. 23.9).
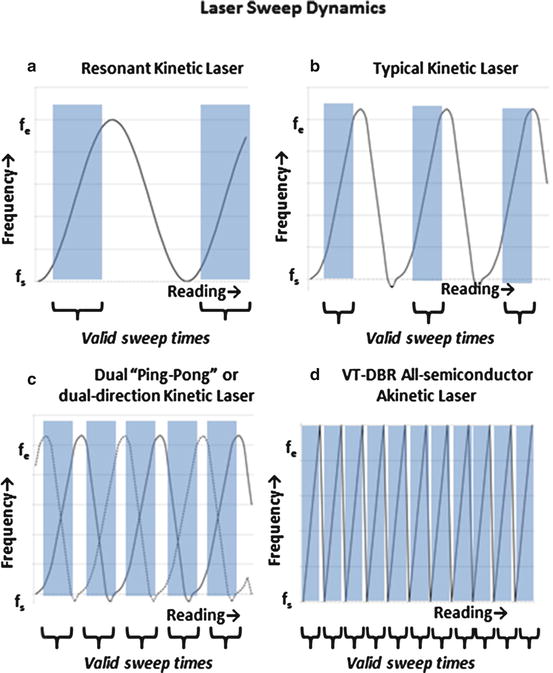
Fig. 23.9
Mechanically tuned lasers must move back from the end of the sweep to get to the beginning, taking time [63]. Akinetic lasers move directly from the end to the beginning, using only nanoseconds
Because duty cycle is software controlled, it is adjustable. The duty cycle can be set to almost any value from 5 % to 95 %.
23.3.4 Linearity and k-Clock
23.3.4.1 Electronic k-Clock
Linear frequency (k-space) data is a requirement for swept source OCT applications. Mechanically tuned swept lasers often lack sufficient linearity of optical frequency versus time. Thus, most swept lasers require an external optical k-clock for variable-rate clocking of the data acquisition [6, 64] or require a similar k-clock signal that can be analyzed to properly resample the even-in-time data [65–67]. Figure 23.10 illustrates a typical external k-clock block diagram.
Fig. 23.10
Kinetic lasers generally lack sufficient linearity, requiring either resampling with an external k-clock, or triggering with one, leading to cost, trigger jitter, or the potential of artifacts. The 50:50 couplers and path length delay provides for a Mach-Zehnder filter that provides a repetitive passband filter with equal frequency steps. The interferometer output is detected and processed to provide electrical signal edges to trigger the data acquisition circuitry
The all-semiconductor laser is inherently linear and does not require an external optical k-clock. The laser self-generates an internal electronic k-clock. The laser forces the wavelength to be correct at each of the evenly spaced clock transitions Fig. 23.11. The all-semiconductor laser does not need the extra cost of parts and integration of an optical k-clock and eliminates the challenges frequently associated with the nonuniform triggering that can occur with external optical k-clocks (where zero-level drift creates nonuniformity in the triggering periods and resulting degradation of trigger timing). The result is direct triggering of the data acquisition: No post-acquisition resampling, avoiding the potential of resulting ghosting [68, 69] and reducing computation time.
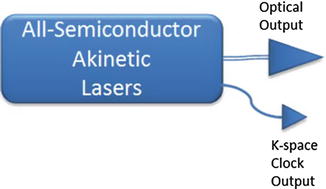
Fig. 23.11
Akinetic lasers can generate an extremely linear sweep, synchronized with an evenly spaced self-generated electronic k-clock. This simplifies receiver design
In addition to the electronic k-clock, the akinetic laser also provides a sweep start trigger. This sweep start trigger is always deterministically aligned with the k-clock trigger, providing a pulse at a time just previous to the first valid k-clock, and thus ensuring that the ±1 clock cycle error [49] that can exist in mechanically swept-laser systems where k-clock and sweep start are not deterministic.
23.3.4.2 Inherent Linearity
The akinetic laser has typical RMS linearity of 0.0012 % at 200,000 sweeps per second (less than ±1 pm; ±0.2 GHz) and has a linearity span that is typically <±0.002 % (<±2 pm). This linearity produces uniform single-reflection interferograms and results in clean, low-artifact images. Figure 23.12 shows the example output of a Mach-Zehnder interferometer with ∼42 GHz free spectral range operating at 1550 nm and Figure 23.13 shows similar performance for a laser operating at 1310 nm. The measurement shows that the spacing between zero crossings is uniform indicating a linear frequency versus time sweep.
Fig. 23.12
Interferograms do not show the common “accordion” shape typical of mechanically tuned lasers [70]. This image is a short segment of a 1,550 nm laser, operating at 8 k sweeps per second to provide high-resolution interferogram using 400 MHz data acquisition
Fig. 23.13
Interferogram at 1,310 nm operating at 8 k sweeps per second to provide high-resolution interferogram using 400 MHz data acquisition
23.3.4.3 Equally Spaced, 50 % Duty Cycle Trigger
To achieve high signal-to-noise ratio (SNR) and spurious-free dynamic range (SFDR) as well as the high-speed acquisition rates, most available data acquisition systems require uniform equally spaced 50 % duty cycle triggers. The akinetic laser has equally spaced clock triggers, allowing the system data acquisition hardware to achieve higher SNR. With external optical k-clocks with mechanically tuned lasers, ensuring exactly 50 % duty cycle can be difficult (Fig. 23.14).
Fig. 23.14
This TI data sheet chart illustrates how a 10 % change in the duty cycle of the clocking can reduce SFDR by almost 10 dB at 300 Mhz [71]
23.3.5 Point Spread Function (PSF) Quality
The axial PSF provides a measure of a fundamental limit on the quality of image possible with a swept laser in an SS-OCT system [4]. The PSF is the power spectrum of the interferogram produced by an OCT interferometer with a single reference reflector. A PSF with low side lobes and low background noise facilitates an image with low artifacts and high contrast and detail. Typical values for the akinetic laser PSF are 45–60 dB to the side lobes and 55–70 dB to the noise floor (defined as the variation of the background), as seen in Fig. 23.15 (the range of values is determined primarily by interferometer characteristics).
Fig. 23.15
This plot shows the PSF for a 153 kHz sweep. Deep side lobes and low background noise lead to low image artifacts and high image contrast and detail. These are due to the low trigger jitter, linearity, power stability, low RIN, and additional factors
The PSF and image quality produced by the all-semiconductor laser will not degrade over time because the laser is constantly re-evaluating its own performance and making small adjustments to its drive signals. Maintaining sweep linearity over time can be a limitation for mechanical tuning lasers, primarily due to mechanical wear and mechanical changes with time and temperature.
23.3.6 Coherence Revival
Coherence revival is the effect where interference fringes are observed in an interferometer illuminated by a light source with a comb-like spectrum not only when the reference and sample arms are matched in delay but also when the two arms are mismatched at periodic intervals. These intervals can be several orders of magnitude longer than the source coherence length [50]. This occurs if a laser is simultaneously oscillating at multiple longitudinal modes of the cavity. The period of the interference fringes is equal to the reciprocal of the mode spacing (which equal to the roundtrip delay of the laser cavity) [50, 72]. These effects can create nonidealities such as ghosting in the OCT image [73].
Because the akinetic swept laser has a single longitudinal mode, the issues with coherence revival in mechanically tuned lasers are largely avoided.
23.3.7 Mode Hops
The all-semiconductor laser uses software control to constantly monitor and ensure that no mode hops occur. Long before the laser could even begin a mode hop, the control optimizes the sweep to ensure optimum side-mode-suppression ratio (SMSR) and guaranteeing no mode hops.
23.3.8 Phase Stability/Wavelength Repeatability
In phase-sensitive OCT applications, such as phase microscopy or Doppler OCT, it is beneficial to have wavelength sweeps of the laser starting at the same wavelength and repeat the same wavelengths at all samples in an interferogram (Fig. 23.16). Wavelength repeatability of the laser contributes to phase stability in the resulting interferograms, directly affecting minimum phase sensitivity [49]. Phase sensitivity then determines displacement sensitivity and flow velocity resolution.
Fig. 23.16
Phase repeatability is typically defined as the repeatability from one sweep to another and is expressed either in picometers repeatability, in milliradians of a specified reflection, or in displacement sensitivity
Wavelength repeatability of 0.5 pm standard deviation and ±2.5 pm span (peak amplitude) has been confirmed for the all-semiconductor laser. The following charts show the detailed test results (Figs. 23.17 and 23.18).
Fig. 23.17
Sweep phase repeatability in nanometers and milliradians. Peak variation is ±2.5 pm; standard deviation is 0.5 pm. A total of 8,040 sweeps were measured over a period of 30 min. Sweep rate was 118 KHz. Test consisted of measuring the wavelength of a feature from an H 13 CN gas absorption cell at 100 torr [74]. Repeatability was similar at various points along the sweep
Fig. 23.18
A histogram of akinetic laser sweep wavelength variation in picometers. 0.25 pm is equivalent to 0.25 mrad
The displacement sensitivity of a phase-sensitive OCT system is obtained from

where δϕ is the phase uncertainty in the interferogram measurement, δλ is the wavelength repeatability, z is the nominal path length difference, n is the index of refraction, and λ is the center wavelength. The fundamental phase uncertainty of an OCT system is  [75, 76]. To achieve SNR-limited displacement sensitivity, variations in the wavelength repeatability must be minimized as shown in Eq. 23.2. Most phase-resolved OCT systems using mechanical swept sources require the use of a wavelength reference or phase reference to remove the effect of low wavelength repeatability in sources based on polygon mirrors [49, 77], MEMS cavities [78], or MEMS VCSELs [79].
(23.2)
[75, 76]. To achieve SNR-limited displacement sensitivity, variations in the wavelength repeatability must be minimized as shown in Eq. 23.2. Most phase-resolved OCT systems using mechanical swept sources require the use of a wavelength reference or phase reference to remove the effect of low wavelength repeatability in sources based on polygon mirrors [49, 77], MEMS cavities [78], or MEMS VCSELs [79].The predicted performance of the akinetic laser may be calculated in two ways. First, using Eq. 23.2, the measured wavelength repeatability of 0.5 pm and a center wavelength of 1,550 nm, the displacement sensitivity is 65 pm at the thickness of a slide cover of 0.2 mm (650 pm at 2 mm). Alternatively, the wavelength repeatability term in Eq. 23.2 may be expressed as a depth-dependent phase error, given by
(23.3)
In air, a wavelength repeatability of 0.5 pm produces a phase error of 0.5 mrad at 0.2 mm (5 mrad at 2 mm). The calculated phase errors for the akinetic laser meet or exceed results obtained from a number of swept-source phase-resolved OCT systems [77–84] without need of a wavelength reference or phase correction methodology [85, 86].
23.3.8.1 Phase Sensitivity Vis-à-Vis Alternatives
Comparing phase sensitivity among different systems with different light sources can be challenging. One typically would like to separate contributions from the source and detector from instabilities in the optics that constitute the interferometer. The most incontrovertible technique for achieving this separation is utilizing the front and back reflection from a glass plate, typically a microscope cover slip, as the reference and sample arm for phase stability analysis of the source and detector. A drawback to this technique is that there is little control over the reference power; hence, the measurement may not be under the appropriate conditions where near shot-noise limited detection may be achieved [87] and precludes the use of balanced detection. Nevertheless, this technique may be used to assess how closely the measured phase stability follows the ideal 1/√SNR relationship.
It is well known that spectrometer-based OCT systems typically have superior phase stability over swept-source-based systems [88] unless measures are taken to compensate for sweep to sweep variations in the swept-laser frequency [79]. This is commonly attributed to the lack of moving parts in spectrometer-based systems. The akinetic swept laser has a similar lack of moving parts; hence, one would expect similar phase stability without any compensation for sweep to sweep variability.
In order to test this conjecture, we have made a direct comparison between a spectrometer-based OCT system at 830 nm (±20 nm) described in detail in [89] with a 1,550 nm (±20 nm) akinetic swept-laser-based system using a glass microscope coverslip (#1,145 μm). The measured standard deviation of the phase noise based upon 10,000 a-lines was 2.28 mrad and 1.4 mrad at 54.8 dB SNR and 57.8 dB SNR for the 830 nm and 1,540 nm systems, respectively. In order to make a fair comparison, we need to ratio these results to the ideal case, i.e., σ = 1/√SNR. We can then see that under these conditions the phase noise is 126 % of ideal for the spectrometer-based system and 109 % of ideal for the akinetic swept-laser system. The wavelength repeatability of the akinetic swept laser enables phase stability on par with spectrometer-based systems without introducing compensatory absolute wavelength calibration (via, for instance, fiber Bragg grating).
The following table outlines published data on the phase stability for various laser technologies (note: there has been no effort to control for the different experimental conditions, namely, the signal-to-noise ratio associated with the measurement; hence, ranges have been included where available) (Fig. 23.19 and Table 23.2).
Fig. 23.19
MEMS laser phase stability of ∼5,000 mrad peak (left) and ∼3,000 mrad (right) compares to 0.01 mrad for the all-semiconductor akinetic laser. Even the corrected values, in which the researcher added a reference reflection to do corrections, are virtually identical to the uncorrected akinetic laser results (Courtesy of VU University, Amsterdam [78] and Beckman Laser Institute, California [81])
Table 23.2
Laser technology | Typical wavelength repeatability | Phase stability (200 μm slide cover) |
|---|---|---|
Akinetic swept laser | 0.5 pm std. dev., | 0.5 mrad std. dev., |
±2.5 pk-pk | 2.6 mrad peak to peak | |
Spectral domain OCT (using spectrometer) | Not applicable | 0.32–5.2 mrad std. dev. |
±17 mrad peak to peak | ||
MEMS swept laser | 294 pm peak to peak | 4.8–3,000 mrad |
Polygon mirror swept laser | 18–600 pm | 32 mrad std. dev. |
FDML swept laser | 0.76 mrad std. dev. | |
Crystal-based swept laser | ||
Littman-Metcalf swept laser | ±1– ±20 pm peak to peak typical | |
Pump/circulator/MEMS/VCSEL/SOA swept laser | ±150 pm peak to peak | 1.5 mrad |
Also pertinent to phase stability is the synchronization between sweep start and the k-clock. In mechanically tuned systems, these signals are typically not deterministic relative to one another, which results in the ±1 clock error issue [49]. Akinetic systems provide an electronic sweep start trigger which is synchronized with the electronic k-clock, eliminating the ±1 clock problem (Fig. 23.20).
Fig. 23.20
Diagram illustrating the ±1 clock error problem typical with mechanically tuned lasers, where the k-clock and start sweep trigger are not deterministic. The akinetic laser eliminates this problem by providing an electronic start-sweep trigger that is synchronized and deterministic with the k-clock [49]
23.3.9 Trigger Jitter
Trigger jitter in high-speed OCT systems can represent a key limitation that degrades the SNR [90]. As sweep speed increases, trigger jitter becomes a major factor in SNR and in the resulting image quality [91]. Even small triggering jitter reduces the PSF and image quality.
When utilizing an optical k-clock, it is difficult to achieve better than 18–50 ps jitter due to zero drift and other factors [85]. The akinetic all-semiconductor laser’s internal electronic k-clock is designed to minimize trigger jitter and achieves a ±300 fs specification–roughly 10–100 times better than a typical external optical k-clock.
The SNR of a system with analog signal frequency f bandwidth and jitter Δt jitter RMS is as shown in the following equation [71, 90]:
![$$ \mathrm{S}\mathrm{N}\mathrm{R}={\left[\frac{1}{\left(2\pi \right)\left(\Delta {t}_{\mathrm{jitter}\ \mathrm{R}\mathrm{M}\mathrm{S}}\right)\left({f}_{\mathrm{bandwidth}}\right)}\right]}^2 $$](/wp-content/uploads/2017/03/A76297_2_En_24_Chapter_Equ4.gif)
or expressed in dB
(23.4)
(23.5)
The following generic chart shows the relationship between trigger jitter and SNR [92] (Fig. 23.21).
Trigger jitter can become a significant issue at higher sweep speeds. A 6 mm imaging distance (12 mm round-trip distance) yields a signal of >100 MHz at 200,000 sweeps per second (100 nm width). The following chart shows that a jitter of 5 ps from an optical clock generates a >30 dB SNR reduction (Fig. 23.22).
Fig. 23.22
Akinetic lasers can be designed to have low jitter; at 300 fs, SNR is still 65 dB for a 200 MHz signal (Nyquist for 400 MHz acquisition)
23.3.10 Smooth, Stable, Controllable Power
The output power character of a sweeping laser can have a significant influence on the performance of an OCT system. Noise can reduce the image quality and sensitivity. Total power can be a limiting factor for penetration depth, and the overall shape of the power profile can limit resolution. In most mechanically tuned lasers, the output power varies substantially during the sweep [3, 5, 6, 11–13, 93], which can create image artifacts and affect the SNR. Precise control of the power profile over the sweep can accomplish the following:
Smooth output power reduces image artifacts
Selectable power allows tailoring to gain ranges of the receiver
Custom profiles allow experimentation with and optimization of the PSF and resolution
Higher average power across the band
Flat, strong output power can reduce RIN trade-offs and improve penetration depth
Output power in the all-semiconductor akinetic laser is directly controlled on the chip with the same single-digit nanosecond timing that allows fast wavelength variation. The nominal output power of the laser can be selected from software.
23.3.10.1 Flatness
The all-semiconductor laser has direct control of output power during the sweep. The output power is automatically tailored to the desired output with conformance to ±0.015 dB or about ±0.3 % of the signal (Fig. 23.23).
Fig. 23.23
Output power is controlled to ±0.015 dB, reducing power variation-driven image artifacts (Data taken at 108 kHz, 40 nm sweep)
Reduced amplitude variation can directly reduce spurious artifacts in the PSF, reducing ghosting or blurring of the image [94].
23.3.10.2 Selectable Power Profiles
Rather than having to accept the natural output power profile of the laser, the power profile can be selected to optimize image quality and overall system performance. Various research [97] has been inconclusive, with different studies demonstrating advantages of a power profile that is either flat, Gaussian, and cosine tapered Fig. 23.24 or even one with exaggerated power in the beginning and end of the sweep. With an akinetic laser, these and other exotic power profiles may be tried by the user, under program control, for application-specific optimization without any other changes to the system (Fig. 23.25).
Fig. 23.24
The power profile is user-programmable to flat top, Gaussian, or cosine tapered
Fig. 23.25
Experimentation with different windows impacts both resolution and dynamic range limits (Chart courtesy Kitasato University [97])
Note that for resolution of an OCT image, a Gaussian profile creates a resolution reduction compared to flat top, but FFT artifacts affect the image through the dynamic range. A flat-top profile can be used as an alternative and the resulting interferogram windowed in the time domain for Gaussian or cosine tapered (or other profile), allowing the advantage of the higher measurement SNR of the flat top while avoiding large FFT artifacts.
23.3.10.3 Higher Average Power
23.3.10.4 Sweep Speed Effect on Power
There is no discernible change in output power with sweep speed.
23.3.11 Custom Power Profiles: Wavelength Dependence Compensation and Modulation
To potentially improve the PSF and the resulting image quality, an akinetic laser can auto-level the power profile across wavelength and can automatically preemphasize the optical signal to compensate for wavelength and polarization-dependent losses in the OCT interferometer. This compensation can be applied to the flat top, Gaussian or cosine-tapered profiles.
It is interesting to note that OCT practitioners often do not recognize that the wavelength dependence of the optics can play a strong role in artifact generation because the natural power profile from the mechanical laser is already so nonuniform that the optics wavelength dependency is masked.
In addition to compensating for wavelength dependence, a custom power profile can also be used to superimpose a modulation onto the optical signal amplitude. This modulation can be in the form of a sinusoid, a pulse, a repetitive pulse, or any other form of amplitude variation.
23.3.12 Intensity Noise
The static RIN of the laser chip in the all-semiconductor laser is shown in Fig. 23.26. The RIN is less than 140 dB/Hz and tends to be flat through the frequency range of interest to OCT measurements. RIN directly impacts image sensitivity [98, 99].
Fig. 23.26
Low RIN (< −140 dB/Hz) contributes to clean PSF and low-noise images
Integrating the akinetic laser RIN of −140 dB/Hz over a typical maximum 200 MHz bandwidth results in a total integrated 0.14 % noise.
Most OCT imaging systems use balanced detection to reduce the effect of RIN and improve the image sensitivity. Depending on the amount of RIN, the wavelength dependence of the imaging system, and the sensitivity required, sophisticated techniques of spectral balancing or normalization are required [100]. The low RIN of the akinetic laser, combined with the ability to shape the power vs. wavelength profile (see Sect. 23.3.10), should simplify achieving high-sensitivity images.
23.3.13 Side-Mode Suppression
Side-mode-suppression ratio (SMSR) is a measure of the amplitude of the optical side modes of the laser relative to the power of the strongest cavity mode of the laser. Laser side modes can degrade image quality by diminishing edge detail and reducing the sensitivity. The akinetic laser may be tuned such that the amplitudes of competing laser cavity modes are substantially suppressed. Side-mode-suppression ratios of 44–48 dB over the entire tuning range are typical with akinetic laser technology (see Figs. 23.27 and 23.28). By contrast, the mode selectivity of some mechanically tuned laser cavities (Fig. 23.29) may be lower (∼30 dB), possibly limited by mechanical alignment tolerances of the laser cavity. The all-electronic control of the akinetic laser cavity allows the laser to operate in a single-longitudinal mode throughout a sweep. Evidence of the favorable SMSR during the sweep is the absence of coherence revivals in the coherence length measurement of Fig. 23.5. Coherence revivals – collapse and restoration of an interferogram – occur when a laser operates in multiple cavity modes [72]. The high dynamic range in PSFs measured with the akinetic laser (Fig. 23.15) also shows that the fringe contrast ratio remains high throughout the tuning range, which is also indicative of single-mode behavior.
Fig. 23.27


Side modes for the akinetic laser are below −44 dB at 1,310 nm. Typical values for mechanical lasers vary between −15 and −40 dB, with many in the range of −25 to −35 dB
Stay updated, free articles. Join our Telegram channel
Full access? Get Clinical Tree
