Chapter 5 Advanced Imaging Technologies
Introduction – retinal imaging to date
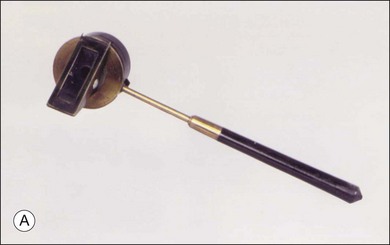
Assessment of chorioretinal disease is dependent on the ability to visualize pathologic changes occurring in the posterior segment of the eye using optical instruments, termed ophthalmoscopy (Fig. 5.1A).1 Ophthalmoscopy, in turn, has been greatly enhanced by the development of techniques that allow recording of these changes.2 By the end of the 19th century the first images of the living human retina had been obtained (Fig. 5.1B) and, by the 1950s, with the advent of electronic flashes and 35-mm cameras, the field of modern retinal/fundal imaging had been born.3
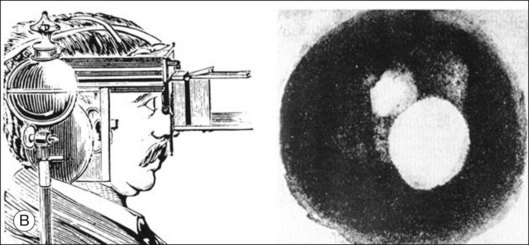
 -minute exposure. Blood vessels cannot be defined, but the optic disc can be seen as a white area superiorly, while inferiorly, the larger light area is an artifact.
As well as documenting pathology, fundal imaging facilitates the identification of morphologic features not visible to the clinician on biomicroscopy. For example, from an early stage in its development, fundus photography has incorporated angiographic methodologies for the visualization of blood vessels.1,4 In the 1960s, the assessment of retinal disease was revolutionized by the introduction of fluorescein angiography (Fig. 5.2A). In the 1970s, evaluation of the choroidal circulation was also improved through the use of indocyanine green dye. The development of these angiographic techniques has also led, at least in part, to the discovery that certain fundal structures fluoresce in the absence of contrast. The subsequent evolution of fundus autofluorescence imaging has greatly extended our ability to evaluate retinal degenerative and other disorders.2
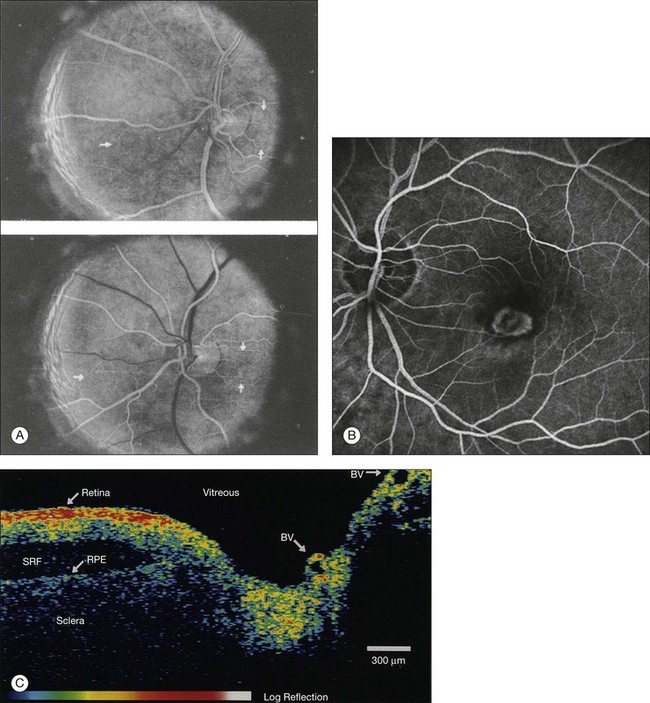
Since the 1990s, fundus photographic systems have also made the transition from “analogue” image capture using film to digital image capture using charge-coupled devices (CCDs), allowing for improved image processing and analysis.2 In parallel with this, new image capture technologies have emerged such as scanning laser ophthalmoscopy (SLO) and optical coherence tomography (OCT) (Fig. 5.2B, C). In particular, the widespread adoption of OCT in recent years has greatly extended our knowledge of chorioretinal disease pathophysiology, and proven important for the provision of new pharmacotherapeutics.1
Adaptive optics – imaging of single cells in the retina
Basic principles
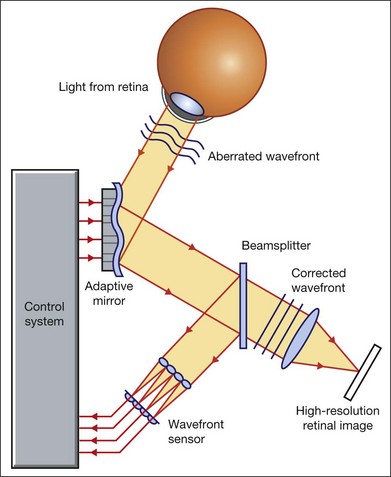
Our ability to obtain high-resolution images of the human retina is limited by the presence of defects, or aberrations, in the optical system of the eye (i.e., the cornea and lens).5 In addition to exhibiting lower-order monochromatic aberrations such as defocus and astigmatism, normal eyes also exhibit higher-order monochromatic aberrations such as coma, trefoil, and spherical aberration. The combined effects of these aberrations limit the quality of images obtainable for the diagnosis and management of retinal disease. Until the early 1990s, there existed no effective way to obtain rapid, precise measurements of the human eye’s optical aberrations. However, wavefront sensors based on the Hartmann–Shack principle, originally developed for astronomical purposes, have now been adapted for use in the human eye. These sensors consist of an array of lenses, each having the same focal length, which can be used to approximate the whole wavelength of incident light. Once measured, the detected aberrations can then be corrected (i.e., rendered flat) using one or more deformable mirrors (mirrors have large numbers of small electronically controlled actuators on their rear surface that can push and pull the mirror within a range of ±2 µm, allowing it to adopt any desired configuration) (Fig. 5.3). By incorporating wavefront sensing and correction into existing optical imaging platforms – “adaptive optics” – it is now possible to acquire images of the retina with cellular-level resolution, and in a noninvasive fashion.5,6
Technology
The adaptive optics devices first developed for ophthalmic use were conventional fundus cameras modified to incorporate wavefront sensing and correction.7,8 These systems typically focus a laser beam on the retina at a location of interest. The light reflected from the retina is then distorted by the optical system of the eye before returning to the wavefront sensor. Information obtained from the wavefront sensor is then used to alter the shape of the deformable mirrors and compensate for the aberration. This process continues in a closed loop until the ocular aberrations have been reduced to near diffraction-limited levels; at this point, a flash from a separate incoherent light source is triggered by the wavefront sensor, illuminating the retina as an image is captured by the digital fundus camera.
Adaptive optics components have also been incorporated into confocal SLO systems, offering the advantage of increased contrast, cross-sectional imaging, and the measurement of dynamic changes such as blood flow.5,9 In an adaptive optics SLO, light returning from the retina is split into a light detection path and a wavefront-sensing path. Again, deformable mirrors are used to provide closed-loop dynamic compensation for ocular aberrations. In contrast to flood-illuminated adaptive optics devices, the adaptive optics SLO uses the same source of light for the wavefront sensor as for the retinal illumination; as a result, the wavefront sensor is able to measure aberrations from the entire scanned area of the retina. When imaging the retina, SLO devices provide a transverse resolution of approximately 15 µm but are limited to an axial resolution of approximately 300 µm. With the addition of adaptive optics correction to an SLO, the transverse resolution may be increased to less than 3 µm while the axial resolution may be improved to 40 µm.
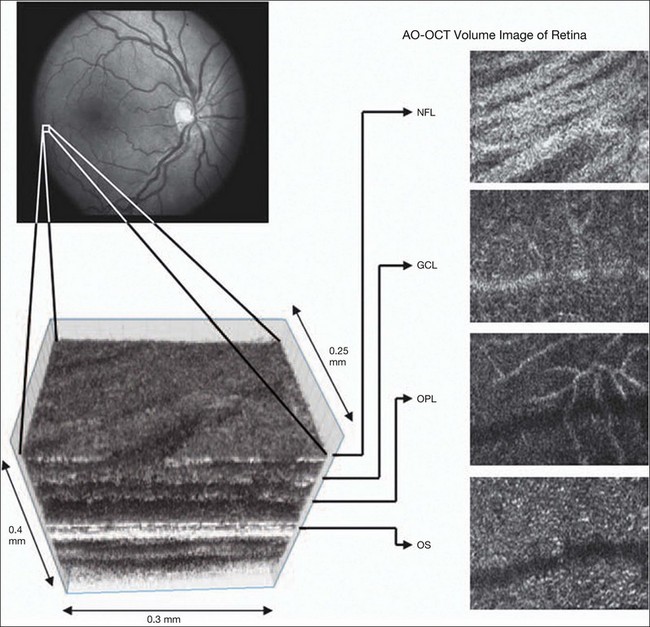
Adaptive optics devices have also been incorporated into prototype OCT systems.10,11 The axial resolution achievable using OCT is many orders of magnitude greater than that achievable using an SLO device, with commercially available devices commonly achieving axial resolutions of approximately 5 µm. However, the transverse resolution of OCT systems is determined by the size of the laser spot that can be focused on the retina – a factor limited by ocular aberrations. A successful combination of OCT and adaptive optics could potentially demonstrate, therefore, the narrowest point-spread function of all in vivo retinal-imaging techniques (Fig. 5.4). However, a number of technical challenges remain, in particular, the reductions in image quality that occur as a result of chromatic aberrations when large-bandwidth light sources are used.12,13
Finally, adaptive optics may be useful for the performance of fundus perimetry (“microperimetry”) in the study of macular disease.1 In current microperimetry systems, macular light sensitivity is measured using a stimulus size that covers an area containing in excess of 150 cones at the foveal center. As with the imaging modalities described above, further reductions in stimulus size are hindered by aberrations of the optical systems in the human eye, a shortcoming that may be overcome through the incorporation of adaptive optics.14 In addition, by analyzing the warping that occurs both within individual SLO frames and between frames, adaptive optics can be used to resolve the effects of eye movements at a fine spatial scale. As a consequence, in adaptive optics microperimetry, real-time stabilization of the retinal image is possible, allowed for targeted delivery of the small visual stimulus to the retina.15,16
Visualization of retinal structures
Cone photoreceptors are the dominant feature seen with both flood-illuminated and SLO devices (Fig. 5.5A).6,17 Light projected into the eye from these devices passes through the cone outer segment and is reflected by the retinal pigment epithelium (RPE), the most highly reflective surface in the retina. As light is reflected out of the eye, it is guided toward a small area of the pupil by the cone inner segments (in this respect cones act as “optical fibers,” rejecting stray light in the retina and maximizing efficiency in light collection). The human eye has three classes of cone photoreceptors: blue (S), green (M), and red (L). Adaptive optics has supplied the first data regarding the proportion, and arrangement, of each cone class in the human eye.18 By quantifying cone receptor density, it has also been demonstrated that the density of cone packing appears to be lower in highly myopic eyes versus emmetropic eyes – a finding consistent with the reduced visual acuity and contrast sensitivity observed in the eyes of axial myopes.19
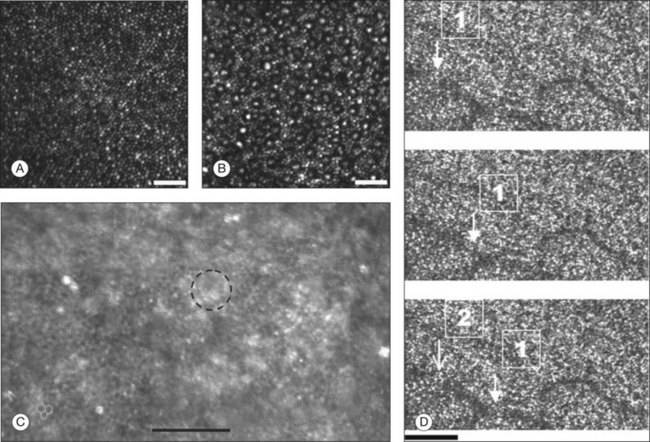
Rod photoreceptors are abundant in the peripheral retina but are also seen in the macular region of human eyes. Rods are not as easily visualized in the normal retina, even in areas of the retina where they outnumber cones approximately 10-fold.6 The difficulty in imaging rods is consistent with their smaller size (approximately 2 µm in diameter), and their broad angular tuning, which reflects less light back through the pupil where it can be collected for imaging. However, recent advances, including the use of smaller confocal pinholes and improvements in registration algorithms, have now allowed clear images of single rods to be obtained in the living human eye (as well as aiding visualization of the smallest cones at the foveal center) (Fig. 5.5A).20
Rod and cone photoreceptors rest on a monolayer of RPE cells. Each RPE cell in the monolayer has an approximate diameter of 10 µm, dimensions well within the resolution limits of adaptive optics systems; however, direct in vivo visualization of single RPE cells remains challenging. Unlike cone photoreceptors, the intrinsic contrast of RPE cells is poor. In addition, much of the light scattered by the RPE is masked by the overlying photoreceptors, which are also highly scattering. To date, direct imaging of the RPE has only been possible in human subjects with retinal disease where absence of cone photoreceptors has allowed visualization of the underlying RPE (Fig. 5.5B).21 However, by the incorporation of adaptive optics with fundus autofluorescence, images of the RPE cell mosaic have been achieved in primate eyes.22
The high scanning speed of SLO systems allows retinal images to be captured at video rates, thus allowing measurement of dynamic retinal changes, such as blood flow. The use of an adaptive optics SLO thus allows direct visualization of white blood cells as they transit through retinal capillaries (the smaller size and different absorption characteristic of red blood cells make them more difficult to visualize) (Fig. 5.5C).23,24 As a consequence, direct noninvasive measurement of the velocity of retinal blood flow becomes possible. Retinal imaging with adaptive optics may also be useful for detection of structural changes in the retinal vasculature not visible with other imaging modalities, such as microaneurysms and hard exudates in diabetic retinopathy.25
Although cone photoreceptors offer high contrast and can now routinely be imaged using adaptive optics, other cell types in the retina are not as easily visualized. Unlike cones, other neurons are not highly reflective of light and do not exhibit high contrast (the reflected signal from ganglion cells is 60 times lower than that from cones). These difficulties are especially difficult to surmount given the safe limits for laser usage in humans, and the effects of involuntary eye movements. Despite these obstacles, recent animal studies have made progress toward in vivo visualization of retinal ganglion cells using fluorescent markers, and the development of similar capabilities in humans may lead to improved understanding of optic neuropathies such as glaucoma.26
Early clinical applications
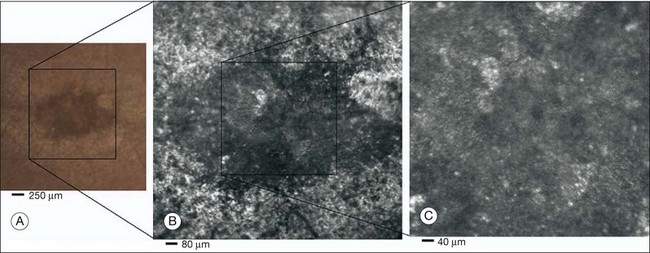
The cellular-level resolution provided by adaptive optics retinal imaging allows direct measurement of photoreceptor density and diameter and is, therefore, an ideal tool for the examination of patients with inherited retinal degenerations (Fig. 5.6). On examination with adaptive optics, diseased cones do not show the same reflectance pattern as healthy photoreceptors, resulting in dark gaps or areas of “drop-out” within the cone photoreceptor mosaic.27 Significant correlations have been found between parafoveal cone density and a number of functional parameters, including best-corrected visual acuity, contrast sensitivity, and detection sensitivities for visual stimuli recorded using multifocal electroretinography.28–30 In a recent phase II clinical trial where patients with inherited retinal degenerations were treated with sustained-release ciliary neurotrophic factor, no changes in visual acuity, visual field, or electroretinography responses were observed. However, using an adaptive optics SLO, significant differences in both cone density and spacing were detected between treatment and control groups.31
High-resolution adaptive optics imaging has also been used to aid the examination of patients with “macular microholes,”32 color blindness,33 foveal hypoplasia,34 and otherwise unexplained visual disturbances.35 In patients with glaucoma and other optic neuropathies, adaptive optics has also revealed evidence of structural changes in cone photoreceptors when there is permanent damage to the overlying inner retinal layers.36
Doppler imaging – assessment of blood flow
Basic principles
The Doppler effect, first described in the 19th century by the Austrian physicist Christian Doppler, is the change in frequency of a wave as it is reflected off a moving object: if the reflecting object is moving away from the observer/transducer, the frequency of the reflected waves is lower than that of the waves emitted, and vice versa. As the frequency shift is dependent on the velocity of the moving object, this effect can be used to measure the velocity of blood flowing in the eye.37 Importantly, the Doppler effect is also dependent on the angle between the axis of the wave and the axis of movement of the object. Therefore, if the observer/transducer is not parallel to the axis of the moving object calculations must be performed using a Doppler angle correction formula:
Utilization of the Doppler effect in ocular imaging systems allows calculation of ocular blood flow velocities.37 Reductions in blood flow velocity may occur as a result of vascular degenerative changes in diseases such as diabetic retinopathy, or as a result of vascular occlusion in diseases such as central retinal vein occlusion (CRVO). However, changes in retinal blood flow velocity may also occur as a result of either constriction or dilatation of vessels during normal physiological autoregulation (according to Bernoulli’s principle, constriction of a blood vessel causes a conversion of pressure into kinetic energy, thereby increasing the velocity of the blood, but decreasing its pressure). Therefore, measurements of the absolute quantities of “blood flow” may represent a more clinically relevant parameter.
Blood flow (Q) is the volume of blood passing through a vessel in a given time, and is determined by the velocity of the blood (V) multiplied by the cross-sectional area of the blood vessel through which it passes (πr2).38 Consequently, if blood flow velocity can be measured using the Doppler effect, and the diameter of the blood vessel can also be measured, then absolute values for blood flow may be determined. Measurements of retinal vascular diameter can be acquired from fundus images obtained with standard optical imaging techniques (e.g., fundus photography).39,40 However, in order to measure retinal vascular diameters in real units of length, the magnification of the image induced by the eye, as well as the magnification of the camera, must be known (failure to account for such magnification will result in significant errors).
Non-Doppler assessment of retinal blood flow
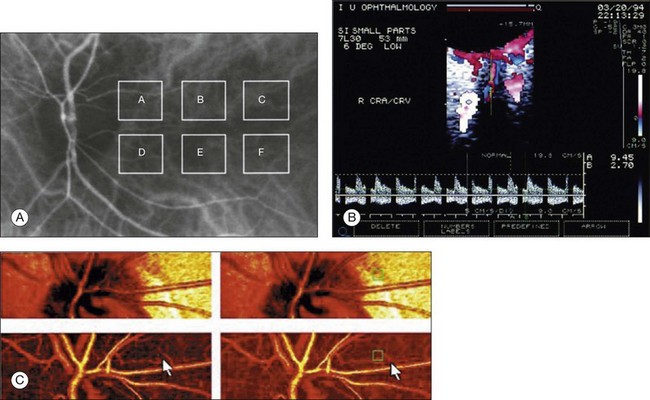
Measurement of retinal blood flow is possible using quantitative angiography, based on use of dye dilution techniques.37,39,40 In this method, the concentration of fluorescent dye within the blood at a specific observation point is graphed over time, producing a dye dilution curve. The enhanced contrast provided by SLO systems is particularly suited to this approach, and it can be used to evaluate vascular parameters such as retinal arteriovenous passage time and mean dye velocity. The increased contrast provided by SLO images also allows measurement of blood velocities in the small vessels surrounding the fovea and the optic nerve head (in the future, this technique is likely to be enhanced through the incorporation of adaptive optics).40 Indocyanine green angiography may also be used to evaluate the choroidal circulatory flow, as the infrared light sources employed penetrate the RPE more efficiently than the shorter wavelengths used in fluorescein angiography. In one analysis method, the choroid is divided into six regions, and dye dilution curves are created for each region (Fig. 5.7A). Parameters such as 10% filling time, and maximum brightness, can then be calculated.40 SLO-based fluorescein and indocyanine green angiography provide significant information regarding retinal and choroidal blood velocities. However, without measurement of corresponding vascular diameters, it is not possible to measure blood flow. In addition, the invasive nature of the dye injections required for these approaches precludes their routine use in many clinical scenarios.
Doppler ultrasound
Color Doppler imaging (CDI) is an ultrasound technique that combines B-scan gray-scale imaging of tissue structure, color representation of blood flow based on Doppler shifted frequencies, and pulsed-Doppler measurement of blood flow velocities (Fig. 5.7B).37,40 As in other Doppler-based methods, blood flow velocity is determined by the shift in the frequency of sound waves reflected from the moving blood column. Color is then added to the B-scan gray-scale image of the eye to represent the motion of blood through the vessels. The color varies in proportion to the flow velocity and is typically coded red-white for motion toward the probe, and blue-white for motion away from the probe. Using the color Doppler image, the operator can then identify the vessel of interest and place the sampling window for pulsed Doppler measurements (this window is generally situated in the center of the vessel). At this point, the general flow axis of the blood flow is detected simply by observation to determine the Doppler flow angle for the appropriate calculation of velocity. Flow–velocity data are then plotted against time, and the computer identifies the peak and trough of the waves.
Current CDI analysis focuses primarily on the arteries located behind the globe: ophthalmic artery, central retinal artery, and posterior ciliary arteries. CDI can be used to describe blood flow to the eye in terms of a set of well-defined parameters including: (1) peak systolic velocity (PSV); (2) end-diastolic velocity; and (3) resistance index.37,40 It does not provide absolute measurements of blood flow (no quantitative information on vessel diameter is obtained). With a 7.5-MHz probe, CDI is able to resolve structures 0.2 mm (200 µm) or larger, but can also be used to measure Doppler shifts in smaller vessels such as the posterior ciliary arteries (diameter of approximately 40 µm). CDI may be of particular use for the primary evaluation and follow-up of orbital vascular lesions, such as varices, arteriovenous malformations, and carotid-cavernous sinus fistulas. It has also been used for the semiquantitative assessment of perfusion in retinal and choroidal vascular disease. Specifically, in patients with CRVO, the central retinal artery PSV and end-diastolic velocity have been found to be much lower than in unaffected fellow eyes and in healthy control subjects.41 Patients with ocular ischemic syndromes also present reduced PSVs in the central retinal and posterior ciliary arteries, as well as increased resistance.42
Stay updated, free articles. Join our Telegram channel

Full access? Get Clinical Tree


