Visual Evoked Potential
Gary L. Trick
Barry Skarf
The visual evoked potential (VEP), also known as the visual evoked response (VER) or the visual evoked cortical potential (VECP), is an electrophysiologic signal that can be extracted from the electroencephalographic activity recorded from the human scalp and is generated by neurons in the brain in response to visual stimulation. The VEP was initially described by Adrian and Mathews1 in 1934 and has been used in clinical and research laboratories for almost 50 years. For many years, there were no standard methods for VEP recording or analysis. Various laboratories recorded the VEP using dissimilar techniques, and consequently, there were many divergent opinions concerning the neurophysiologic basis of the components of the response, the clinical usefulness of the technique, and the abnormalities associated with specific diseases. This problem was exacerbated in that many laboratories recorded VEPs without obtaining an accurate ophthalmologic examination of the patient. As a result, the exact visual status of the patient and the influence of the patient’s visual status on the test results were unknown. It is now well established that VEPs should always be performed with the patient’s appropriate refractive correction because uncorrected refractive error will confound the results. To address these problems, the International Society for Clinical Electrophysiology of Vision published a recommended standard for VEP measurement and reporting.2 People interested in recording or evaluating VEPs, either clinically or experimentally, are urged to read and follow these guidelines.
Methods
Measuring a VEP and using this technique clinically became practical after the development of the signal averaging computer. This instrument improves the signal-to-noise ratio of the bioelectrical activity generated by visually active cortical neurons and recorded from scalp electrodes. The signal-to-noise ratio is the ratio of the cortical visual response to the underlying electroencephalographic (EEG) activity.8,9 The VEP is triggered by, and time-locked to, a precisely defined and repetitive visual stimulus, whereas the EEG signal is random in relation to the visual stimulus. The signal averaging computer averages all the time-locked activity (signal) recorded in a defined interval, whereas the underlying EEG activity (noise) that is not time-locked is canceled out. Consequently, signal averaging improves the reliability and consistency of responses and makes experimental and clinical studies feasible. Nevertheless, it is important to recognize that artifacts that are time-locked to the stimulus still can distort the VEP.
To record the VEP, one or more standard silver-silver chloride or gold disc EEG electrodes are fixed to the scalp with collodion glue or conducting paste. The recording electrodes are placed on the patient’s scalp after cleaning the scalp with detergent or ethanol. The impedance of the scalp-electrode connection should be kept below 5 kΩ. Improper skin preparation or drying of the conducting paste will increase impedance and distort the morphology of the VEP waveform. Most laboratories use a single active electrode placed on the midline approximately 2 cm above the inion, the ridge that runs just above the joint with the neck at the back of the skull. When chiasmal or retrochiasmal dysfunction are suspected, use of a single recording electrode may be inadequate. In this case, multichannel recordings often are necessary with additional active electrodes placed laterally over each occipital lobe. In specialized cases that require signal source localization VEPs may be recorded using a large montage of electrodes covering all head regions.
In most cases, bipolar recordings are used with the reference electrode placed on the forehead. A ground that is electrically zero cannot be found on the body, but for practical purposes, the mastoid, a single earlobe, the linked earlobes or an arm provide acceptable sites for the ground electrode.
During recording, the VEP signals from the active and reference electrodes are fed into a differential amplifier (Fig. 105.1) that rejects electrical activity that is common to both electrodes, assuming it is noise that is interfering with the relevant visually driven signals. Amplification of the input signal by 20,000 to 50,000 times is generally is adequate for recording the human VEP. Additional signal conditioning is achieved with high- and low-bandpass filters. Filter settings must be carefully chosen to avoid selecting too narrow a band and losing a portion of the relevant signal. Filtering also can alter the recorded latency of the response. Faulty electrical connections or improperly placed ground or reference electrodes may allow 60-cycle activity to distort the waveform morphology. In addition, electroretinogram (ERG) potentials can contaminate signals recorded from VEP electrodes if they are placed too far anterior. The EEG alpha activity and myogenic potentials from the face, scalp, and neck that occur in synchrony with the VEP will distort the recorded waveform, whereas artifacts that are not time-locked to the stimulus, such as eye blinks and patient movement, cause less interference.
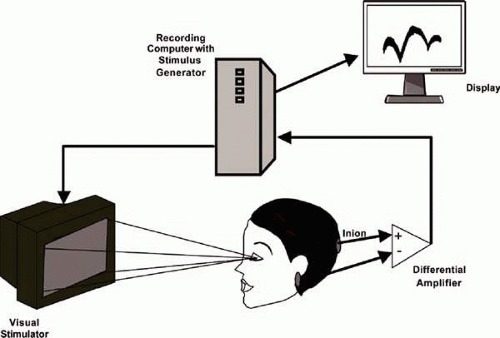 FIGURE 105.1 The typical recording arrangement for visual evoked potentials. The patient is seated at an appropriate distance from the visual stimulus wearing the appropriate refraction (corrected for the test distance). The appropriate recording (active) electrode is attached to the posterior scalp and connected to the positive input of the differential amplifier. A similar reference electrode is attached to a visually neutral site on the head (e.g., the earlobe) and connected to the negative input of the differential amplifier. A ground (GND) electrode is attached to the forehead or arm. A stimulus generator is used to select the desired stimulus type (flash, pattern reversal, or pattern onset-offset), temporal frequency, pattern type (grating or checks), and size of the pattern elements. The stimulus generator also sends a signal to the signal averaging computer that is synchronous with the stimulus presentation and triggers each averaging epoch. The signal averaging computer usually controls the duration of the averaging epoch, the number of averages collected, the signal conditioning (e.g., filtering), and signal analysis. |
The amplified and filtered signal is then fed into the signal averaging system that averages the time-locked activity to improve the signal to noise ratio. The number of signals included in an averaged response depends upon many factors including the nature and strength of the visual stimulation. However, as a general rule in clinical settings a minimum of 64 to 100 signals should be included in each averaged response and, in order to establish the reproducibility of the findings, there should be at least two averaged responses for each test condition.
Visual Stimulation
The VEP waveform is highly dependent on the type and rate of stimulus presentation. Three predominant types of visual stimuli are used to elicit VEPs: diffuse flash, pattern reversal, and pattern onset-off. The responses obtained with each of these types of stimulation have a distinct and characteristic waveform (Fig. 105.2). Additionally, the multifocal VEP is now being utilized in many clinical settings. It should be noted, however, that a wide variety of other methods including motion, chromatic, binocular or dichoptic, and multifrequency stimulation techniques may be useful in specialized circumstances.
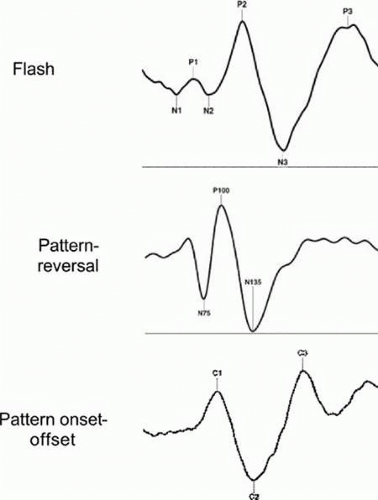 FIGURE 105.2 A schematic illustration of the flash, pattern-reversal, and pattern onset-offset visual evoked potentials (VEPs) with their respective components. The flash VEP consists of a series of negative and positive deflections; the most prominent and reproducible of these peaks are the second negative peak (N2), with a normal latency of approximately 70 to 90 msec, and the second positive peak (P2), with a normal latency of approximately 100 to 120 msec. Pattern-reversal VEPs normally consist of three principal features: an initial negativity with a latency of approximately 70 to 80 milliseconds (N75), a larger positive component with a latency of approximately 90 to 110 msec (P100), and a large negative component with a latency of approximately 130 to 140 msec(N135). Typically, the pattern onset-offset VEP is characterized by three prominent components designated C1, C2, and C3 C1 is the initial positive component and has a latency of approximately 70 to 80 msec. C2 is a large negative component and has a latency of approximately 100 to 120 msec. C3 is the second major positive component and has a latency of approximately 140 to 150 msec. |
The VEP waveform also depends on the rate of stimulus presentation. Two distinct waveform morphologies are associated with low and high temporal frequency stimulation: transient and steady-state responses, respectively. To obtain a transient response, visual stimuli are presented at a temporal frequency low enough to permit the brain activity to decrease to baseline levels between responses (often two to four reversals per second for a patterned stimulus or 1 to 2 Hz for a diffuse flash). The transient VEP has a waveform with discrete negative and positive deflections, each with a measurable latency from the stimulus onset (Fig. 105.3). The second type of response, termed the steady-state VEP, is elicited by presenting stimuli at a temporal frequency above approximately five reversals per second for a pattern stimulus or 5 Hz for a diffuse flash. The steady-state VEP has a more sinusoidal waveform (Fig. 105.3). Furthermore, discrete waveform data are lost during steady-state stimulation, but response latency can be determined by calculating the shift in phase of the second harmonic of the response.9 The transient VEP is used more frequently in the clinic than the steady-state response.
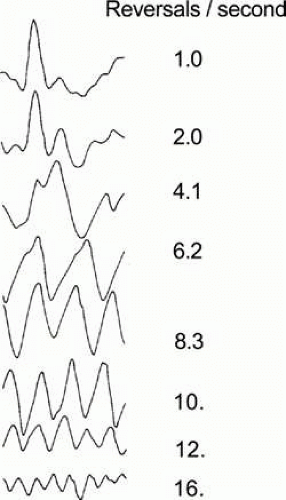 FIGURE 105.3 The variation in the waveform of the pattern-reversal VEP as a function of temporal frequency is illustrated. As temporal frequency is increased from 1.0 reversal per second (transient) to 16.6 reversals per second (steady-state) the waveform shifts from having a single major positive peak to a more sinusoidal pattern with multiple positive and negative peaks. Source: Figure courtesy of Dr. Vittorio Porciatti. |
Evaluating the VEP Waveform
Because the shape of the VEP waveform (i.e., the waveform morphology) can vary significantly within and between patients, most experimental and clinical studies limit consideration to two features of the waveform that are considered the most reliable: the response amplitude and the response latency (sometimes referred to as implicit time). VEP amplitude is a measure of the size of the response, whereas VEP latency reflects transmission and processing time in the retina-to-occipital cortex pathway after the onset of stimulation. Decreases in VEP amplitude generally result from a reduction in the number or sensitivity of neurons in the retinocortical pathway. Increases in VEP latency reflect delays in retinocortical conduction that can result from defective retinal processing, defects in the myelin of the visual pathway from the optic nerve to the occipital cortex, or even synaptic abnormalities in the retina or occipital cortex. VEP amplitude measurements are typically made between the peaks and troughs of the waveform components. Response timing is quantified in terms of the latency of the response. This is a measurement of the time from the onset of the stimulus presentation to the peak of the appropriate waveform component. Amplitude and latency measurements are particularly appropriate for characterizing the transient responses. For steady-state responses, more complex analysis procedures are necessary. The most popular of these is the use of Fourier analysis to quantify the power and phase of the harmonic components of the signal.
The Flash Visual Evoked Potential
The earliest VEP studies used photic flashes produced by photostimulators to generate spatially unstructured or diffuse flash stimuli.1,10,11,12 Original descriptions of the waveform of the VEP obtained with flash stimuli disagreed concerning many of the waveform characteristics of the response. These discrepancies probably resulted from various factors, including differences in the electrode positions, the flash intensities, and the temporal frequencies of the stimuli used in different laboratories. However, there is now reasonably good agreement that the flash VEP waveform consists of a complex series of waves with positive and negative peaks that are designated in numerical order (Fig. 105.2). The most prominent and reproducible of these peaks are the second negative peak (N2), with a normal latency of approximately 70 to 90 msec, and the second positive peak (P2), with a normal latency of approximately 100 to 120 msec. It is also well established that the amplitude of the VEP to diffuse flashes varies with the temporal frequency of stimulus presentation. The largest amplitude is obtained with flashes that are presented at approximately10 Hz. In the clinic, the flash VEP is most often used for patients with very poor visual acuity, media (cornea, lens, vitreous) opacities, poor fixation (including infants), or uncorrected refractive error. In many of these instances a pattern VEP cannot be obtained, but a measurable flash VEP can be helpful in the assessment.
The flash VEP should be elicited by a flash that subtends a visual field of at least 20 degrees of visual angle, although full-field (ganzfeld) illumination is preferred. The amplitude of the flash VEP depends on the luminance of the flash stimulus. For the flash VEP, a luminance of 1.5 to 3.0 photopic candelas sec/m2 is recommended. A decrease in the brightness of the stimulus reaching the retina, produced by miosis (accommodative or pharmacologic), neutral density filters, or, rarely, dense cataracts results in latency delays (i.e., increased latency). For clinical studies transient stimuli with flash rates not exceeding 1.5 Hz are generally suggested.
The Pattern Visual Evoked Potential
The development of techniques that use patterned stimuli to elicit bioelectrical signals from the visual cortex was a methodologic advancement that greatly increased the clinical usefulness of the VEP. This approach takes advantage of the functional organization of the proximal retina and visual cortex, which is preferentially sensitive to spatially patterned stimuli. Two types of patterned stimuli, contrast-reversing or onset-offset patterns, are generally used to record pattern VEPs.
Pattern-reversal VEPs are recorded using a uniform repetitive checkerboard or bar grating pattern in which the pattern elements are contrast-reversed in a fixed sequenced. A black and white checkerboard is most frequently used. The overall luminance of the display and the contrast between the pattern elements should remain constant throughout the entire recording. The background or room luminance should approximate the mean for the light and dark checks. For clinical applications at least two pattern check sizes (1 degree and 15 min) should be used. The visual field diameter should exceed 15 degrees in its narrowest dimension. The waveform of the pattern-reversal VEP (Fig. 105.2) normally consists of three principal features: an initial negativity with a latency of approximately 70 to 80 msec (N75), a larger positive component with a latency of approximately 90 to 110 msec (P100), and a large negative component with a latency of approximately 130 to 140 msec (N135). In visually normal adults, the maximal pattern-reversal VEP is evoked with a check size between 10 and 20 minutes of arc.13,14 Smaller or larger checks evoke smaller amplitude pattern VEPs. Larger checks may elicit responses that confound pattern and luminance contributions.14
For the pattern onset-offset VEP, the elements in the pattern are abruptly alternated with a spatially unstructured field of identical space-averaged luminance so that when the pattern appears or disappears there is no change in mean luminance. Generally, the pattern is off (diffuse background) for longer than it is on. ISCEV standards recommend a cycle of 400 ms off and between 100 and 200 ms on. Typically, the pattern onset-offset VEP has three prominent components designated C1, C2, and C3 (Fig. 105.2). C1 is the initial positive component and has a latency of approximately 70 to 80 msec. C2 is a large negative component and has a latency of approximately 100 to 120 msec. C3 is the second major positive component and has a latency of approximately 140 to 150 msec. As was the case for the pattern-reversal VEP at least two pattern sizes (1 degree and 15 min) should be used and the visual field stimulated should exceed 15 degrees. The pattern onset-offset approach can be useful in distinguishing the pattern and luminance contributions in the pattern VEP.15
The VEP obtained with pattern stimulation, either pattern reversal or pattern onset-offset, is dominated by contributions from the macula.5,16 This is not surprising because the central few degrees of vision have a large representation in the striate area and are located posteriorly in the occipital lobe, closer to the surface electrodes. Checks smaller than 20 minutes evoke a large pattern VEP when the field is limited to the macula field.17 The peripheral retinal contribution to the pattern VEP is the result of pattern and luminance changes rather than of a true pattern response.7,17 Large check stimulation of the retina peripheral to the macula may evoke a large amplitude VEP because of luminance components.
Checks and gratings are the patterns most frequently used as pattern VEP stimuli. A check is a complex pattern stimulus with spatial frequency power along each diagonal and in the direction of the horizontal and vertical edges. Mathematical analysis of the spatial frequency in each direction of power shows a fundamental spatial frequency with higher harmonics because the sharp borders can be described mathematically only as a square wave.18 In comparison, sinusoidal gratings have gradually appearing and disappearing borders and are described by a single-frequency (fundamental) sinusoidal function with power along only one axis. A sine wave grating of high, medium, or low spatial frequency (fine to coarse) probably excites those neurons in the visual cortex tuned to that spatial frequency19 and another group of neurons that are tuned to the axis or orientation of the grating.20,21 Sine wave grating pattern VEP studies that measure sensitivity to gratings oriented horizontally, vertically, and at 135-degree and 45-degree axes using high, medium, and low spatial frequencies may uncover subtle defects in the visual system that are missed with checkerboard pattern VEP. Doing so, however, is impractical in clinical practice. In addition, large amounts of astigmatism, even if corrected with a lens, may depress the pattern VEP at one orientation of the stimulus because of meridional amblyopia.22 When pattern stimulation is used, refractive errors must be corrected so that the pattern is not degraded at the retina.13 Some laboratories attempt to circumvent the problems associated with image degradation by using large pattern elements. However, this does not avoid blurring of the edges of the elements, and therefore this technique is not optimal.
For pattern stimulation, mean luminance should be at least 40 candelas/m2. More importantly, however, the contrast of the check or grating pattern should be 75% or higher, especially for clinical studies.2 The contrast of a pattern is defined as:
100 × (Lmax – Lmin)/Lmax + Lmin),
where Lmax = the luminance of the light checks or gratings, and Lmin = the luminance of the dark checks or gratings.
For pattern-reversal and pattern onset-offset VEPs, the amplitude of the responses increases as contrast is increased.23,24,25,26 The latency of the response increases as contrast is decreased.27,28 The pattern onset/offset response exhibits greater intersubject variability than the pattern reversal VEP but shows less sensitivity to confounding factors such as poor fixation or eye movements.
The Multifocal VEP
As mentioned earlier the conventional pattern VEP is predominantly generated by cortical elements receiving projections from the central retina. It has been estimated that the central 2 degrees of visual field contributes 65% of the response.7,8,9,10 Furthermore, the conventional VEP is a mass response reflecting the integrated neural response of cortical cells responding to stimulation across the entire stimulated area of the visual field. Consequently, the conventional VEP has limited ability to reflect dysfunction in either local or noncentral areas. However, recent developments in multifocal stimulation and recording techniques have provided a new method for assessing visual function and expanded the scope of the VEP to enable assessment of multiple sites out to 20- or 30-degree eccentricity.29,30,31 This technique is known as the multifocal VEP (mfVEP). With the mfVEP it is possible to extract cortical responses that are directly related to stimuli presented in a large number of discrete of locations in the visual field, resulting in a type of objective perimetry. Consequently, mfVEP measurement permits the mapping of dysfunction in either relatively small regions or over larger confluent areas.
Generally mfVEP recordings are performed using visual stimuli that are comprised of an array of hexagonal elements arranged in a dartboard-type pattern and displayed on a CRT. Each hexagonal region is made up of an equal number of black and white elements (often checks). The spatial layout of a typical stimulus array is depicted in Fig. 105.4. The hexagons are scaled with eccentricity. The black and white elements within each sector have a specified probability of reversing (usually 0.5) on any pair of frame changes and the reversal pattern for each sector is based upon a binary pseudorandom sequence (m-sequence) that guarantees that no stimulus sequence is repeated during an examination and that all stimulus sequences appear only once. As a result, the multiplexed signal can be separated into signals specific to every test sector to produce a spatially discrete pattern of responses. Furthermore, by virtue of the fact that a very large number (usually many thousands) of stimulus events are averaged, the small, local, electrical signals generated can be extracted with high signal-to-noise ratios. Generally, recordings are made in multiple (e.g., 16) abbreviated segments. Recording quality is monitored by observation of the real-time signal voltage. The stability of fixation and eye movements are monitored and recording segments contaminated by either electrical artifacts (significant noise or amplifier saturation) or loss of fixation are discarded and repeated. Abnormal mfVEPs have been described in glaucoma and various other optic neuropathies. Abnormal mfVEPs have also been detected in patients’ amblyopia.32,33
 FIGURE 105.4 An example of a typical multifocal VEP stimulus which is a cortically scaled dartboard stimulus consisting of a number of segments each containing a black-and-white checkerboard pattern that is phase alternated at a pseudorandom frequency. |
Clinical Application
Optic Neuropathies
Optic neuritis and multiple sclerosis (MS) have been studied extensively with the VEP. Initial studies described a decrease in amplitude and an increase in latency of the flash VEP in MS.34,35,36 Halliday et al.37,38,39,40,41 described prolonged pattern VEP latency in a high percentage of patients with optic neuritis. Furthermore, Halliday and coworkers found that the pattern VEP is frequently abnormal in patients with MS who have no other clinical evidence of optic nerve disease. Since those seminal studies, patients with optic neuritis and MS have been examined using various VEP techniques, and different defects have been observed. Methodological differences have contributed to this disagreement, but the diverse findings probably are also related to the heterogeneous nature and extent of the pathophysiologic changes in the study groups. Variations in the location and age of plaques, number of areas affected in the visual pathway, and specific fiber sizes affected all may have contributed to this discrepancy. Nevertheless, there is now a general agreement that testing with pattern stimuli will elicit a significantly delayed VEP (Fig. 105.5) in approximately 84% of patients with definitive MS, 65% of patients with probable MS, and 42% of patients with possible MS.42,43,44 In patients with MS and a history of optic neuritis, this figure is approximately 92%, and for patients with visual acuity of 20/20 and no definite history of optic neuritis, this figure is approximately 40%.26 The changes in response latency that occur in optic neuritis and MS are generally attributed to conduction delays and these delays appear to increase as transmission is slowed with increasing body temperature45 and diminish with cooling of the body.46 When pattern-reversal VEPs are obtained with sinusoidal gratings that stimulate subsets of cortical neurons tuned to specific orientations,21,23 the sensitivity of the VEP for detecting abnormalities in MS patients is greater than when checks are used and there appears to be an increased frequency of delayed responses.47 Orientation-dependent delays associated with MS can be demonstrated by using vertical, horizontal, and oblique gratings to evoke VEPs.48,49
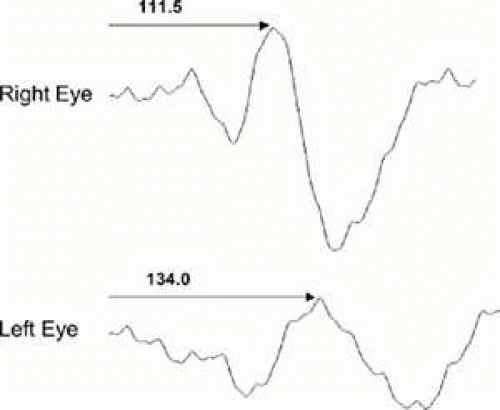 FIGURE 105.5 Representative pattern-reversal VEPs from a patient with unilateral optic neuritis. The VEP waveform recorded from the right eye shows a normal amplitude and latency (111.5 msec), whereas the response obtained from the left eye is of similar amplitude but is delayed by 22.5 msec. |
Amplitude abnormalities also occur in patients with MS who have no significant vision loss; however, these occur less frequently than latency increases.50 During the acute stage of an optic neuritis attack, when vision is at the level of light perception, the pattern VEP may be immeasurably small.51 If visual acuity is good, however, the VEP typically is recordable albeit delayed. Response latency may normalize during the recovery period,42 and the period of normalization may last 2 years or longer.52 Psychophysically determined contrast sensitivity losses selective for specific spatial frequencies53,54 are found in patients with MS and no clinically apparent optic neuropathy. Pattern-reversal VEPs obtained with coarse, intermediate, and fine gratings (low to high spatial frequency) appear to be correlated with the psychophysical contrast sensitivity function defects in MS.55 VEP contrast threshold elevations show losses with orientation and spatial frequency selectivity in patients with MS.56 Despite recovery to 20/20, a careful neuro-ophthalmologic examination of a patient with MS may show an afferent pupillary defect, color vision deficiency, disc pallor, or nerve fiber layer losses in almost all individuals with a history of visually significant optic neuritis. If both eyes have been affected, no afferent pupillary defect may be seen. Subtle change in the disc and nerve fiber layer may be difficult to distinguish in MS with no definitive history of optic neuritis. In these cases, the pattern-reversal VEP provides objective information about conduction along the retinocortical pathway.
In a patient without a history of optic neuritis and clinically symptomatic disease involving the white matter outside the visual sensory pathway, the VEP can be useful in establishing a diagnosis of MS. It should be remembered, however, that other neurodegenerative conditions also can cause a delay of the pattern VEP and lead to confusion in the diagnosis. Therefore, VEP findings in these patients must be interpreted with caution and always in the context of a complete ophthalmologic and neurologic examination.
Diseases that inflame the optic nerve or preferentially cause demyelination are often associated with a delayed VEP latency. Optic neuropathy or subclinical anterior visual pathway involvement by sarcoidosis can delay the pattern VEP.57 In Leber’s optic neuropathy, there is devastating vision loss, including loss of visual acuity, color vision defects, and visual field abnormalities.58,59 The earliest VEP abnormalities in Leber’s optic neuropathy appear to be increases in P100 latency or changes in the waveform morphology (i.e., the development of a double-positive peak). With progression of the condition, the amplitude of the VEP decreases to a point where responses become immeasurable. Patients with thyroid ophthalmopathy may have a prolonged latency of the pattern VEP before a clinically apparent optic neuropathy.60 Subacute combined degeneration secondary to vitamin B12 deficiency causes demyelination and prolongs the p100 latency pattern VEP latency,61,62 even with an unremarkable neuro-ophthalmologic examination.63 On treatment there is normalization of the p100 latency.64,65
Not all causes of optic nerve lesions are associated with delayed conduction and a consequent increase in latency. The VEP has been used extensively to investigate many of these optic nerve disorders.66 Over 97% of patients with optic nerve head drusen exhibit abnormal VEPs to flash stimulation.67 An initial report that drusen of the optic disc rarely prolong the P100 of the pattern VEP, even when they cause field defects,68 has now been contradicted by several studies describing significant pattern VEP delays in these cases.69,70,71 Additionally, in anterior ischemic optic neuropathy, the amplitude of the flash or pattern VEP is often depressed,72,73,74 whereas prolonged latency is observed less frequently and may be limited to patients with the arteritic form of the disease.75 Similar findings are noted with the pattern VEP in patients with an unknown optic atrophy and tobacco or alcohol optic neuropathy.76,77
Although the mf VEP is still largely experimental, there have been a number of reports concerning the potential utility of the mfVEP as a diagnostic tool in patients with demyelinating diseases, amblyopia, and retinal disorders. In patients with optic neuritis changes in optic nerve conduction velocity can be tracked with the mfVEP. At least two studies have shown mfVEP can be used to track local optic nerve damage and its long-term recovery in optic neuritis patients.78,79 Field defects associated with, optic neuritis and unilateral compressive optic neuropathy80 have been mapped using this technique.81,82 Other studies suggest that compressive optic neuropathy decreases the amplitude and increases the latency of the mfVEP.83,84 The changes in latency were similar to those seen in optic neuritis but larger than those in ischemic optic neuropathy and glaucoma.
Glaucoma
Glaucoma is a slowly progressive anterior optic neuropathy in which irreversible visual dysfunction results from damage to the retinal ganglion cells and their axons. There have been numerous studies of the VEP in patients with glaucoma and glaucoma suspects, but the results have not been particularly impressive. Decreases in pattern VEP amplitude and prolonged VEP latencies are found in many patients with glaucoma and some glaucoma suspects.85,86,87 Steady-state VEPs appear to be more sensitive in detecting glaucomatous damage than transient responses,86 and VEPs elicited by sinusoidal gratings may be prolonged in patients with increased intraocular pressure, but without field loss.87 Unfortunately, it is unclear whether patients with ocular hypertension who later develop glaucoma consistently have VEP abnormalities before visual field defects appear. In addition, studies have shown that the pattern ERG, also an objective electrophysiologic technique, may be even more useful in detecting and following glaucoma-related ganglion cell loss.88,89
Stay updated, free articles. Join our Telegram channel

Full access? Get Clinical Tree


