Tonometry, Tonography, and Aqueous Fluorophotometry
Pratap Challa
Leon W. Herndon
David K. Dueker
Tonometry
Determination of the intraocular pressure (IOP) is a central feature in the diagnosis and management of the glaucomas. A true measurement of IOP requires a direct fluid connection to the anterior chamber. Cannulation of the anterior chamber for measurement of IOP is used frequently in the laboratory and occasionally during surgery. This approach entails too many hazards for the routine clinical management of glaucoma, however. Therefore, we generally use indirect measurements of IOP—tonometry.
The pressure inside a flexible sphere can be estimated by using fixed forces to create measurable deformations of the wall or, conversely, by using variable forces to produce predetermined deformations of the sphere wall. Both approaches have been used in tonometry of the eye. The methods used are based on the Imbert-Fick principle, which states that if a plane surface is applied to a spherical membrane to cause a flattening of surface area, the pressure inside the spherical membrane will be equal to the applied force divided by the area of contact (Fig. 1).1,2 It must be emphasized that the Imbert-Fick principle is considered valid when the sphere is perfectly round, dry, elastic, and infinitely thin. Because the wall of the eye is none of these, application of the Imbert-Fick principle to tonometry requires careful attention to variations caused by the fundamental nature of the ocular tissues and to careful calibration of all tonometers in the laboratory.
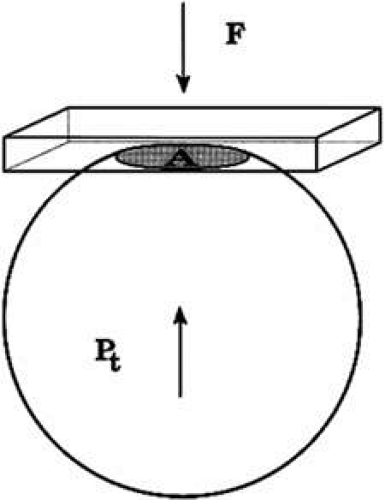 FIGURE 1. The Imbert-Fick principle. When a plane surface is applied to a flexible sphere with a force (F) causing an area (A) to be flattened, the pressure inside the sphere, Pt = F/A. |
During the years 1905 to 1926, Hjalmar August Schiøtz, a Norwegian ophthalmologist, produced and refined a mechanical indentation tonometer.3 This tonometer uses a weighted plunger that rides freely in the center of a hollow cylinder (Fig. 2). The outer cylinder has a footplate with a concave radius of 15-mm curvature, which rests on the cornea during measurement. The weighted plunger indents the cornea centrally, and the amount of indentation is transferred to a scale at the top of the instrument by a lever mechanism, which converts 0.05 mm of plunger movement into 1-mm units on the read-out scale. It is clear that a soft eye allows more plunger indentation than does a hard eye; the Schiøtz scale displays large amounts of indentation as high-scale readings and small amounts of indentation as low-scale readings.
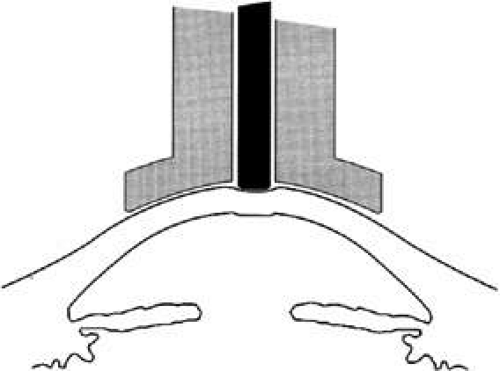 FIGURE 2. Schiøtz tonometry. A hollow footplate (gray) rests on the cornea, while a freely moving weighted cylinder (black) indents the cornea. The softer the eye, the greater the amount of indentation. The amount of indentation is multiplied by a lever mechanism and displayed as a “Scale Reading” at the top of the instrument. Standardized tables, based on these scale readings and considering the weight on the central cylinder, provide an estimate of IOP. |
It is necessary to use calibration tables to translate the readings made during tonometry into an estimate of the pressure that existed in the eye before the application of the tonometer. IOP during tonometry is called Pt, whereas IOP in the resting state before application of the tonometer is known as “P naught” or P0. One of the major contributions of Dr. Jonas Friedenwald was the calibration of the Schiøtz tonometer, which included a careful scientific study of the relation between Pt and P0.4,5
The indentation of the cornea caused by the Schiøtz tonometer displaces a small volume of fluid into the eye. This displaced fluid is accommodated by stretching or expansion of the ocular coats. Dr. Friedenwald found that the volume of fluid displaced was related to the logarithm of Pt by a factor that he called scleral rigidity. The tables that are commonly used to estimate IOP based on a Schiøtz scale reading assume an eye with normal scleral rigidity. It is important to remember that the tables give inaccurate estimates of IOP in eyes that do not have normal scleral rigidity.
Using an applanation technique in which the cornea is flattened—not indented—eliminates many of the uncertainties of indentation tonometry. In the classic method developed by Goldmann, a circular area of the central cornea is flattened by pushing a plastic tonometer tip against the eye. The circle of applanation is delineated by a fluorescein-stained tear film (Figs. 3 and 4). The force required to flatten a circle of 3.06 mm is in grams a tenth of IOP in mmHg. Therefore, a force of 1.6 g is required to flatten this circular area when IOP is 16 mmHg. The 3.06-mm diameter circle of applanation was chosen because of this simple 10:1 relation between IOP and grams of force; this area is within the range in which the natural bending force of the cornea is canceled by the capillary attraction created by the tear film between the tonometer head and the cornea.6,7 Flattening so small an area of the cornea creates little fluid displacement within the eye. Therefore, scleral rigidity is not a major factor in Goldmann applanation tonometry.
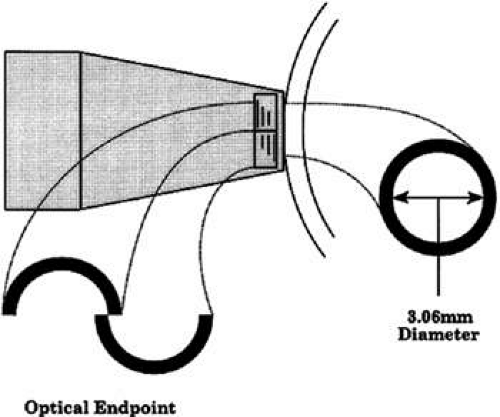 FIGURE 3. Goldmann applanation tonometry. When the cone tip is pressed against the anesthetized cornea, a small circular area is flattened. The applanated area appears as a dark circle surrounded by a narrow ring of fluorescent tear film. Opposing prisms in the tip of the cone split the image, so that the viewer sees two dark half circles, each with a narrow fluorescent outer border. The force on the cone is adjusted until the inner corners of the fluorescent half rings just touch; at this optical end point, the applanated area is correct: a circle with diameter = 3.06 mm. |
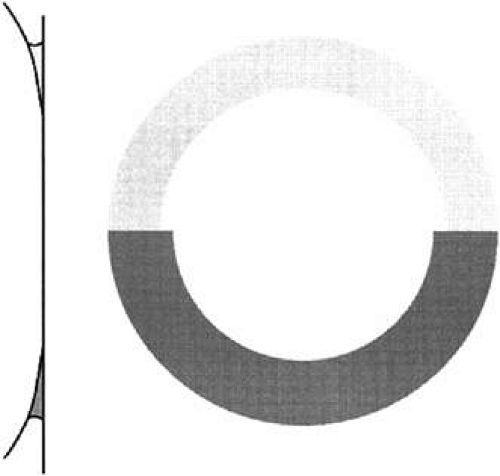 FIGURE 4. Effect of fluorescein concentration on Goldmann applanation tonometry. The circle of applanation is outlined by a meniscus of fluorescein-stained tear film. If the tear film has too low a concentration of dye (upper half of diagram), it is difficult to define the thin inner edge of the meniscus and the examiner may perceive an enlarged circle—thus underestimating IOP. (From Moses RA: Fluorescein in applanation tonometry. Am J Ophthalmol 49:1149, 1960 with permission.) The optimal fluorescein concentrations have been determined, and the most reliable way to obtain accurate readings is through use of a premixed anesthetic/fluorescein drop. (From Grant WM: Fluorescein for applanation tonometry. More convenient and uniform application. Am J Ophthalmol 55:1252, 1963; Quickert MH: A fluorescein-anesthetic solution for applanation tonometry. Arch Ophthalmol 77:734, 1967 with permission.) Though a “ring of contact” may be seen with anesthetic alone, measurements made without fluorescein underestimate IOP. (From Hoffer KJ: Applanation tonometry without fluorescein. Correspondence. Am J Ophthalmol 88:798, 1979; Roper DL: Applanation tonometry with and without fluorescein. Am J Ophthalmol 90:668, 1980 with permission.) |
Other tonometric instruments are available. It is a credit to the design and precision of the Goldmann instrument that virtually all new tonometers are evaluated in comparison with it. The air-puff tonometer (American Optical) works on an applanation principle in which the force required to flatten a portion of the cornea is delivered in a carefully calibrated bolus of air rather than through mechanical contact.8 The moment of flattening is recorded optoelectronically and converted into an estimate of IOP by a computer in the machine. This instrument may be useful when many patients need to be screened or it is desirable or necessary to avoid topical anesthesia.
When the cornea is scarred, irregular, or edematous, it is useful to have a tonometer available that does not depend on an optical end point for its measurement. Two instruments are useful in this instance: the Mackay-Marg tonometer9,10 and the Pneumotonometer.11 The Mackay-Marg tonometer has a central piston with provision to sense force surrounded by a passive annulus (Fig. 5). This instrument is brought up to the cornea by hand and the force necessary to applanate the cornea to the diameter of the central piston is determined by an electronic display.12 In the Pneumatonometer, a plunger is also brought up to the cornea by hand but the actual force of application is supplied by compressed gas. A valving mechanism at the tip of the plunger determines the end point for the measurement; the gas pressure necessary to achieve the end point is sensed and displayed electronically.13 Laboratory and clinical studies have shown that the Pneumatonometer causes some degree of indentation.14,15
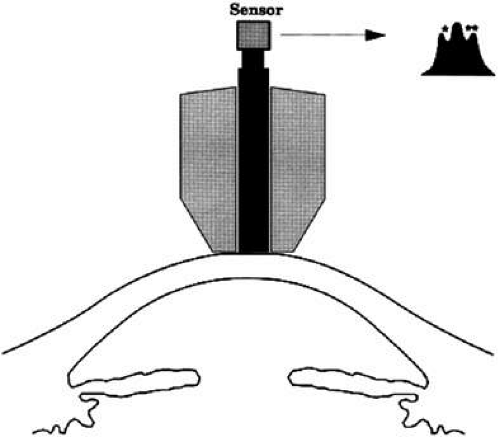 FIGURE 5. McKay-Marg applanation tonometry. In this method, the applanation force is sensed electronically through a sensor attached to the central cylinder (black). As the instrument is applied to the eye, force on the central cylinder increases (small graph) until the full area of the cylinder face is flattened against the cornea. Just beyond this point, some of the force is transferred to the surrounding inert portion of the instrument (gray), which produces a small dip in the force recording from the central cylinder (*). At this point, a fixed area has been applanated and the force required has been determined (marked by the dip in the recording). A second end point is similarly recorded (**) as the instrument is withdrawn from the eye. This test method has been rendered both convenient and portable in a small handheld unit—the Tonopen. One tonometry/manometry comparison study found an inadequate level of accuracy with this instrument, however. (From Eisenberg DL, Sherman BG, McKeown CA et al: Tonometry in adults and children. A manometric evaluation of pneumatonometry, applanation, and Tonopen in vitro and in vivo. Ophthalmol 105:1173, 1998 with permission.) |
Dynamic contour tonometry (DCT) is a method of measuring transcorneal and continuous IOP where the pressure-sensitive tip is not planar, but instead, closely resembles the curvature of the cornea. A pressure sensor is embedded in the shell-shaped tonometer tip (Fig. 6). Forcing the central disc area of the cornea into the contour DCT tip allows the examiner to measure the pressure of the eye directly on the external surface of the cornea because, in the condition of matched contours, the pressure on both sides of the cornea are theoretically equal. The IOP recorded by DCT is defined as the mean diastolic IOP during the period the tonometer was in contact with the eye.
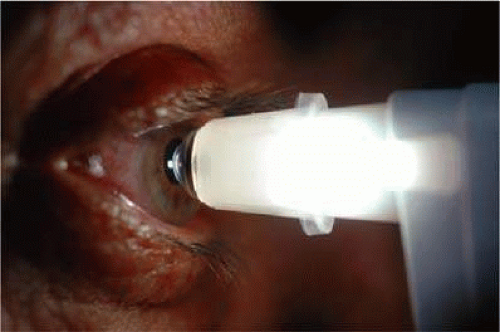 FIGURE 6. Demonstration of dynamic contour tonometry (DCT) measurement in a patient. The pressure sensitive tip closely resembles the curvature of the cornea. |
Investigation with the novel DCT on human cadaver eyes showed better absolute and relative accuracy than Goldmann and pneumatonometry.16,17 Instrument validation studies have shown that DCT is not significantly correlated with CCT.18,19 Kaufmann et al.20,21 and Siganos et al.22 reported that DCT seems to be less dependent on CCT than Goldmann tonometry or noncontact air-puff on normal eyes and on eyes after laser-assisted in situ keratomileusis, respectively.
The ocular response analyzer (ORA) determines corneal biomechanical properties using an applied force-displacement relationship. An air jet similar to that used in traditional air-puff tonometers generates force/pressure on the cornea (Fig. 7). To distinguish between corneal biomechanical properties and IOP, the ORA uses a method that eliminates the potential interference between the two factors in a single measurement. Pairs of measurements are used because a measurement of a single parameter cannot determine the independent corneal properties and IOP. This bidirectional applanation process provides a new measure of corneal biomechanics called corneal hysteresis. Recent articles have highlighted the clinical utility of the ORA and its various measurements.23,24,25
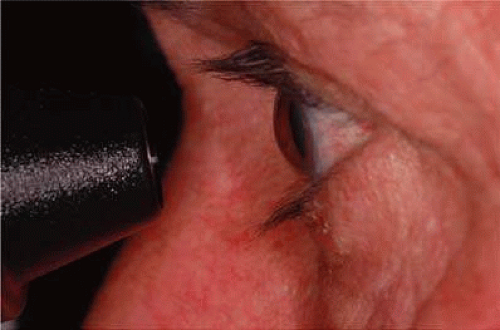 FIGURE 7. Demonstration of the ocular response analyzer (ORA) use in a patient. This unit determines corneal biomechanical properties using an applied force-displacement relationship. |
Normal Pressure
In the normal young adult population, the mean of IOP readings lies between 15 and 16 mmHg, with a distribution that is bell-shaped and symmetric (Fig. 8)26 With increasing age, most studies indicate a tendency toward increased IOP with skewing of the distribution toward higher pressures.27 Conversely, IOP in normal infants and children tends to run lower than that of the young adult population.28
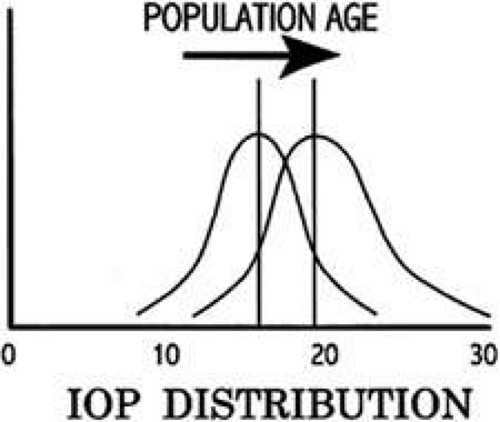 FIGURE 8. IOP and age. In the normal young adult population, the mean IOP is 15 to 16 mmHg and the distribution approximates a normal bell-shaped curve. In the aging normal population, the mean IOP is higher and the distribution is skewed to the right. This presumably reflects both a true trend to higher IOP with age and a certain proportion of new undiagnosed glaucoma cases in development. |
Circadian Variation in Intraocular Pressure
Intraocular pressure shows a natural cycle with a phase of relative elevation followed by a phase of relative depression occurring over a 24-hour period—a circadian rhythm.29 The mechanism for this variation almost certainly involves variations in aqueous humor production, although other factors contribute also. The magnitude of the variation is greater in glaucoma patients—in some studies, three or four times greater than in the normal population (Fig. 9). The larger pressure swing in glaucoma patients is logically related to poor outflow facility but because outflow facility and diurnal variation of IOP are not highly correlated, other factors also must play a role.
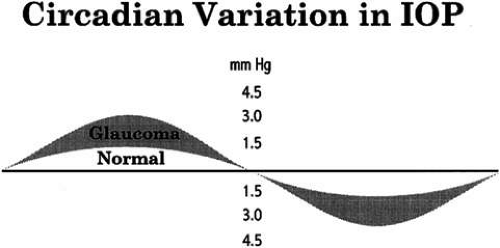 FIGURE 9. Variation of IOP. Like many physiologic parameters, IOP fluctuates on a daily cycle. The fluctuation in normal patients is low, but it is more pronounced in glaucoma patients. Study of this pattern in glaucoma patients has shown that peak pressures often occur outside normal office hours. |
The most common daily cycle shows a tendency for higher pressures in the morning hours and falling pressures in the evening. This pattern is not universal, however, because peak pressures occur at any time of the day. Careful studies of IOP using home tonometry30 to track patients’ normal daily patterns have shown that about 50% of peak pressures fall outside normal office hours.31 Twenty-four-hour IOP monitoring studies also show a high incidence of peak IOPs outside normal office hours.32,33 The practical consequences of circadian variation in IOP are several.
Stay updated, free articles. Join our Telegram channel

Full access? Get Clinical Tree


