Fig. 12.1
Fluorescein-dyed microspheres appearance in outflow after intraocular ultrasound in pig eye
The movement of the microspheres was gratifying with ultrasound, but it also became apparent that in order for the sonomechanical effect to be substantial, there had to be a simultaneous irrigation of fluid. In addition such a device had a substantial potential for cataract formation in the phakic eye. Furthermore, I was concerned about the sonomechanical mechanism of ultrasound which had the capacity to increase from “aqueous streaming” to significant “cavitation” effect and additional tissue destruction.
Attention was then directed to the thermal effect of ultrasound. The literature reporting on the thermal effects of ultrasound was primarily focused on orthopedic or oncologic processes and treatments [44–56, 61–64]. These areas of interest and work seemed to offer substantial possibilities, for very often the processes involved a triggering of cytokine activity by the thermal effects of ultrasound in the orthopedic literature. In the oncology literature there was a great deal of interest in the use of either local or whole-body hyperthermia to trigger beneficial inflammatory responses [60–62].
A further literature search revealed a paper by Schuman et al. [13]. that reported the finding of specific inflammatory cytokines in eyes after cataract surgery. This paper proposed that the decrease in IOP after cataract surgery might be due to these cytokine findings.
This paper along with the proposed mechanism of action of SLT [27, 35, 36] and the potential for localized hyperthermia by ultrasound might offer another means of triggering a beneficial cytokine cascade quite analogous to the laser but with a different energy source.
Further review of the literature was done. This time the specific purpose was to find the maximum temperature that could be attained without leading to cell death or pain. Various sources reported that cell death and/or pain began at 45 °C [63, 64]. I also reviewed the literature to find the temperature pattern where inflammatory cytokines were triggered. This temperature was approximately 42.5 °C. This seemed to indicate that there was a “sweet spot” of a range of a few degrees where the elevated temperature could trigger cytokines but not lead to cell death or pain (Fig. 12.2).
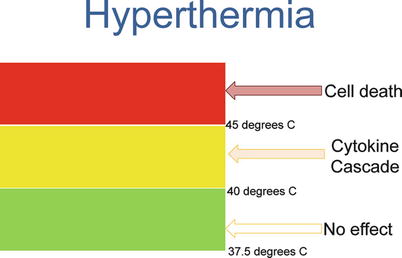
Fig. 12.2
Hyperthermia and cell cytokine cascade
If an ultrasound could be produced that could be used to create a localized, controlled limited hyperthermia, I needed to determine such a power and frequency. Because of the potential for damage in such a small temperature range and the close proximity of vulnerable tissue, I chose to work with a focused ultrasound. I was unsure of the power, but I knew that whatever the power was, it had to be able to produce a sustained temperature of 43 or so degrees centigrade.
AAO Las Vegas 2006
I met with an ultrasound designer/builder on the exhibit floor of the Academy meeting. I had no idea of the proper frequency (ultrasound starts at 20 KHz and extends into the millions). He suggested one million as the proper frequency for my needs. I had him build the device with the ability to vary the power so that I could determine how much was needed to attain the proper temperature. I told him that I needed the device to focus the power at a point 1 mm in front of the tip. He agreed and he started the project. I received the device. Excitedly I turned it on….I heard nothing…..I saw nothing ….I felt nothing. I called him; I was disappointed and told him. He told me to hook it up to my oscilloscope. I didn’t have a G.D… oscilloscope!!
I decided to return to what was obvious. If phacoemulsification had the capacity to produce the effect then that was the frequency that I could use. I went looking for a company that could produce an ultrasound with enough power, to be focused and be in the range of 50 KHz. I found such a company about 25 miles from my office. The engineer/owner was about 75 years old and was quite interested in my device. He told me he could build my device without charge, but he wanted first refusal to produce it. I agreed. He built two versions of slightly different frequencies.
I set up a laboratory through my hospital. I plugged in the device. I obtained pig eyes, made a small incision at the limbus, and inserted a micro-thermometer wire into the trabecular meshwork. I placed the tip of the handpiece against the limbus and aimed the tip at the position of the temperature wire. I was looking for a temperature rise of approximately 6 °C. I worked with these two devices, but I found that there was some variability in effect depending on the angle of application and the amount of pressure applied during the treatment. The owner of the ultrasound company came to the lab to offer assistance. He offered to take the handpieces back and rework them to improve the design. It was over a month of calls when he finally answered and returned my calls. He told me he was too old to see much value in pursuing what would probably be many years before a product would be marketed. He didn’t want to be part of such a long-time venture (Figs. 12.3 and 12.4).
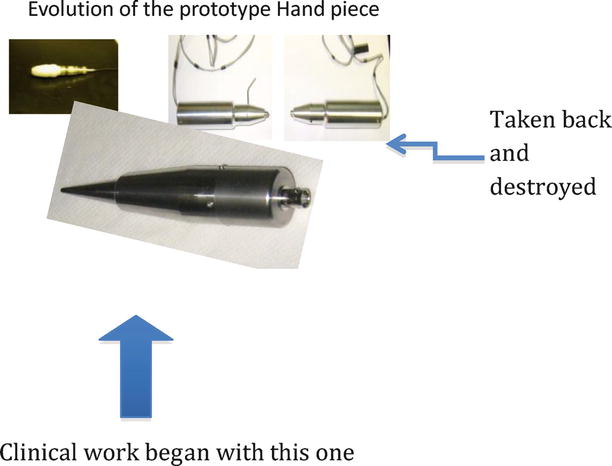
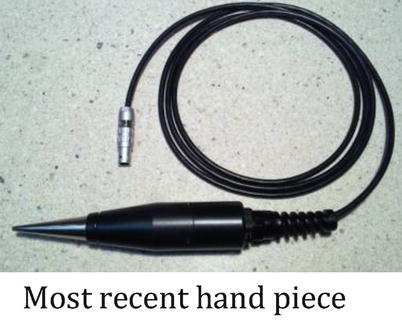
Fig. 12.3
Evolution of handpiece for ultrasound treatment
Fig. 12.4
Latest “TUG” handpiece
He destroyed the handpieces and used the parts in other devices he had sold. I tried to pay him to build more prototypes, but he never returned my calls or letters.
I went back to the search for another company to build the prototypes. I found one that could and would build them. I bought two, one of 40 KHz and one of 60 KHz. These prototypes had a function generator where I could vary the frequency to tune the handpiece, a power amplifier to get me to enough energy to deliver, and the handpieces that produced focused ultrasound into the meshwork. I set out to find the proper amount of power to raise the temperature by 6° (Fig. 12.5).
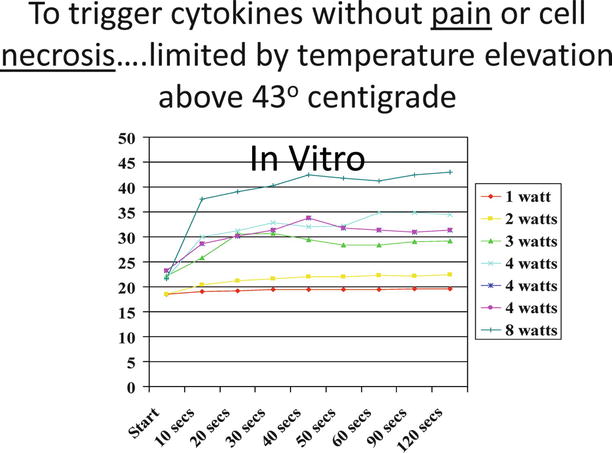
Fig. 12.5
Temperature increase with various power setting for early in vitro studies
The earliest in vitro testing was to determine the increase in temperature from the ambient room temperature. Once I found the right combination, I purchased a used water bath on eBay to warm up some pig eyes to basal temperature of 37.5 °C. I repeated the studies until I could find the correct power and frequency and application pressure to raise the temperature to 43° and maintain the temperature for 25 s. It typically took 20 s of application of the ultrasound to reach the temperature. On one of the testing days, I accidentally placed the power setting at about five times maximum and blew out the core of the 60 K handpiece. I continued all of my subsequent work with the 40 KHz handpiece (there was no difference in the findings of the two handpieces up until it blew out).
Once I determined the settings that worked in the in vitro model, I arranged for in vivo work on the porcine eye.
Porcine Study
Treatments were performed in eyes with matching controls at various powers around the power settings that worked on the in vitro work. Trained veterinary ophthalmologists performed a careful analysis of the eyes, which were sent on to the university for analysis. Unfortunately, there was no final report filed by the researcher, but in a meeting with the pathologist, it was reported that there was only minimal inflammation except in the case of the application of a power that was twice the expected treatment power. It was also shown that when the application of the tip of the device was directly on the cornea with that higher power setting, there was evidence of a corneal burn. From that point forward the application of the tip has been always with a clear space between the cornea and the tip.
Results
…Gross ocular observations are presented in Table 12.2. On Day 1, animals in Group A and B displayed no signs of ocular irritation or discomfort in either eye. The animal in Group C (No.66 exhibited mild conjunctival redness in both eyes on Day 2. The animal in Group d (No67) exhibited moderate conjunctival redness and discharge and mild chemosis in both eyes on Day 2….
Rabbit Study
The study was then performed on the rabbit model with concentration on the power setting much more closely in line with that expected to be used for treatment. I was anxious to refine the treatment parameters, and I felt that using the rabbit (reputed to be much more sensitive to inflammatory stimuli), the findings would be more valuable. These studies revealed a mild inflammatory response in the external examination. The globes were then fixed and transported to an independent laboratory that sectioned and analyzed the tissue.
Results
….All right eye sections had a lesion diagnosed as chronic-active inflammation, limbus (graded minimal to mild). The lesion was characterized by an infiltrate of mononuclear cells and polymorphonuclear cells near the limbus. The infiltrate was usually just under the conjunctiva (subconjunctival connective tissue) and extended towards or into the canal of Schlemm.” “…….There were no changes observed in the cornea, sclera or ciliary body…..
TUG.1
The next step was human clinical work. For such work I needed an oversight of an appropriate institutional review board; I began with the two institutions where I am affiliated, University of Southern California and University of California at Irvine. Because I am on the voluntary faculty, I could not be in charge of such research at either place. In addition I had some concerns that the intellectual property rights that I had paid so dearly for might be in some way transferred to the institutions. I decided to go with an independent, nonaffiliated board. This was actually an excellent decision, for the board meets very frequently, has many such projects, and can make decisions on almost a daily basis rather than waiting for a month between such committees in a university setting.
After reviewing my application to treat human eyes and the work that was done, the institutional review board (IRB) agreed that my device was an nonsignificant risk device. This finding meant that I did not have to have the full IDE review by the FDA for the study intended. The first treatments were performed on patients with blind eyes to simply determine the tolerability of the treatment. These treatments would be done with appropriate and necessary informed consent and with no expectation of any help with vision. I scoured my patient population in my practice and found very few who would meet the qualifications. I approached the local Braille Institute to find any potential subjects. I offered to pay money and transportation for the treatments. I found a total of 13 subjects who wished to be part of such a study.
The procedure up until it was first used had a cumbersome description and no name. I knew that in referring to the procedure that such procedures typically had a three-letter acronym to make it easier to recall. I played with the three words that were important, therapeutic, ultrasound, and glaucoma in various permutations, and felt that the procedure would best be called “TUG” for therapeutic ultrasound for glaucoma. It offered an easily remembered name, it had the three important words included and additionally it gave an impression of being a gentle method of treatment.
This study, TUG.1, was purely a tolerability study to determine if such a treatment and protocol was comfortable. The evaluations were performed pretreatment and posttreatment with symptoms of discomfort or pain reported to my clinical coordinator. In addition a slit-lamp examination was performed with evaluation of conjunctival hyperemia and anterior segment flare and cells.
On March 9, 2009, I treated the first patient with the device. He had been in Nicaragua and in 1986 had a bomb blow up in his face leaving him with no usable vision in his eye (Fig. 12.6).
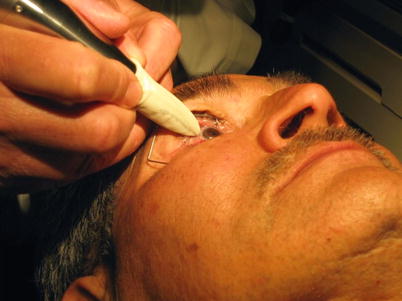
Fig. 12.6
First human treatment with TUG device
He was excited about what I was doing, knew that there was no expectation of vision for the eye to be treated, and took it as a special badge of honor to be the very first person in the world to have ever been treated with the device. Coincidentally that date in 2009 was World Glaucoma Day.
A number of subjects were transported from the Braille Institute, and those of my own practice constituted the subjects for this first study. The procedure was tolerated easily with only mild irritation reported by the subject for the first day. These subjects were seen 2–3 h after treatment to check for any pressure spike, 1 day, 1 week, and monthly for 6 months. If there were more than mild irritation and more than mild conjunctival injection noted at slit lamp at the first day, the subject was given a topical nonsteroidal to use for a couple of days.
The TUG.1 study revealed an easily tolerated procedure with very little subjective discomfort and only mild inflammatory reaction noted at slit lamp the first day. Although the IOP was not part of this initial study protocol, it was followed and did reveal a gratifying decrease.
Some of the nuances of the actual treatment protocol had to be addressed. How many treatment spots, how many seconds at each spot, how much pressure to exert against the eye, exactly how far from the limbus, how to tell how much pressure was being exerted, and what angle should the device be held against the eye? What if there was a scar that prevented treatment in a specific location? In addition there was the continuing difficulty of tuning the whole treatment apparatus.
Each time the device was used it had to be tuned. The tuning process involved setting the frequency to match the handpiece frequency that worked the best. Although the piezoelectric crystals were set for 40 KHz, it seemed to work best at 40.33 KHz once it was warmed up (Fig. 12.7).
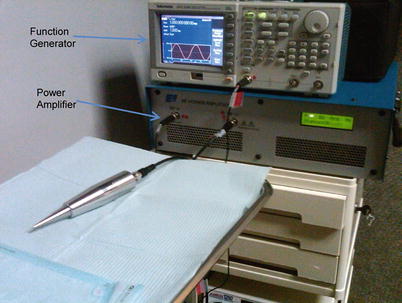
Fig. 12.7
TUG apparatus used for early clinical studies
Therefore, the function generator was set in the general range of 40 K and then dialed around the 40.33 K much like tuning a radio to be the best reception. And like a radio, there was frequently a slight drift that occurred. Constant monitoring of the frequency was required. The function generator therefore created a source for the power amplifier. This proper frequency with a small voltage was then fed into the power amplifier. This voltage output of the function generator needed to be tuned to the proper mVolt usually in the range of 100–115 mV. The amplifier allowed the power to be stepped up to a point where the handpiece was functional. On the power amplifier was a window that allowed monitoring of the power sent to the handpiece. This window showed two numbers: the first number was the power sent to the handpiece and the second was the “reflectance” back to the power amplifier. If they were equal, such as “3” and “3,” that meant that there was no real power being used, and it was all reflected back to the amplifier. The best situation was that of the first number being “3” or more and the second “0,” ensuring that all of the power was being used by the handpiece and none reflected back. My assistant monitored these numbers as the treatments were performed. One difficulty with this “reflectance” window was that it was a digital readout and simply jumped from “3” to “4”; there was no “3.2” or “3.9.” It was only whole integers in the readout, so I had to extrapolate. As I increased the function generator power knob, I could see the power window number jump to the next integer. I was able to determine the range within the “3” before it jumped to “4” and thereby found the function generator setting that would create approximately 3.5–3.75 W. Again my assistant would keep track of any variation caused by drift as the treatment was progressing. The tuning could take up to 45 min before the device was functional. The power amplifier had a moderately loud fan and loud humming sound, and it would gradually heat up the room, many times to an uncomfortable level.
Method of Treatment
Video (Video 12.1)
The subject was examined at slit lamp immediately before the treatment. A drop of tetracaine was placed in the eye to be treated. Then the subject was tilted back in the examination chair. A lid speculum was placed in the eye and the conjunctiva was marked with a marking pen. (The marking originally was to demarcate the 12 equally spaced treatment locations with 12 marks. In reality this simply became confusing. The eye is now marked with 4 lines demarcating 4 quadrants, and 3 treatments are performed within each treatment quadrant). An additional 4 % xylocaine gel was then used to over the limbal area and the cornea. This gel provides three functions. It adds additional anesthesia, it provides the contact gel for the ultrasound transmission, and it keeps the cornea moist throughout the procedure. The subject would be able to move his/her eye to expose the treatment location. I would be seated at the 12:00 position and begin treatment at the 1:00 position. The frequency, mV readings, and power amplifier readings were noted and followed by my assistant at each application of the handpiece to the eye. The “angle of attack” of the handpiece was 45° to the globe with the tip aimed deep to the center of the crystalline lens. This angle was chosen to place the focal point of the ultrasound within the trabecular meshwork. The tip is placed on the globe at the limbus with a small clear space from the cornea on the scleral side allowing approximately 0.5 mm from the cornea. The handpiece is then held firmly against the globe for the full 45 s. A timer with a countdown is used for this with the assistant counting off 10 s intervals. The amount of pressure against the globe is such that it is just enough to distort the corneal arc to become flat at the location of the application of the tip. This amount of pressure does not cause pain, and it is also enough to allow the globe to become mildly fixed to the tip as the seconds count off so that there is constant treatment. Occasionally the subject will report some discomfort. Moving the tip slightly toward one side or another from the location easily stops this. Less than 1 mm will move the tip away from any point of pain (positioning of the tip directly over the nerves is felt to be the cause of this discomfort). The subject will typically feel some warmth and a mild tingling during the course of the treatment.
TUG.2
Once the TUG.1 series was followed over the 6 months without significant side effects and seen to be well tolerated, the IRB was approached again. This time a protocol was designed to evaluate the treatment on sighted eyes with glaucoma. These subjects were typically on medical treatment. Only one of the subjects’ eyes was treated. The eye to be treated was randomized by coin flip. The non-treated eye continued on medication, whereas the treated eye had a washout by protocol before treatment (where the patient had an eye with previous pressures above 40 mmHg there was no washout). This series was of ten subjects. It was designed to verify the best treatment parameters and techniques to lead to a decrease in IOP. Those parameters were listed above in the Method of Treatment, but were refined within the TUG.2 group. This study was aimed at small changes in the number of seconds of application, the amount of pressure exerted against the globe, and trying to determine within the “integer” window of the power amplifier how to extrapolate to the very best power in W/cm2.
The treatment was done as per the method above with some specific variables to be analyzed as to affect. The subjects were seen 2 h after the treatment for a pressure check to determine any spike. Then they were seen at 1 day, 1 week, 1 month, and then monthly for 6 months.
Subjective findings of discomfort and pain were noted by assistants on a scale of 1–4 with 4 being the worst. Objective findings of conjunctival injection, anterior chamber flare, and anterior chamber cell were noted by the physician (DS).
The measurement of the intraocular pressure was paramount during these early studies and always followed the same method. Before the physician came into the room, a tonopen was used to make five separate measurements of each eye. Then the Goldmann applanation tonometer (calibrated each week) was then used by the assistant. At this time the physician examined the patient and did his own Goldmann pressures. The tonopen measurements were then averaged and then this was averaged with the average of the two Goldmann measurements. It was felt in this manner that bias in measurements was mitigated as much as possible, with the single measurement by the investigator counting only one third against the two thirds of the digital tonopen and the assistant.
Stay updated, free articles. Join our Telegram channel

Full access? Get Clinical Tree


