Purpose
To investigate the autofluorescence patterns of sealed macular holes and determine the correlations of the postoperative changes in spectral-domain optical coherence tomography and fundus autofluorescence (FAF) with the best-corrected visual acuity (BCVA) of patients with sealed idiopathic macular holes.
Design
Retrospective consecutive observational case series.
Methods
Seventy-seven eyes from 75 consecutive patients who had undergone successful vitrectomies for idiopathic macular holes by a single surgeon with postoperative follow-ups for over 1 year were included. FAF imaging studies were performed 1 month and 6 months post surgery, and optical coherence tomography (OCT) was performed at regular intervals after surgery. The main outcome measures were macular hole size, FAF patterns, retina outer segment from OCT, and BCVA before and after operation.
Results
The patients who had intact external limiting membranes (ELMs) at 1 month after surgery had better BCVAs than those without ( P < .001), regardless of the photoreceptor inner segment/outer segment (IS/OS) condition. The FAF patterns were divided into 3 groups: homogenous hyperfluorescence, patchy hyperfluorescence, and normal hypofluorescence. No significant BCVA differences were noted ( P = .28) among the 3 groups. However, significantly better BCVAs were noted in the patients who had both intact ELMs and normal hypofluorescence patterns ( P = .011).
Conclusions
In sealed macular holes, intact ELMs predicted good postoperative BCVA. In this subgroup, a hypofluorescence pattern on the FAF imaging predicted the best postoperative BCVA.
Pars plana vitrectomy with internal limiting membrane (ILM) peeling is the standard treatment for an idiopathic macular hole (MH). Such factors as preoperative macular hole size and duration of symptoms were predictive to anatomic success postoperatively. Although a hole closure rate of 90% or greater can be achieved, visual function can vary after successful surgery. Clinical tools such as optical coherence tomography (OCT), fundus autofluorescence (FAF), and microperimetry have been used to correlate the examination results with the postoperative best-corrected visual acuity (BCVA) to better predict the eventual visual function. Many studies have shown that disruption of the photoreceptor inner segment/outer segment (IS/OS) junction in the fovea on OCT images correlated with the final BCVA. One recent study further showed that an intact external limiting membrane (ELM) strongly correlated with the BCVA postoperatively at 3 months. However, even in the group with intact ELMs, the BCVA range remained considerable (0.15-1.5 according to the Landolt C visual acuity chart), which suggests that other factors or structural changes might help to determine the final vision level.
FAF has recently been used to evaluate the postoperative macula. Various autofluorescence patterns can be observed in sealed macular holes. However, previous studies have failed to show a direct association between visual acuity and FAF patterns. We hypothesized that a normal hypofluorescence pattern would indicate an intact inner retina, with normal distribution of xanthophyll pigment to block the autofluorescence from the retinal pigment epithelium (RPE). The normal FAF pattern, along with an intact ELM, should best predict good visual acuity after surgery for idiopathic macular holes. In this study, we investigated the changes on OCT images and FAF patterns after the successful repair of idiopathic macular holes. We intended to determine whether combining the OCT and the FAF imaging results would better predict good postoperative visual acuity.
Subjects and Methods
This study was approved by the Institutional Review Board at the National Taiwan University Hospital. The study was a retrospective case series that included 77 eyes from 75 consecutive patients who had idiopathic MHs sealed after vitrectomies that were performed from 2007 to 2011; these surgeries were performed by a single surgeon at National Taiwan University Hospital. The hole closures were confirmed using both biomicroscopy and OCT. The MHs that were caused by trauma, high myopia, diabetes, or other ocular diseases were excluded from this study. The postoperative follow-up lasted over 12 months in all cases. During this period, no patients dropped out after surgery for macular hole. Each patient’s medical records, including age, sex, past ocular history, past medical history, presenting complaint, and BCVA of Snellen acuities were reviewed. Each patient received a complete ocular examination, which included the BCVA, an intraocular pressure measurement, an anterior segment examination, a dilated biomicroscopic examination of the macula, fundus photography, spectral-domain OCT focusing on the macular area, and preoperative and postoperative FAFs. All of the patients were regularly followed up after surgery at 1 week, 2 weeks, 4 weeks, and 2 months and then every 3 to 4 months.
OCT was performed using the Cirrus high-definition OCT (HD-OCT) (OCT3; Carl Zeiss Meditec Inc, Dublin, California, USA) for retinal tomography mapping and analysis under pupillary dilation by an experienced examiner. Macular hole size was determined by OCT in the retinal thickness analysis mode. The shortest distance across the full-thickness defect of the macular hole was measured and defined as the size of the hole, as in previous studies. The integrity of the photoreceptor IS/OS junction and ELM were particularly evaluated. All of the patients received OCT examinations 1 month, 3 months, 6 months, and 1 year after their surgeries.
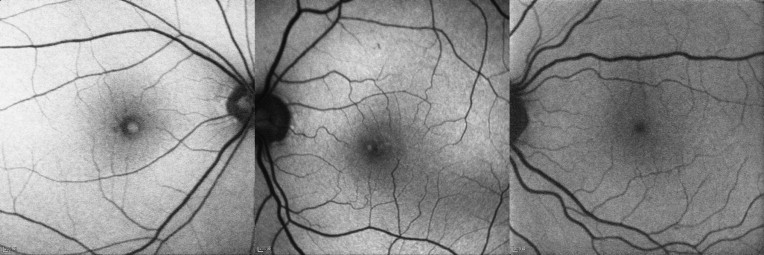
FAF imaging was performed using a confocal scanning laser ophthalmoscope, with both the exciter illumination and barrier filters in place (Heidelberg Retina Angiograph II [HRA2]; Heidelberg Engineering, Heidelberg, Germany). The excitation light was used at 488 nm, and the emission light was used at 500 nm with a barrier filter. Rectangular 30 × 30-degree field-of-view FAF images were obtained after pupil dilation. In each case, FAF was performed before surgery and 1 month and 6 months after surgery. The FAF patterns were classified independently by 2 different image readers who were both retinal specialists. A third retinal specialist was consulted if there was a classification discrepancy. The Cohen kappa coefficient was 0.96 for the 2 image readers. Homogenous hyperfluorescence was defined as a homogenous bright signal in the central macular area, patchy hyperfluorescence was defined as 1 or more hyperfluorescent patches surrounded by a hypofluorescence signal in the central macula, and normal hypofluorescence referred to a homogenous dark signal in the central macular area ( Figure 1 ).
Surgical Techniques
Each patient had undergone a 23-gauge vitrectomy. After core vitrectomy and triamcinolone acetonide–assisted (TA, 10 mg/mL) posterior hyaloid removal, a small amount of VisCoat (Alcon-Couvreur NV, Rijksweg, Puurs, Belgium) was placed in the hole to prevent the indocyanine green (ICG) from contacting the RPE later in the procedure. ICG (25 mg ICG diluted with 15 mL 5% glucose water to yield a concentration of 1.7 mg/mL) was then carefully applied around the VisCoat-coated area within the arcade. Excessive ICG was immediately removed by suction. The VisCoat was aspirated from the hole after good ILM staining. Because the 2 substances used in our technique (VisCoat and 5% glucose water–diluted ICG solution) were both slightly greater in density than the balanced saline solution, they slowly descended rather than floating up into the vitreous cavity; this quality allowed for more controlled applications of these substances to the designated areas. Either a barbed 25-gauge needle or direct forceps grasping was then used to create an ILM break within the ICG-stained area. ILM peeling 3 to 4 disc diameter centering on the fovea was performed in a circular manner across the macula. The peripheral retina was then examined for possible breaks, followed by air-fluid exchange and 15% C 3 F 8 infusion into the vitreous cavity. The patients were kept in a prone position for approximately 1 week.
Statistical Analysis
We analyzed the relationship between the different patterns using either FAF or OCT and BCVA. The data analysis was performed using SPSS version18.0 (SPSS Inc, Chicago, Illinois, USA). The BCVA was measured with a Snellen visual chart. The Snellen visual acuity was converted into logarithm of the minimal angle of resolution (logMAR) for statistical analysis. The continuous variables are presented as the means ± standard deviations. The Mann-Whitney U test was performed for 2-group comparisons. The Kruskal-Wallis test, followed by the Mann-Whitney U test and Bonferroni correction method, were performed to compare the 3 groups. A P value <.05 was considered statistically significant. To evaluate the independent factors used for BCVA prediction 1 year after vitrectomy, stepwise multiple regression analyses were performed taking the preoperative logMAR visual acuity, the size of macular hole, photoreceptor IS/OS junction status, ELM integrity, and FAF pattern as variables.
Results
The participants included 22 men and 53 women, with an average age of 57.8 ± 9.3 years (range: 40-73 years). Seventy-seven eyes were enrolled, with 12 eyes having stage 2 macular holes, 31 eyes stage 3 macular holes, and 34 eyes stage 4 macular holes. The macular hole size ranged from 150 to 780 μm (396.8 ± 168.2). Seventy eyes (90.9%) were in the pseudophakic state at the end of follow-up. Seven eyes had retained crystalline lens with minimal cataract, and these cases were with good postoperative final vision. The mean logMAR visual acuity improved significantly from 1.14 ± 0.43 (Snellen acuity ranged from 20/800 to 20/70) preoperatively to 0.36 ± 0.35 (Snellen acuity ranged from 20/100 to 20/15) 1 year after surgery ( P < .001).
Two OCT parameters obtained 1 month after surgery were used to evaluate the effect of structural changes on visual prognosis: the integrity of photoreceptor IS/OS junction and of the ELM. When considering the conditions of the photoreceptor IS/OS junction and the ELM together 1 month after surgery, the eyes could be divided into 3 groups: (1) defects in both the photoreceptor IS/OS junction and the ELM (Group 1, 40 eyes), (2) an intact ELM with a defective photoreceptor IS/OS junction (Group 2, 32 eyes), and (3) an intact photoreceptor IS/OS junction and ELM (Group 3, 5 eyes) ( Figure 2 ). No eyes with a defective ELM but intact IS/OS junction were noted. The preoperative logMAR visual acuity showed no statistically significant differences among the 3 groups (1.23 ± 0.44, 1.07 ± 0.42, and 0.88 ± 0.16 in Group 1, Group 2, and Group 3, respectively, P = .469). The postoperative logMAR visual acuity showed significant differences among the 3 groups ( P = .043) ( Figure 2 ). The postoperative logMAR visual acuity in each group was 0.58 ± 0.36 (Group 1), 0.14 ± 0.12 (Group 2), and 0.03 ± 0.04 (Group 3). The eyes with intact ELMs (Group 2 and Group 3) had better postoperative BCVAs.
The restoration of the photoreceptor IS/OS junction and the ELM in the 1-year follow-up were studied. The proportion of eyes with both intact photoreceptor IS/OS junctions and ELMs in total study eyes (77 eyes) at 1 month, 3 months, 6 months, and 1 year after surgery was 6.5% (5 eyes), 9.1% (7 eyes), 11.7% (9 eyes), and 22.1% (17 eyes), respectively. Decreases in the defective areas were also noted in patients with defective photoreceptor IS/OS junctions and ELMs at 12 months postoperatively.
The FAF results before surgery showed uniformly intense hyperfluorescence in every case. The FAF results 1 month after surgery were divided into 3 groups: (1) homogenous hyperfluorescence (10 eyes), (2) patchy hyperfluorescence (38 eyes), and (3) normal hypofluorescence (29 eyes) ( Figure 1 ). The postoperative logMAR visual acuity in each group was 0.47 ± 0.33 (homogenous hyperfluorescence), 0.37 ± 0.38 (patchy hyperfluorescence), and 0.31 ± 0.33 (normal hypofluorescence) ( Table 1 ). There were no significant differences in the BCVA among the 3 groups ( P = .28). No obvious pattern changes on the serial images could be detected during the follow-up in any patient ( Figures 3 and 4 ).
| Homogenous Hyperfluorescence | Patchy Hyperfluorescence | Hypofluorescence | |
|---|---|---|---|
| Eyes (subjects) | 10 (10) | 38 (38) | 29 (29) |
| logMAR BCVA (mean ± SD) a | 0.47 ± 0.33 | 0.37 ± 0.38 | 0.31 ± 0.33 |
a There were no significant differences among the 3 groups in the postoperative logMAR BCVA ( P = .28).
The patients with intact ELMs (37 eyes) were divided into 3 subgroups according to the FAF images. Six eyes had homogenous hyperfluorescence, 19 eyes had patchy hyperfluorescence, and 12 eyes had normal hypofluorescence. The postoperative logMAR visual acuity in each group was 0.23 ± 0.11 (homogenous hyperfluorescence), 0.13 ± 0.13 (patchy hyperfluorescence), and 0.05 ± 0.08 (normal hypofluorescence). There was a significant difference between the normal hypofluorescence group and the homogenous hyperfluorescence group ( P = .002). A borderline significant difference was noted between the patchy hyperfluorescence group and the normal hypofluorescence group ( P = .05) ( Table 2 ).


