Purpose
To evaluate the correlation between changes in fundus autofluorescence (AF) measured using 2 different sources (near-infrared fundus autofluorescence from melanin and short-wavelength fundus autofluorescence from lipofuscin) with changes in spectral-domain optical coherence tomography (SD OCT) and fluorescein angiography in resolved central serous chorioretinopathy (CSC).
Design
Retrospective, observational case study.
Methods
A total of 91 eyes from 86 patients with a history of resolved CSC and abnormal AF imaging findings were included. In addition to AF, patients were assessed by means of SD OCT and fluorescein angiography. Outer retinal layer alterations in OCT images and abnormalities in fluorescein angiography were analyzed and correlated with the corresponding AF data.
Results
All eyes with abnormal near-infrared AF showed a hyperfluorescent angiography window defect in the corresponding area. There was a significant association between the OCT and short-wavelength AF findings. An abnormal short-wavelength AF signal was significantly associated with loss of the ellipsoid portion of the inner segments (EPIS, previously known as the junction between the inner and outer segments of the photoreceptors) on SD OCT (χ 2 test; P < .0001). Near-infrared AF could not predict the status of EPIS without the short-wavelength AF image.
Conclusions
Outer retinal layer changes in OCT images can be predicted by analyzing both short-wavelength AF and near-infrared AF images. Abnormal changes in the short-wavelength AF image were predictive of EPIS damage.
Central serous chorioretinopathy (CSC) mainly affects relatively young men and causes metamorphopsia, micropsia, decreased visual acuity, and central scotoma resulting from serous retinal detachment or pigment epithelial detachment. In most cases, CSC resolves spontaneously in 3-6 months, but there may be alterations in photoreceptors and the retinal pigment epithelium (RPE). Although many pathophysiologies of CSC have been proposed, including abnormalities of the choroidal vasculature and RPE, these have not yet been confirmed.
Although serous detachment can resolve completely, visual acuity may not improve to the value prior to the episode because of photoreceptor and RPE damage. To detect structural changes of the outer retinal layers related to CSC, optical coherence tomography (OCT) or fluorescein angiography can be performed. Fundus autofluorescence (AF) images can now also be obtained easily, and the role of AF in various macular diseases has been studied extensively. Several studies have shown that AF images provide information about the condition of the retina in CSC. However, these studies were not able to determine permanent sequelae of the disease because they reviewed AF images of eyes with unresolved CSC. In the acute stage of CSC, the AF signal is affected by various factors, such as serous retinal detachment, pigment epithelial detachment, and the presence of fibrin material. Therefore, it is very difficult to correctly predict retinal alterations before complete resolution of the disease. In the present study, to exclude confounding factors, we reviewed images obtained from eyes with resolved CSC. In our previous report, we evaluated the correlation among different tests in resolved CSC. We compared and correlated short-wavelength AF and near-infrared AF gray values with visual acuity and microperimetry. Short-wavelength AF and near-infrared AF images obtained with a confocal scanning laser ophthalmoscope are thought to originate from lipofuscin and melanin, respectively. Visual function did not correlate well with near-infrared AF gray value parameters but was moderately correlated with short-wavelength AF gray value parameters.
Our purpose in the present study was to compare abnormal AF images with spectral-domain OCT (SD OCT) and fluorescein angiography results to investigate the efficacy of short-wavelength AF and near-infrared AF at predicting outer retinal structural changes in resolved CSC, and to investigate the reasons why short-wavelength AF and near-infrared AF have different correlations with visual function.
Methods
Approval for this study was obtained from the Korea University Medical Center Institutional Review Board, Seoul, South Korea. All research protocols and data collection complied with the Declaration of Helsinki.
Case Selection
A retrospective chart review was performed of consecutive patients with resolved CSC at Korea University Ansan Hospital between March 1, 2009 and September 30, 2012. Each patient had a documented episode of CSC diagnosed by fluorescein angiography. CSC resolution was confirmed with SD OCT. Eyes were included if at least 4 months had elapsed since confirmation of CSC resolution by SD OCT and either short-wavelength AF or near-infrared AF image findings were abnormal. If the exact disease onset was unknown, symptom onset was used instead. When AF images were examined, SD OCT and fluorescein angiography were performed again to verify complete attachment of the retina and no fluorescein leakage. Eyes with other intraocular diseases (ie, age-related macular degeneration, polypoidal choroidal vasculopathy, epiretinal membrane, and diabetic retinopathy) or those with a history of ocular surgery were excluded. Eyes with a history of cataract surgery were not excluded.
Fundus Autofluorescence and Fluorescein Angiography
AF and fluorescein angiography images were taken using a confocal scanning laser ophthalmoscope (SLO) (Heidelberg Retina Angiograph 2 [HRA]; Heidelberg Engineering, Heidelberg, Germany) with a 30-degree field of view. The image resolution was 768 × 768 pixels. Short-wavelength AF and near-infrared AF images were obtained simultaneously. For short-wavelength AF imaging, a wavelength of 488 nm was used for excitation, and emitted light was detected above 500 nm with a barrier filter. Near-infrared AF images of ocular fundi were obtained at an excitation wavelength of 787 nm using a barrier filter for the detection of emitted light above 810 nm. For both short-wavelength AF and near-infrared AF, up to 100 single images were averaged (4.7 frames/s) depending on patient fixation using the HRA mean algebraic reconstruction technique algorithm to obtain a high-quality mean image. Fluorescein angiography images were selected around 40 seconds after dye injection.
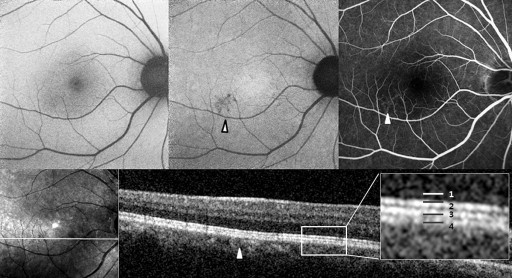
Abnormal AF lesions were categorized as either dot-like or confluent according to their configuration. Confluent autofluorescence was defined as a geographic area of increased or decreased autofluorescence, and dot-like autofluorescence as a granular, coarse lesion. The AF composite inside the lesion was classified as hyper-, hypo-, or mixed-AF type ( Figures 1-4 ). Mixed-type was defined as an abnormality with the coexistence of hyper- and hypo-AF. Lesions were qualitatively classified as hyper-, hypo-, or mixed-AF type lesions.
Optical Coherence Tomography
SD OCT was performed using the Spectral OCT/SLO system (OPKO/OTI, Miami, Florida, USA). All SD OCT images included line scans (horizontal and vertical B-scans), raster scans, and topographic mapping. Line scans were performed horizontally and vertically and the scan image was created by averaging up to 20 B-scans (1024 A-scans per B-scan) of 9 mm in length. The raster scan was performed using 32 B-scans (1024 A-scans per B-scan) of a 9 × 9-mm area. Topographic mapping consisted of 256 horizontal A-scans × 256 vertical lines across a 5 × 5-mm area. The line scans, raster scans, and topographic mapping were performed on each eye.
To compare the abnormal AF lesion with the OCT scan, the OCT raster scan image located on the middle area of the AF lesion was selected. If there was no proper OCT scan line corresponding to the middle location because of the width limitation of the raster scan, we selected the most abnormal-looking cut image within the lesion. In the OCT image, we focused on abnormalities in the outer retina. Reflective line integrities of the ellipsoid portion of the inner segments (EPIS, previously known as the junction between the inner and outer segments of the photoreceptors) on the OCT scan were assessed qualitatively. We assigned eyes with a defective EPIS signal to the EPIS damaged group.
To compare visual acuity according to EPIS and AF abnormalities, we also took the fovea center thickness into consideration. To measure fovea center thickness, central retinal thickness was assessed at the macular center (1 mm diameter) using topographic mapping. The central retinal thickness was generated automatically during OCT analysis.
Image Analysis
Patients were grouped according to the results of near-infrared AF, short-wavelength AF, SD OCT, and fluorescein angiography. In each group, we compared the abnormality patterns on short-wavelength AF and near-infrared AF with the retinal changes on SD OCT and fluorescein angiography.
Statistics
An independent t test or a Mann-Whitney test was performed to compare visual acuity and central retinal thickness between subgroups. Comparison of AF characteristics (configuration and AF composite) among subgroups and the relationship between AF and OCT changes were assessed by means of χ 2 tests. All statistical procedures were performed using SPSS version 17.0 (SPSS Inc, Chicago, Illinois, USA). A P value < .05 was considered statistically significant.
Results
Ninety-one eyes of 86 patients were analyzed. The average patient age was 41.55 ± 4.97 years, and the male-to-female ratio was 73 (84.9%) to 13 (15.1%). The mean logMAR best-corrected visual acuity was 0.25 ± 0.39. Eyes were categorized into 3 different groups according to the results of near-infrared AF, short-wavelength AF, SD OCT, and fluorescein angiography ( Table 1 ).
| Group | Abnormal Near-infrared AF | Abnormal Short-wavelength AF | OCT EPIS Damage | Fluorescein Angiography Window Defect | N |
|---|---|---|---|---|---|
| 1 | + | – | – | + | 38 |
| 2 | + | + | – | + | 20 |
| 3 | + | + | + | + | 33 |
| Total | 91 |
Eyes with abnormalities on either near-infrared AF or short-wavelength AF were included. Near-infrared AF abnormalities were noticed in all eyes, and 53 of 91 eyes (58.2%) had abnormalities on both near-infrared AF and short-wavelength AF images. Thirty-three of 91 eyes (36.3%) had a defect in the EPIS, and all these patients were included in the near-infrared AF and short-wavelength AF abnormal group.
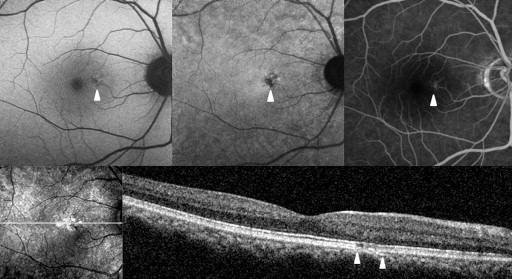
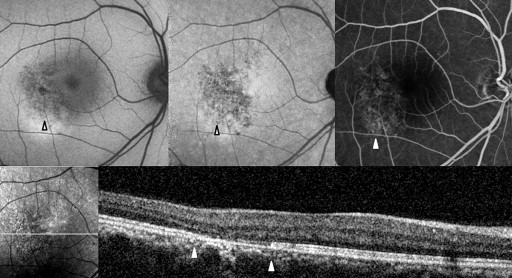
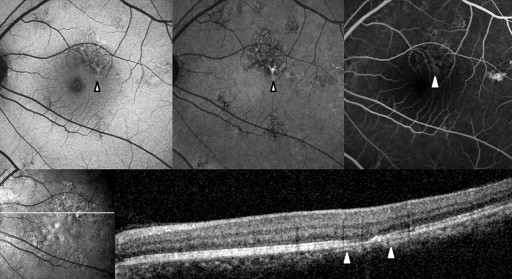
Table 2 shows the near-infrared AF characteristics of lesions and composites. In Groups 2 and 3, comprising eyes with abnormalities on both near-infrared AF and short-wavelength AF, the lesion configuration (dot-like or confluent) and the lesion composite (hypo-, hyper-, or mixed-AF type) were consistent between the near-infrared and short-wavelength AF images ( Figures 2-4 ).
| Group 1 n (%) | Group 2 n (%) | Group 3 n (%) | P Value a | |
|---|---|---|---|---|
| AF lesion configuration | ||||
| Dot-like | 25 (65.8%) | 15 (75.0%) | 9 (27.3%) | .001 |
| Confluent | 13 (34.2%) | 5 (25.0%) | 24 (72.7%) | |
| Total | 38 | 20 | 33 | |
| AF lesion composite | ||||
| Hypo | 36 (94.7%) | 17 (85.0%) | 19 (57.6%) | <.001 |
| Hyper or mixed | 2 (5.3%) | 3 (15.0%) | 14 (42.4%) | |
| Total | 38 | 20 | 33 | |
Stay updated, free articles. Join our Telegram channel

Full access? Get Clinical Tree


