This chapter reviews the fundamental corneal properties relevant to refractive surgery (focusing on keratorefractive procedures), corneal imaging for refractive surgery, and the effects of keratorefractive surgery on the cornea. It includes review of the optical principles discussed in BCSC Section 3, Clinical Optics; refractive errors (both lower- and higher-order aberrations); corneal biomechanics; corneal topography and tomography; wavefront analysis; laser biophysics and laser–tissue interactions; corneal biomechanical changes after surgery; and corneal wound healing.
Corneal Optics
The air–tear-film interface provides the majority of the optical power of the eye. Although a normal tear film has minimal deleterious effect, an abnormal tear film can have a dramatic impact on vision. For example, either excess tear film (eg, epiphora) or altered tear film (eg, dry eye or blepharitis) can decrease visual quality.
The optical power of the eye derives primarily from the anterior corneal curvature, which produces about two-thirds of the eye’s refractive power, approximately +48.00 diopters (D). The overall corneal power is less (approximately +42.00 D) as a result of the negative power (approximately –6.00 D) of the posterior corneal surface. Standard keratometers and Placido-based corneal topography instruments measure the anterior corneal radius of curvature and estimate total corneal power from these front-surface measurements. These instruments extrapolate the central corneal power (K) by measuring the rate of change in curvature from the paracentral 4-mm zone; this factor takes on crucial importance in the determination of IOL power after keratorefractive surgery (see Chapter 11). The normal cornea flattens from the center to the periphery by up to 4.00 D (this progressive flattening toward the peripheral cornea is referred to as a prolate shape) and is flatter nasally than temporally.
Almost all keratorefractive surgical procedures change the refractive state of the eye by altering corneal curvature. The tolerances involved in altering corneal dimensions are relatively small. For instance, changing the refractive status of the eye by 2.00 D may require altering the cornea’s thickness by less than 30 µm. Thus, achieving predictable results is sometimes problematic because minuscule changes in the shape of the cornea may produce large changes in refraction.
Refractive Error: Optical Principles and Wavefront Analysis
One of the major applications of the wave theory of light is in wavefront analysis (see also BCSC Section 3, Clinical Optics, Chapter 6). Currently, wavefront analysis can be performed clinically by 4 methods: Hartmann-Shack, Tscherning, thin-beam single-ray tracing, and optical path difference. Each method generates a detailed report of lower-order aberrations (sphere and cylinder) and higher-order aberrations (spherical aberration, coma, and trefoil, among others). This information is useful both in calculating custom ablations to enhance vision or correct optical problems and in explaining patients’ visual symptoms.
Measurement of Wavefront Aberrations and Graphical Representations
Although several techniques are available for measuring wavefront aberrations, the most popular in clinical practice is based on the Hartmann-Shack wavefront sensor. With this device, a low-power laser beam is focused on the retina. A point on the retina acts as a point source, and the reflected light is then propagated back (anteriorly) through the optical elements of the eye to a detector. In an aberration-free eye, all the rays would emerge in parallel, and the reflected wavefront would be a flat plane. In reality, the wavefront is not flat. To determine the shape of the reflected wavefront, an array of lenses samples parts of the wavefront and focuses light on a detector (Fig 1-1A). The extent of the divergence of the lenslet images from their expected focal points determines the wavefront error (Fig 1-1B). Optical aberrations measured by the aberrometer can be resolved into a variety of basic shapes, the combination of which represents the total aberration of the patient’s ocular system, just as conventional refractive error is a combination of sphere and cylinder.
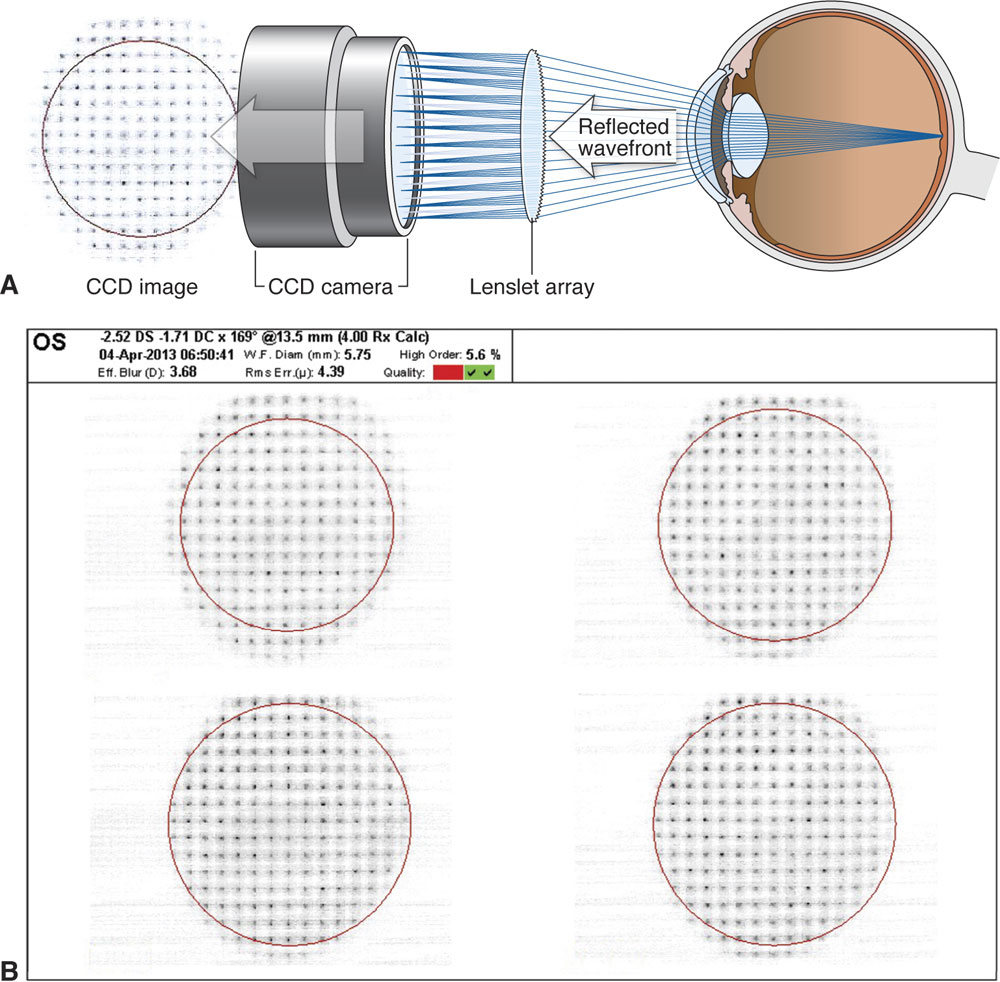
Figure 1-1 A, Schematic of a Hartmann-Shack wavefront sensor. As can be seen, the reflected wavefront passes through a grid of small lenses (the lenslet array), and the images formed are focused onto a charge-coupled device (CCD) chip. The degree of deviation of the focused images from the expected focal points determines the aberration and thus the wavefront error. B, An example of the images formed after the wavefront passes through the lenslet array. (Part A redrawn by Mark Miller from a schematic image courtesy of Abbott Medical Optics Inc.; part B courtesy of M. Bowes Hamill, MD.)
Currently, wavefront aberrations are most commonly specified by Zernike polynomials, which are the mathematical formulas used to describe the surfaces shown in Figures 1-2 through 1-6. Each aberration may be positive or negative in value and induces predictable alterations in the image quality. The magnitude of these aberrations is expressed as a root mean square (RMS) error, which is the deviation of the wavefront averaged over the entire wavefront. The higher the RMS value is, the greater is the overall aberration for a given eye. The majority of patients have total RMS values less than 0.3 µm. Most higher-order Zernike coefficients have mean values close to zero. The most important Zernike coefficients affecting visual quality are coma, spherical aberration, and trefoil.

Figure 1-2 Zernike polynomial representation of defocus. Arrows indicate z axis (arrow emerging from cone) and zero axis. (Courtesy of Tracey Technologies.)
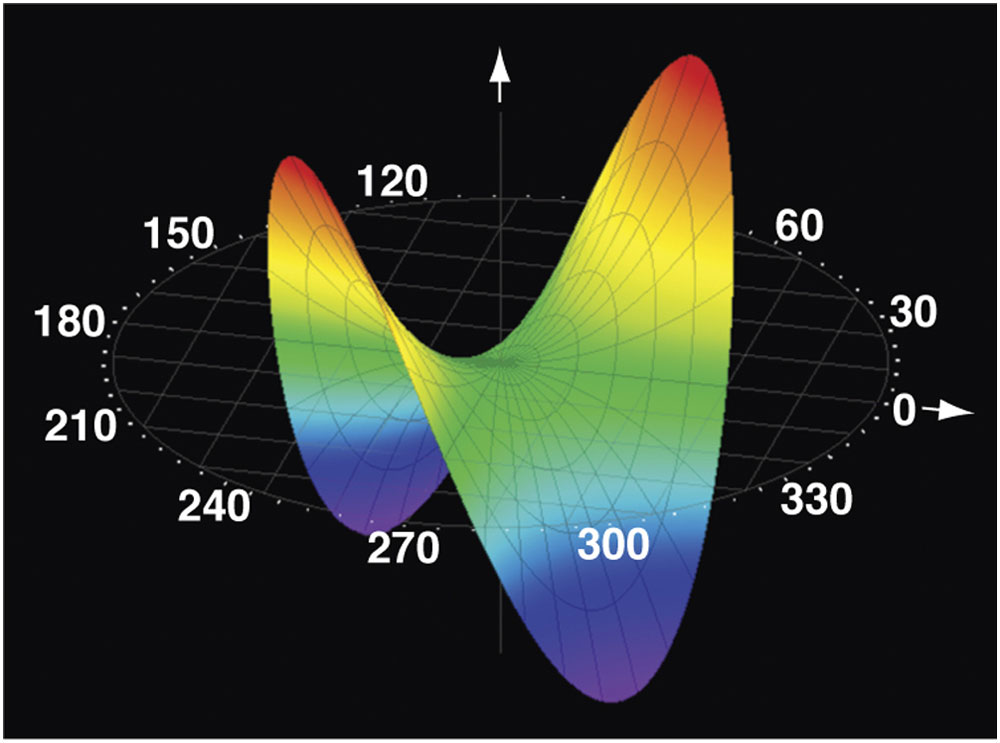
Figure 1-3 Zernike polynomial representation of astigmatism. (Courtesy of Tracey Technologies.)
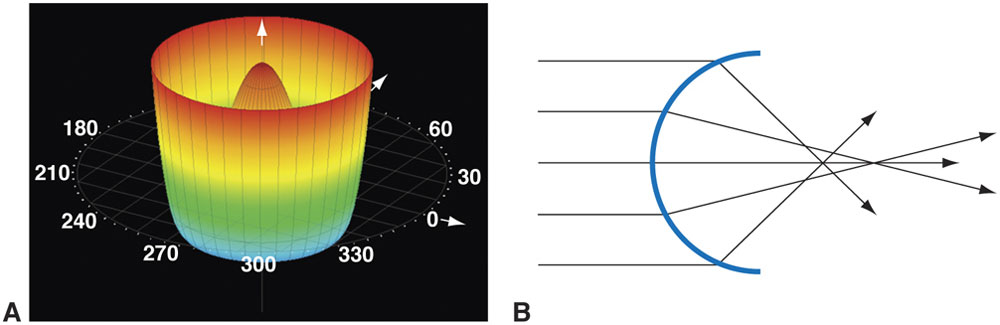
Figure 1-4 A, Zernike polynomial representation of spherical aberration. B, A schematic diagram of spherical aberration. Parallel rays impacting a spherical lens are refracted more acutely in the periphery than in the center of the lens. (Part A courtesy of Tracey Technologies; part B developed by M. Bowes Hamill, MD.)
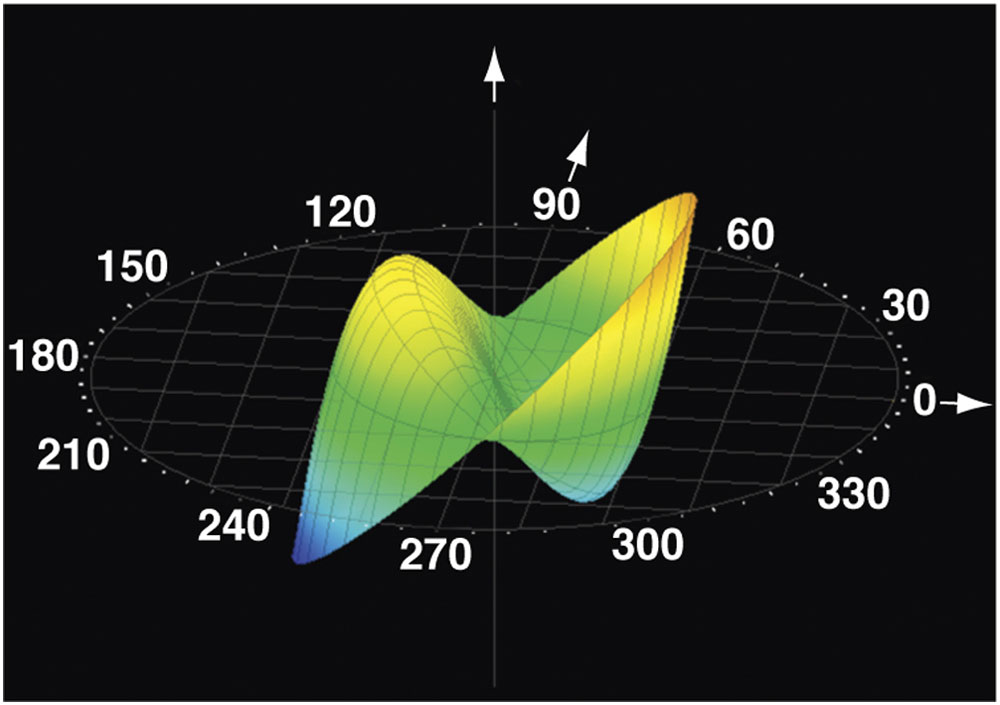
Figure 1-5 Zernike polynomial representation of coma. (Courtesy of Tracey Technologies.)
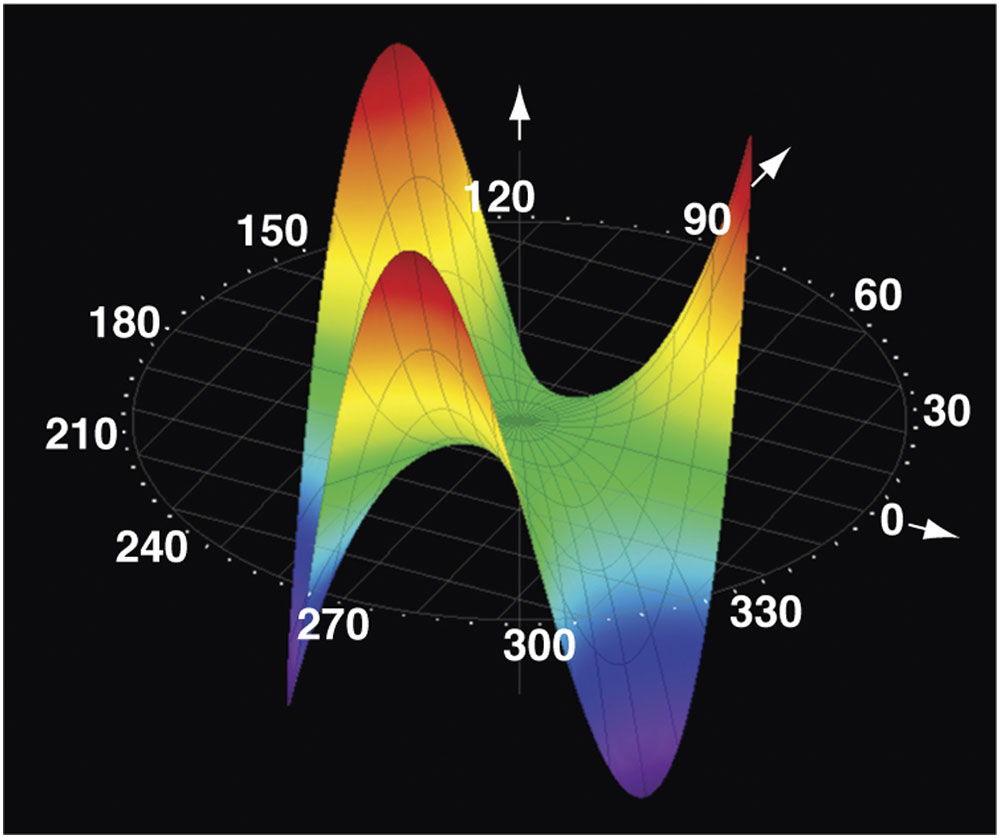
Figure 1-6 Zernike polynomial representation of trefoil. (Courtesy of Tracey Technologies.)
Fourier analysis is an alternative method of evaluating the output from an aberrometer. Fourier analysis involves a sine wave–derived transformation of a complex shape. Compared with shapes derived from Zernike polynomial analysis, the shapes derived from Fourier analysis are more detailed, theoretically allowing for the measurement and treatment of more highly aberrant corneas.
Lower-Order Aberrations
Myopia, hyperopia, and regular astigmatism are all lower-order (second-order) aberrations that can be expressed as wavefront aberrations. Myopia produces positive defocus (see Fig 1-2), whereas hyperopia produces negative defocus. Regular (cylindrical) astigmatism produces a wavefront aberration that has orthogonal (ie, facing at right angles) and oblique components (see Fig 1-3). Other lower-order aberrations are non–visually significant aberrations known as first-order aberrations, such as vertical and horizontal prisms and zero-order aberrations (piston).
Higher-Order Aberrations
Wavefront aberration is highly dependent on pupil size, with increased higher-order aberrations apparent as the pupil dilates. Higher-order aberrations also increase with age, although the clinical effect is thought to be balanced by the increasing miosis of the pupil with age. Although lower-order aberrations decrease after laser vision correction, higher-order aberrations, particularly spherical aberration and coma, may increase after conventional surface ablation or laser in situ keratomileusis (LASIK) for myopia. This increase is correlated with the degree of preoperative myopia. After standard hyperopic laser vision correction, higher-order aberrations increase even more than they do in myopic eyes but in the opposite (toward negative values) direction. Compared with conventional treatments, customized excimer laser treatments may decrease the number of induced higher-order aberrations and provide a higher quality of vision, particularly in mesopic conditions.
Spherical aberrations
When peripheral light rays impacting a lens or the cornea focus in front of more central rays, the effect is called spherical aberration (see Fig 1-4A, B). Clinically, this radially symmetric fourth-order aberration is the cause of night myopia and is commonly increased after myopic LASIK and surface ablation. It results in halos around point images. Spherical aberration is the most significant higher-order aberration. It may increase depth of field but decreases contrast sensitivity.
Coma and trefoil
With coma, a third-order aberration, rays at one edge of the pupil come into focus before rays at the opposite edge do. The effective image resembles a comet, having vertical and horizontal components (see Fig 1-5). As can be seen by examining the illustrations, light rays entering the system do not focus on a plane; rather, one edge of the incoming beam focuses either in front of or behind the opposite edge of the beam. If one were to examine the image generated by an incoming light beam passing through an optical system with a coma aberration, the image would appear “smeared,” looking somewhat like a comet with a zone of sharp focus at one edge of the image tailing off to a fuzzy focus at the opposite edge of the beam. Coma is common in patients with decentered corneal grafts, keratoconus, and decentered laser ablations.
Trefoil, also a third-order aberration, can occur after refractive surgery and produces less degradation in image quality than does coma of similar RMS magnitude (see Fig 1-6).
Other higher-order aberrations
There are numerous other higher-order aberrations, of which only a small number are of clinical interest. As knowledge of surgically induced aberration increases, more of the basic types of aberrations may become clinically relevant.
Effect of excimer laser ablation on higher-order aberrations
Whereas use of conventional (non–wavefront-guided) excimer laser ablations typically increases higher-order aberrations, both wavefront-optimized and wavefront-guided ablations tend to induce fewer higher-order aberrations and may, in principle, be able to reduce preexisting higher-order optical aberrations.
Klyce SD, Karon MD, Smolek MK. Advantages and disadvantages of the Zernike expansion for representing wave aberration of the normal and aberrated eye. J Refract Surg. 2004; 20(5):S537–S541.
Salmon TO, van de Pol C. Normal-eye Zernike coefficients and root-mean-square wavefront errors. J Cataract Refract Surg. 2006;32(12):2064–2074.
Stonecipher KG, Kezirian GM. Wavefront-optimized versus wavefront-guided LASIK for myopic astigmatism with the ALLEGRETTO WAVE: three-month results of a prospective FDA trial. J Refract Surg. 2008;24(4):S424–S430.
The cornea consists of collagen fibrils arranged in approximately 200 parallel lamellae that extend from limbus to limbus. The fibrils are oriented at angles to the fibrils in adjacent lamellae. This network of collagen is responsible for the mechanical strength of the cornea. The fibrils are more closely packed in the anterior two-thirds of the cornea and in the axial, or prepupillary, cornea than they are in the peripheral cornea. (See BCSC Section 8, External Disease and Cornea.)
Structural differences between the anterior and posterior stroma affect the biomechanical behavior of the cornea. These include differences in glycosaminoglycans as well as more lamellar interweaving in the anterior corneal stroma; thus, the anterior cornea swells far less than the posterior cornea does. Stress within the tissue is partly related to intraocular pressure (IOP) but not in a linear manner under physiologic conditions (normal IOP range). When the cornea is in a dehydrated state, stress is distributed principally to the posterior layers or uniformly over the entire cornea. When the cornea is edematous, the anterior lamellae take up most of the strain. Most keratorefractive procedures alter corneal biomechanical properties either directly (eg, radial keratotomy weakening the cornea to induce refractive change) or indirectly (eg, excimer laser surgery weakening the cornea by means of tissue removal). The lack of uniformity of biomechanical load throughout the cornea explains the variation in corneal biomechanical response to different keratorefractive procedures. For instance, LASIK has a greater overall effect than does photorefractive keratectomy (PRK) on corneal biomechanics, not only because a lamellar flap is created but also because the laser ablation occurs in the deeper, weaker corneal stroma (a more detailed discussion can be found later in this chapter and in Chapter 5).
Corneal Imaging for Keratorefractive Surgery
Corneal shape, curvature, and thickness profiles can be generated from a variety of technologies such as Placido disk–based systems and elevation-based systems (including scanning-slit systems and Scheimpflug imaging). Each technology conveys different information about corneal curvature, anatomy, and biomechanical function. In addition, computerized topographic and tomographic systems may display other data: pupil size and location, indices estimating regular and irregular astigmatism, estimates of the probability of having keratoconus, simulated keratometry, and corneal asphericity. Other topography systems may integrate wavefront aberrometry data with topographic data. Although this additional information can be useful in preoperative surgical evaluations, no automated screening system can supplant clinical experience in evaluating corneal imaging.
The degree of asphericity of the cornea can be quantified by determining the Q value, with Q = 0 for spherical corneas, Q < 0 for prolate corneas (relatively flatter periphery), and Q > 0 for oblate corneas (relatively steeper periphery). A normal cornea is prolate, with an asphericity Q value of –0.26. Prolate corneas minimize spherical aberrations by virtue of their relatively flat peripheral curve. Conversely, oblate corneal contours, in which the peripheral cornea is steeper than the center, increase the probability of having induced spherical aberrations. After conventional refractive surgery for myopia, with the resulting flattening of the corneal center, corneal asphericity increases in the oblate direction, which may cause degradation of the optics of the eye.
Corneal Topography
Corneal topography provides highly detailed information about corneal curvature. Topography is evaluated using keratoscopic images, which are captured from Placido disk patterns that are reflected from the tear film overlying the corneal surface and then converted to computerized color scales (Fig 1-7). Because the image is generated from the anterior surface of the tear film, irregularities in tear composition or volume can have a major impact on the quality and results of a Placido disk–based system. Because of this effect, reviewing the Placido image (image of the mires) prior to interpreting the maps and subsequent numerical data is a wise approach. Additionally, Placido disk–based systems are referenced from the line that the instrument makes to the corneal surface (termed the vertex normal). This line may not necessarily be the patient’s line of sight or the visual axis, which may lead to confusion in interpreting topographic maps. For a more extensive discussion of other uses of computerized corneal topography, refer to BCSC Section 3, Clinical Optics, and Section 8, External Disease and Cornea. Generally, data from the reflection of the mires from the topographic instruments are presented not only numerically but—more important for clinical evaluation—also as an image, with corneal curvature typically represented utilizing axial and tangential methods.
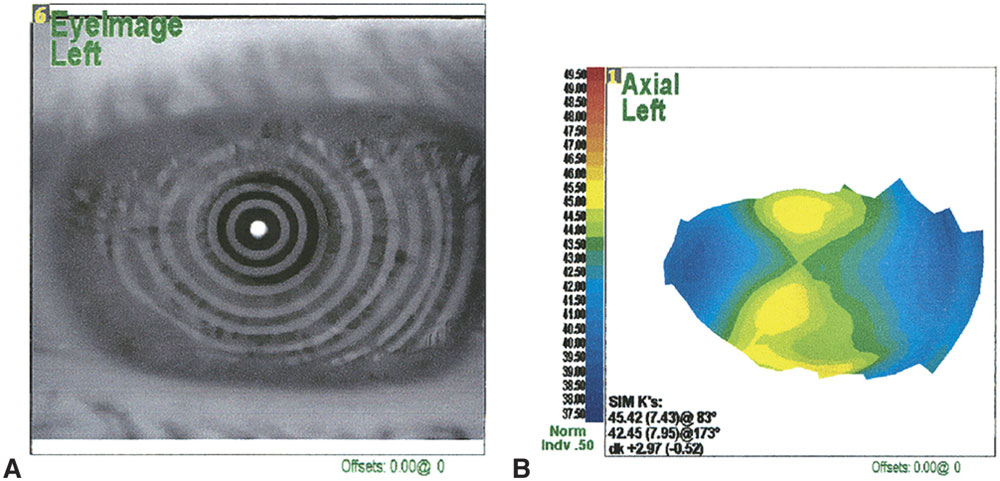
Figure 1-7 Placido imaging of the cornea. A, The raw Placido disk image; B, computer-generated color map derived from data in A. (Courtesy of J. Bradley Randleman, MD.)
Axial power and curvature
Axial power representation comes from the supposition that the cornea is a sphere and that the angle of incidence of the instrument is normal to the cornea. Axial power is based on the concept of “axial distance” (Fig 1-8). As can be seen from the illustration, axial power underestimates steeper curvatures and overestimates flatter curvatures. This representation also is extremely dependent on the reference axis employed—optical or visual.
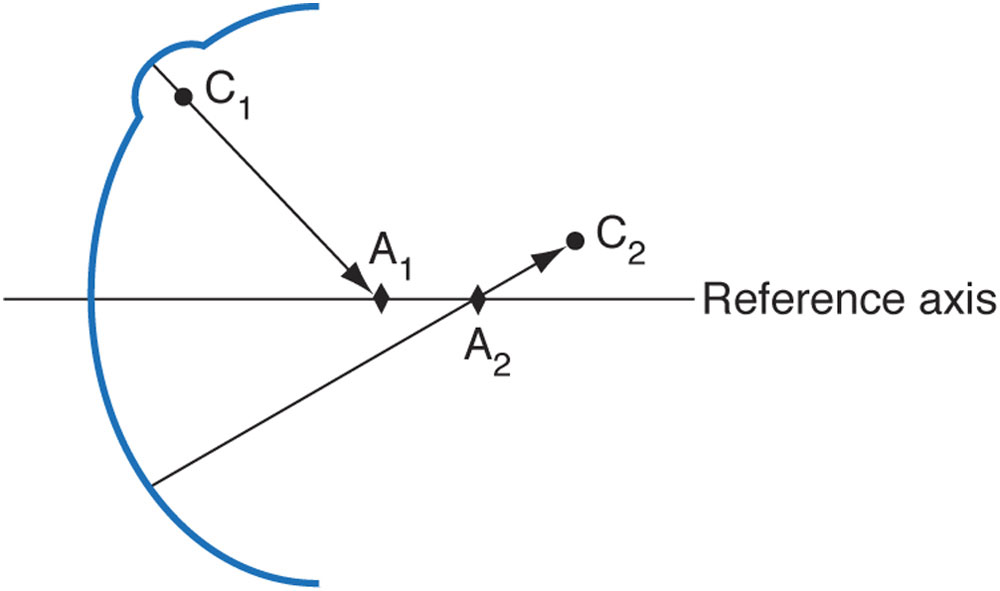
Figure 1-8 Schematic representation of the difference between axial distance (axial curvature) and radius of curvature for 2 points on a curved surface. Points C1 and C2 represent the centers of curvature of their respective surface points. Points A1 and A2 represent the endpoints of the axial distances for the given axis. As can be seen, local, steeper areas of curvature are underestimated, whereas flatter areas are overestimated. (Adapted from Roberts C. Corneal topography: a review of terms and concepts. J Cataract Refract Surg. 1996;22(5):624–629, Fig 3.)
Maps generated from the same cornea but using different reference axes look very different from one another. Axial power representations actually average the corneal powers and thereby provide a “smoother” representation of corneal curvature than does the tangential, or “instantaneous,” method. Recall that the curvature and power of the central 1–2 mm of the cornea are generally not well imaged by Placido disk techniques but can be closely approximated by the axial power and curvature indices (formerly called sagittal curvature); however, the central measurements are extrapolated and thus are potentially inaccurate. These indices also fail to describe the true shape and power of the peripheral cornea. Topographic maps displaying axial power and curvature provide an intuitive sense of the physiologic flattening of the cornea but do not represent the true refractive power or the true curvature of peripheral regions of the cornea (Fig 1-9).


