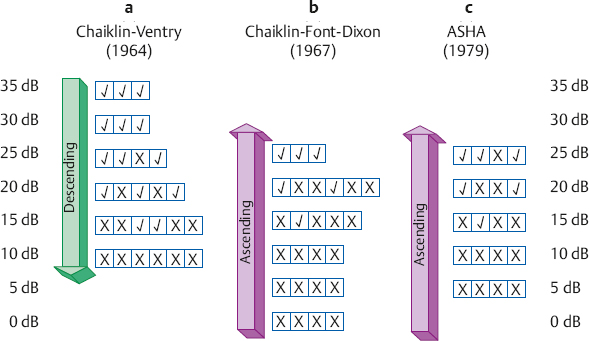
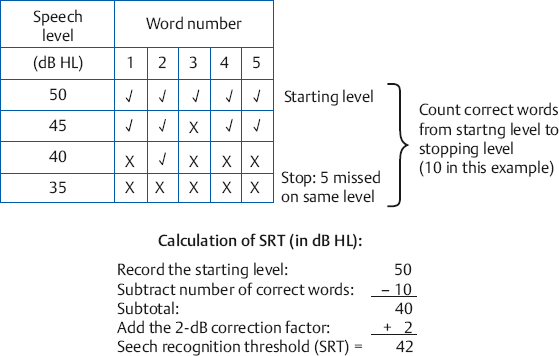
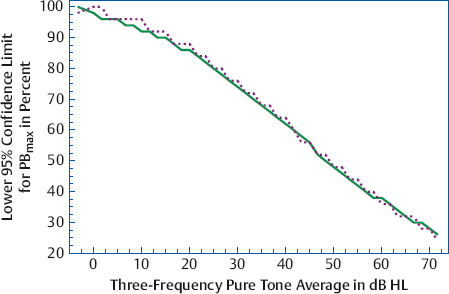
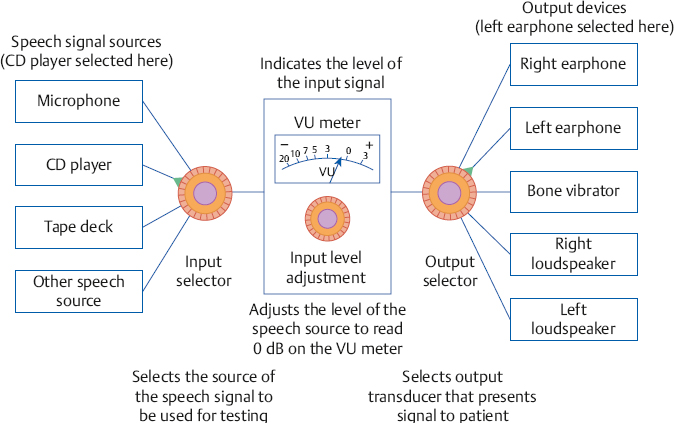
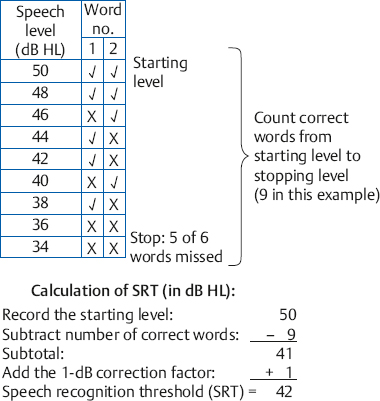
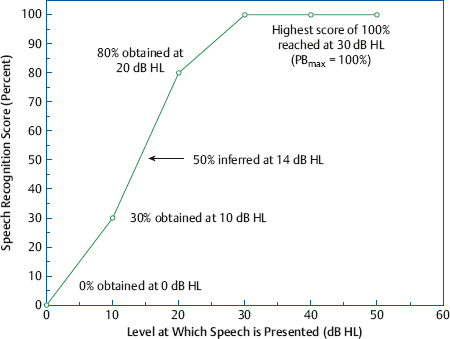
8 Speech Audiometry As the principal avenue of human communication and interaction, it is clear that speech is the most important signal we hear. Consequently, the pure tone audiogram provides only a partial picture of the patient’s auditory status because it does not give any direct information about his ability to hear and understand speech. To find out how a patient hears speech involves testing him with speech stimuli, and this process is called speech audiometry. The instrument used for speech audiometry is the speech audiometer. Although devices designed specifically for speech audiometry were used in the past, this function is now incorporated into general-purpose clinical audiometers. The characteristics of audiometers, including those used for speech audiometry, are given in the American National Standard Specifications for Audiometers (ANSI S3.6-2010) and are described in Chapter 4. The speech mode (or the speech channel) of the clinical audiometer includes the following components: (1) various sources of recorded speech material, such as a tape deck, compact disk (CD) player, and a computer; (2) a microphone for live-voice testing; (3) an input selector to choose the desired source of the speech material; (4) an input level control, which is used with a VU meter to ensure that the speech signals are at the levels necessary for them to be properly calibrated; (4) an attenuator to control the level of speech being presented to the patient; (5) an output selector to direct the speech stimuli to the desired output transducer; and (6) output transducers (earphones, loudspeakers, bone vibrator). These components are illustrated in Fig. 8.1. In addition, there is a monitor earphone and/or loudspeaker (and level adjustment) to enable the audiologist to hear the speech signals that are being presented to the patient. Because speech audiometry is generally done in a two-room testing environment, there is also a patient (response) microphone that leads to an earphone and/or loudspeaker in the control room so that the audiologist can hear the patient’s responses. Recall that clinical audiometers have two channels because we sometimes need to present a signal to one ear and a masking noise to the opposite ear, or we might need to present different signals to the two ears on certain kinds of tests. The same thing applies to speech audiometry. Thus, a separate speech mode is provided for both channels of the audiometer. This allows us to send speech signals (not necessarily the same ones) to the two ears. Similarly, we might use one channel to present a speech test to one ear and use the second channel to present a masking noise to the opposite ear. Clinical masking is discussed in Chapter 9, and its appropriate use will be assumed throughout this chapter. Calibrating the test signal(s) Calibration of the test materials is a necessary technical step in speech audiometry. Recorded materials always have a calibration signal, which is usually a 1000 Hz tone. The first steps are to select the appropriate input device (e.g., the tape deck) and set the interrupter switch to the constantly “on” position. The recorded calibration tone is then played while watching the level indicated on the VU meter. The input level dial is then turned up or down until the level of the calibration tone is at 0 dB on the VU meter. That’s all there is to it. The input level control is kept in this position as long as this recording is being used. Now stop the calibration recording and proceed to administer the test materials on that recording. It will be necessary to recalibrate whenever you change recordings or move the input level dial. In practice it is desirable to calibrate the test material before each use. Throughout this chapter it will always be assumed that this simple calibration chore has already been completed for whatever tests are being used. Live-voice testing is trickier because the clinician must “balance” his vocal effort while talking into the microphone and setting the input level control to keep his speech “peaking” at 0 dB on the VU meter. Fig. 8.1 Block diagram of the speech mode (channel) of a clinical audiometer. In this example the audiologist is using recorded speech from the CD player and is presenting that signal to the patient via the left earphone. The threshold of a nonspeech signal such as a tone has a clear meaning: it is the level at which the presence of the sound is just audible. However, the threshold for speech can mean the lowest level at which speech is either just audible or just intelligible. The lowest level at which the presence of a speech signal can be heard 50% of the time is called the speech detection threshold (SDT) or the speech awareness threshold (SAT). In contrast, the lowest level at which a speech signal is intelligible enough to be recognized or identified 50% of the time is the speech recognition threshold or speech reception threshold (SRT). The SRT is usually obtained by asking the patient to repeat spondee (or spondaic) words, which are two-syllable words that have equal emphasis on both syllables, such as “baseball” or “railroad.” Spondaic words lend themselves well to this use because a very small intensity increase causes the recognition of spondees to rise very rapidly from 0 to 100%. The SRT has also been called the spondee threshold (ST) when measured with spondaic words (ASHA 1979). All of these terms are readily understood in the field, but speech detection threshold and speech recognition threshold are the preferred usage (ASHA 1988). Speech detection and recognition thresholds should be different because the SDT depends on audibility alone, whereas the SRT requires the stimuli to be heard and identified. This expectation has been borne out repeatedly by the finding that the average SDT tends to be roughly 7 to 9 dB lower (better) than the mean SRT (Thurlow, Silverman, Davis, & Walsh 1948; Chaiklin 1959; Beattie, Edgerton, & Svihovec 1975; Beattie, Svihovec, & Edgerton 1975; Cambron, Wilson, & Shanks 1991). Cambron, Wilson, and Shanks (1991) found the mean SDT-SRT difference to be 8 dB for a male talker and 8.2 dB for a female talker. The speech reception threshold has several clinical functions: (1) to serve as a measure for corroborating pure tone thresholds, (2) to serve as a reference point for deciding on appropriate levels at which to administer suprathreshold speech recognition tests, (3) to determine hearing aid needs and performance, (4) to ascertain the need for aural (re)habilitation and progress in the management process, and (5) to determine hearing sensitivity for young children and others who are difficult to test. The speech detection threshold is generally used when an SRT is not obtainable. Recall from Chapter 5 that the pure tone thresholds in the 500 to 2000 Hz range are associated with the SRT. We will see in Chapter 14 that a lack of reasonable consistency between the SRT and the pure tone thresholds is associated with functional hearing losses. In fact, as already mentioned, it is commonly accepted that one of the principal applications of the SRT is to corroborate the pure tone findings. The SRT was originally compared with the pure tone average (PTA) of 500, 1000, and 2000 Hz (Fletcher 1929; Carhart 1946a), but it soon became apparent that this three-frequency PTA is not necessarily the combination of pure tone thresholds that comes closest to the SRT. This is especially true with sloping audiograms, where the pure tone thresholds may be quite different from one frequency to the other. Agreement between the SRT and PTA is improved under these conditions by using other combinations. Fletcher (1950) recommended using the average of the best two of these three frequencies, usually 500 and 1000 Hz. Carhart (1971) suggested that PTA-SAT agreement is maximized by a simple formula that involves subtracting 2 dB from the average of the 500 Hz and 1000 Hz thresholds. Single-frequency comparisons to the SRT are also sometimes appropriate. Carhart and Porter (1971) found that the single frequency with the highest correlation to the SRT is 1000 Hz, unless there is a sharply sloping hearing loss. When the audiogram slopes precipitously, it is often useful to compare the SRT to the one frequency that has the best threshold, which is often 500 Hz, and can even sometimes be 250 Hz (Gelfand & Silman 1985, 1993; Silman & Silverman 1991). As already indicated, most speech recognition thresholds are obtained using spondaic words, and we will concentrate on this method. Recorded 42-word spondee tests were originally developed at the Harvard Psychoacoustic Laboratory (PAL) by Hudgins, Hawkins, Karlin, and Stevens (1947). They tried to use phonetically dissimilar words from a familiar vocabulary that reasonably represented the sounds of English and were as homogeneous as possible with respect to their audibility. The PAL lists were provided in two recorded formats: all of the spondees were recorded at the same level in PAL Test No. 14, whereas they were attenuated by a fixed amount of 4 dB after every sixth word on PAL Test No. 9. Subsequently, Hirsh et al (1952) of the Central Institute for the Deaf (CID) improved upon the original spondaic materials by reducing the list to the 36 most familiar spondees and by recording the words in a way that made them homogeneous with respect to difficulty. This was done by adjusting the recording level by –2 dB for the easiest spondees and by +2 dB for the hardest words. Six randomizations of the list were recorded with all of the spondees at the same level on the CID W-1 Test, and with an attenuation of 3 dB after every third word on the CID W-2 Test. In addition, each test word was preceded by the carrier phrase “Say the word …,” which was recorded at a level 10 dB higher than the test word itself. Contemporary studies using digital technology are addressing the issue of achieving homogeneous test materials in terms of the psychometric equivalence of recorded spondee words (e.g., Bilger, Matthies, Meyer, & Griffiths 1998; Wilson & Strouse 1999). Numerous modifications and variations of the CID spondee materials have been introduced since the original lists and tests were distributed in the 1950s. A distinction is made between lists and tests because, for example, the CID W-1 Test refers to the specific recording just described. Presenting the same word list by live voice or from another recording actually constitutes a different test because of talker and recording differences. The spondaic word list recommended by ASHA (1988) is a revision of the CID W-1/W-2 list, emphasizing the criteria of dissimilarity among the words and homogeneous audibility. Recorded versions of the spondee tests (as well as many of the others discussed in this chapter) on cassette tapes and/or CDs are produced by Auditec of St. Louis, Virtual Corporation, and the Department of Veterans Affairs (VA). For example, the psychometrically equivalent spondee tests using a female talker developed by Wilson and Strouse (1999) are included in a CD produced by the Department of Veterans Affairs (1998). In addition, ASHA (1988) recommended a streamlined list of 15 highly homogeneous spondees based on research by Young, Dudley, and Gunter (1982), and a list of 20 spondees easily represented by pictures that are suitable for testing young children, based on findings by Frank (1980). Shortened lists like these are commonly used in clinical practice, but the student should be aware that shortening the word list lowers the SRT (Punch & Howard 1985; Meyer & Bilger 1997). Several examples of commonly used spondaic word lists may be found in Appendix B. Although spondees are used in the overwhelming majority of routine clinical SRT measurements, they are not the only materials available for this purpose. Sentences are also used to obtain SRTs, principally against a background of noise or speech babble (the composite of several talkers all speaking at the same time). We will return to the use of these sentence reception thresholds later in this chapter. The first part of the SRT testing process involves instructing the patient about the task and familiarizing him with the test words. As recommended by ASHA (1988), the instructions should indicate the nature of the task, that it involves speech material, how the patient is to respond, that he should continue responding even when the words are faint, and that guessing is encouraged. The following is an example of instructions that one might use: The next test is used to find the softest speech that you can hear and repeat back. I (or a recorded voice) will say two-syllable words like “baseball” or “railroad,” and your job is to repeat each word. The words will start out being loud so that you can familiarize yourself with them. They will then get softer and softer. Your job is to keep repeating the words back to me, no matter how soft they become, even if you have to guess. Do you have any questions? (Address these questions as necessary.) Notice that these instructions also refer to the familiarization process that precedes the actual testing. The purpose of familiarization is to ensure that the patient knows the test vocabulary and is able to recognize each word auditorily, and that the clinician can accurately interpret the patient’s responses (ASHA 1988). The importance of the familiarization process is well established (Pollack, Rubenstein, & Decker 1959; Tillman & Jerger 1959; Conn, Dancer, & Ventry 1975). For example, Tillman and Jerger (1959) found that the average SRT is ~ 4 to 5 dB lower with familiarization than without it. Spondaic words may be presented to the patient using readily available recorded materials or by monitored live voice, which means the words are spoken into a microphone by the audiologist, who monitors her voice level on the audiometer’s VU meter. Recorded material is preferred for SRT testing, but presenting the stimuli by monitored live voice is also acceptable (ASHA 1988). Compared with monitored live-voice testing, recorded materials provide much better control over the level and quality of the speech signals being presented to the patient, as well as the obvious benefits of greater standardization. On the other hand, the flexibility afforded by monitored live-voice testing is often desirable or essential when testing patients who require any kind of modification of the test procedure. Typical examples are elderly patients who might need more time to respond than is provided on the recording, children or others with restricted vocabularies, etc. The need for flexibility is not limited to patients who have special needs. For example, it is often desirable to test at a faster pace than is possible with recorded lists when testing some young, normal adults. In addition, the SRT is usually robust enough to withstand the limitations of live-voice testing, and has been found to be reliable under these conditions (Carhart 1946b; Creston, Gillespie, & Krohn 1966; Beattie, Forrester, & Ruby 1977). In fact, modified live voice is the most common way to present spondees for the SRT, and its use for this purpose is generally agreeable even to ardent proponents of recorded materials for most other kinds of speech recognition testing. However, the audiologic results should indicate that the SRT was obtained by monitored live voice when this is the case. Whether the test word is introduced by a carrier phrase (e.g., “Say the word …”) does not appear to have any substantive effect upon the resulting SRT (Silman & Silverman 1991). In fact, even though carrier phrases were included on the original Technisonics Studios phonograph recordings of W-1 and W-2, they are omitted from current commonly used spondee recordings such as those by Auditec of St. Louis and Virtual Corporation. It would unnecessarily fatigue the patient and waste time and effort to present many test words at levels well above or below the actual SRT. For this reason, SRT testing usually has an initial phase in which the level of the spondee words is changed in relatively large steps to make a quick, rough estimate of where the SRT is probably located. This ballpark estimate provides an efficiently placed starting level for the actual threshold search. Most SRT protocols specify the starting hearing level and technique for making this ballpark estimate, and this initial testing phase will be mentioned for each of the four SRT methods described below. However, one should be aware that many audiologists select the level to present the first word based on the patient’s behavior or pure tone thresholds. It is generally accepted that the SRT is the lowest hearing level at which a patient can repeat 50% of spondee words, but there are many ways to find this point and no single technique is universally accepted. Most SRT testing methods share several common features even though their specific characteristics can vary widely. The most common characteristic is that several spondee words are presented to the patient one at a time at the same hearing level. The descending methods begin presenting these blocks of test words above the estimated SRT so that the patient is initially able to repeat them, and then present subsequent blocks of spondee words at progressively lower hearing levels. This process is repeated until the patient misses a certain number of words, at which time the descending run is over. On the other hand, ascending methods start below the estimated threshold, where the patient cannot repeat the words, and then present subsequent blocks of test words at progressively higher hearing levels. This procedure is repeated until the patient correctly repeats a certain number of words, at which point the ascending run is terminated. What distinguishes the methods are features such as how many words are in a block, what are the criteria for starting and stopping an ascending or descending run, and how one defines the “50% correct” level. One general group of SRT methods considers the SRT to be the lowest hearing level where half (or at least half) of a block of the words is correct. Three examples are illustrated in Fig. 8.2, although other techniques are also useful (e.g., Downs & Dickinson Minard 1996). The Chaiklin and Ventry (1964) method is a descending technique because it begins by presenting the spondee words at a level that is high enough for them to be heard and repeated easily, and then searches for the SRT by presenting words at progressively lower hearing levels. The method involves presenting the spondees one at a time in blocks of up to six words per level. The intensity is decreased in 5 dB steps to find the lowest level where three words are repeated correctly. Two-decibel steps may also be used, but Chaiklin and Ventry (1964) found that 2 and 5 dB step sizes yield comparable results for clinical purposes. The initial testing phase begins 25 dB above the patient’s two-frequency pure tone average, and involves presenting one word per level in decreasing 5 dB steps until one word is missed. The starting point for the main SRT search begins 10 dB above that level. Fig. 8.2 Examples of measuring the SRT with (a) descending (Chaiklin & Ventry 1964), (b) ascending (Chaiklin, Font, & Dixon 1967), and (c) ascending (ASHA 1979) methods. The ASHA (1979) method includes a second ascending run beginning 10 dB below the first SRT measurement (not shown). The SRT is defined as the lowest hearing level where three out of a possible six spondee words are repeated correctly in (a) and (b), and as the lowest level where at least three of the spondees are repeated correctly in (c). The Chaiklin-Ventry technique is illustrated in Fig. 8.2a. Suppose the first word was missed at 25 dB HL during the initial phase of testing, so that the starting level for our SRT search is 10 dB higher, at 35 dB HL. It is not necessary to present more than three words at the 35 dB starting level because they are all correct. The rationale is that three correct words out of a possible six indicates the performance is already at least 50%, so that nothing would be gained by presenting any more words at this level. This is why many of the blocks in the figure have fewer than six words even though the method is theoretically based on six words per level. In any case, because the patient repeated three words at 35 dB HL, we now know that the SRT must be 35 dB HL or lower. The level is thus reduced to 30 dB HL, where the same thing occurs, so we know the SRT is 30 dB HL or lower. When the level is reduced to 25 dB HL, the first two words are right but the third one is wrong. We must now present another word because it is possible for the percentage of correct responses to be less than 50%. The fourth word is correct, bringing the tally to three right and one wrong at this level. Here, too, the score would be at least 50% if all six words were given, so there would be no benefit from presenting more words at this level. The SRT is now 25 dB HL or lower. Five words are needed at 20 dB HL. Let us see why. The first three words include an error, so a fourth is needed. The fourth word brings the tally to two right and two wrong. Based on a possible six words, the score could still be 33% (2 of 6), 50% (3 of 6), or even 67% (4 of 6). A fifth word is therefore presented, which is correct. This brings the tally to three correct out of a possible six, again meeting the criterion. The SRT is now 20 dB HL or lower. The intensity is reduced to 15 dB HL, where the following is found: one right out of three, two correct out of four, and two right out of five. Here a sixth word is needed to determine whether the score is 50% (3 of 6) or 33% (2 of 6). Word 6 is wrong, indicating that 15 dB is below the SRT. Thus, the SRT is 20 dB HL in this example, because this is the lowest level where half of the spondee words are repeated correctly (out of a possible 6). The figure shows that 10 dB HL was also tested because the Chaiklin-Ventry method requires that we continue testing until all six words in a block are wrong, which occurs here at the next lower level. Chaiklin, Font, and Dixon (1967) described an ascending SRT method that is otherwise very similar to the Chaiklin-Ventry technique in that it uses the same number of words per level, step size, and definition of the SRT. This method is illustrated in Fig. 8.2b. Because this is an ascending method, the starting level is now below the expected SRT. The initial testing phase with this approach begins at –10 dB HL, and involves presenting one word per level in ascending 10 dB steps until one word is repeated correctly. The main threshold search for SRT is then started 20 dB below that level. For example, if the first word was correctly repeated at 20 dB HL during the initial phase, then the starting level for the main test would be 20 dB lower, or 0 dB HL, which is shown in the figure. In the ascending method, we are working upward until the patient finally repeats correctly three out of a theoretical six words per level. The reasoning for how many words to use per level is analogous to the Chaiklin-Ventry method, except that we must be mindful of the direction. At least four words must be presented and missed before raising the test level because this is the smallest number of misses that can tell us that we are still below the SRT. In other words, the patient must miss four out of a possible six words before we really know that he cannot possibly repeat three of them. This explains why four errors are shown at each ascending level from the starting level of 0 dB HL through 20 dB. Only four words are needed if the patient misses all of them (e.g., at 0, 5, and 10 dB HL), but five words must be used if one is correct (e.g., at 15 dB HL), and six words are needed if two are right (e.g., at 20 dB HL). The SRT in this example is 25 dB HL because this is the first level where three words are repeated correctly. It is not necessary to go above this point because the SRT is defined as the lowest level where the patient correctly repeats three of a possible six spondees. Incidentally, just because the patient got all three words correct in a row in our example does not mean this is always the case. Any combination of three correct spondees in a block of up to six words at the same hearing level will do (e.g., “x The ascending SRT method recommended by ASHA (1979) is illustrated in Fig. 8.2c. Its initial testing phase is similar to the Chaiklin, Font, and Dixon (1967) approach, except that the starting level for the main test is 15 dB below the level where the first word is correctly repeated. This is why the two methods have different starting levels in the figure. The ASHA (1979) method has the following characteristics: Four spondee words are presented at each hearing level. The hearing level is increased by 5 dB until at least three of the words are correctly repeated at the same level (which is 25 dB HL in the figure). The intensity is then reduced by 10 dB, and a second ascending series of presentations is administered using the same technique (not shown in the figure). The SRT is defined as the lowest level at which at least three words are correctly repeated, based on at least two ascending runs. The methods just described are similar in that the SRT is the hearing level of the block of words that meets some criterion (such as 3 of 6 or 3 of 4 words correct). Another general group of SRT methods involves interpolating the 50% correct level using the responses obtained from several blocks of words (Hudgins et al 1947; Tillman & Olsen 1973; Wilson, Morgan, & Dirks 1973; ASHA 1988), and is based on well-established statistical principles (Spearman 1908). This technique is often called the Tillman-Olsen method and is incorporated into the ASHA (1988) guidelines for SRT testing. The initial phase of the ASHA (1988) method is a ballpark estimate. It begins by presenting one spondee word at 30 dB or 40 dB HL. If the original intensity is too low for the patient to repeat the first word, then it is increased in large, 20 dB steps (giving one word per step) to quickly find where she can repeat a word. Regardless of whether the first word is repeated at 30 dB HL or at 70 dB HL, then one word per level is presented in decreasing 10 dB steps until the patient misses a word, at which point a second word is presented. This descending strategy continues until she misses two consecutive words at the same level. The starting level for the main SRT determination will be 10 dB higher than the level where the two words were missed. Thus, if the patient misses two consecutive words at 40 dB HL, the starting level would be 50 dB HL. Having arrived at a starting level, we are now ready to find the SRT using the ASHA (1988) procedure. The testing itself is similar to the other methods, except five words are given at every level and we keep track of whether each word is right or wrong on a tally sheet such as the one shown in Fig. 8.3. First, five spondee words are presented one at a time at the starting level, where the patient usually repeats all of them correctly. We then decrease the hearing level by 5 dB and present another five words, tallying the results for each word. This descending procedure continues until the patient misses all five words at the same level. This “stopping level” is 35 dB HL in the example. Notice that the patient’s performance goes from 100% correct at the starting level down to 0% correct at the stopping level. The SRT is interpolated from this range by, in effect, giving 1 dB of credit for each correctly repeated word. The calculation is done by following these steps: 1. Record the starting level (50 dB in the example). 2. Count all the correct words, including the starting level (10 words in the example). 3. Subtract the number of correct words from the starting level (50 – 10 = 40). 4. Add a 2 dB correction factor to the difference found in step 3 (40 + 2 = 42). The result in step 4 is the SRT, expressed in dB HL (SRT = 42 dB HL). The ASHA (1988) method can also be done with 2 dB steps (Fig. 8.4). Here, we present two words per level and stop testing when the patient misses five out of six words. The calculation is also the same, except that the correction factor is 1 dB. In general, the differences between SRTs obtained with the various test methods tend to be either not statistically significant or too small to be of any major clinical relevance. For example, SRTs are ~ 2.7 to 3.7 dB better (lower) with the ASHA (1988) method compared with the ASHA (1979) procedure, but the 1979 method has a slight edge with respect to agreement between the SRT and pure tone averages (Huff & Nerbonne 1982; Wall, Davis, & Myers 1984; Jahner, Schlauch, & Doyle 1994). The 1988 method took less time to administer than the 1979 technique in two studies (Huff & Nerbonne 1982; Wall et al 1984), but Jahner et al (1994) found that the 1988 method took 4 seconds longer plus 11 seconds for the SRT calculation. It is hard to demonstrate a singularly “best” method, although the ASHA (1988) approach appears to be the most appealing one on conceptual grounds. Bone-conduction speech audiometry most often involves obtaining an SRT. This approach has been used to (1) help indicate whether a conductive loss is present (by comparison to the air-conduction SRT) in children and other patients when reliable pure tone results are lacking, (2) provide insight about the status of the cochlea before and after middle ear surgery, and (3) corroborate bone-conduction pure tone thresholds (Bess 1983; Olsen & Matkin 1991). Although reference values are provided for presenting speech stimuli by bone-conduction (see Chapter 4), it is a wise choice to calibrate on an empirical basis for the presentation of speech by bone-conduction. Fig. 8.3 Tally sheet and calculation of the SRT with 5 dB steps according to the ASHA (1988) method. Fig. 8.4 Tally sheet and calculation of the SRT with 2 dB steps according to the ASHA (1988) method. The most comfortable loudness level (MCL) for speech is the hearing level at which the patient experiences speech material to be most comfortable, that is, where she prefers to listen to speech material. In contrast, the uncomfortable loudness level (UCL) for speech is the hearing level at which the patient considers speech material to be uncomfortably loud. The uncomfortable loudness level is also known as the loudness discomfort level (LDL). The types of speech material typically used for obtaining the MCL and UCL include continuous discourse, spondee words, and sentences. “Continuous discourse” (or “cold running speech”) is usually a recorded selection of some prose material. Relatively uninteresting selections are used so that the patient can focus on the loudness of the material without being distracted by its content. Both the MCL and UCL are affected by the testing method used and the instructions given to the patient, although generally accepted, standardized methods for their measurement are lacking (Punch, Joseph, & Rakerd 2004a). The basic approach involves adjusting the speech level up or down until the patient indicates that it is comfortably loud for the MCL and uncomfortably loud for the UCL. Another approach employs category rating methods like the Contour Test (Cox, Alexander, Taylor, & Gray 1997). Originally designed for use with tonal stimuli, the Contour Test was successfully used to measure MCLs and UCLs for spondee words by Punch, Rakerd, & Joseph (2004b). In this test, the patient listens to spondee words presented one at a time at different levels, and rates the loudness of each of them based on a choice of descriptive categories. An example would be a seven-point scale, where 1 is “very soft,” 2 is “soft,” 3 is “comfortable, but slightly soft,” 4 is “comfortable,” 5 is “comfortable, but slightly loud,” 6 is “loud, but OK,” and 7 is “uncomfortably loud.” As they try to find the MCL, new clinicians learn rather quickly that many patients report comfortable loudness at several hearing levels. This experience reveals that the MCL is actually a range of levels instead of a level (Dirks & Morgan 1983; Punch et al 2004a). Because ascending tests produce low estimates of the MCL and descending tests produce high estimates, it has been suggested that these two measurements might be used to identify the lower and upper ends of the MCL range, in which case the midpoint between them might be used when a single value is desired (Dirks & Kamm 1976; Punch et al 2004b). Why are descending MCLs higher than ascending MCLs? The stimuli start at high levels (from which they are lowered) in a descending test, whereas they start at low levels (from which they are raised) in an ascending test. Thus, the patient’s MCL judgment is affected by the point of reference provided by the preceding sounds, which are much louder when a descending test is done and much softer when an ascending test is done (Punch et al 2004a). Consistent with this, Punch et al (2004b) showed that MCLs were influenced by whether they were tested before or after UCLs. Specifically, MCLs were significantly elevated when they followed a UCL measurement. (However, UCLs were not appreciably affected by test order.) The clinical implications are that (1) ascending MCL estimates should be done before descending MCL estimates when both are being used to establish the MCL range, and (2) MCL testing should be completed before UCL testing (Punch et al 2004b) When testing for the UCL, it is important for the patient to understand that he should indicate when the experience of loudness becomes uncomfortable (Dirks & Morgan 1983). For example, the instructions for the Contour Test tell the patient to “Keep in mind that an uncomfortably loud sound is louder than you would ever choose on your radio no matter what mood you are in” (Cox et al 1997, p. 390). This is an important point because we are interested in when the sound becomes uncomfortably loud rather than the patient’s capacity to endure pain. In other words, we are concerned with sound levels that begin to produce an uncomfortable auditory experience, as opposed to the tactile sensations (e.g., tickle, feeling, pain) associated with the highest tolerable sound intensities. For this reason, uncomfortable loudness level is often preferred over other terms that include words like discomfort and tolerance, such as loudness discomfort level, tolerance level, or threshold of discomfort. The range in decibels between the patient’s SRT and UCL is called the dynamic range. It is, in effect, the patient’s usable listening range. For example, if a patient has an SRT of 15 dB HL and a UCL of 100 dB HL, then her dynamic range would be 100 – 15 = 85 dB wide. This means that the patient’s hearing can accommodate a range of sound intensities that is 85 dB wide. One of the major problems faced by many patients with sensorineural hearing losses is that their thresholds are elevated but their UCLs remain essentially unchanged, which results in a constricted dynamic range. For example, a patient’s SRT might be elevated to 65 dB HL, but her UCL might still be 100 dB HL, so that her dynamic range would be 100 – 65 = 35 dB wide. Notice the difference between this situation and the prior example. There would be no problem “fitting” the wide range of intensities in the real world into a usable (dynamic) listening range that is 85 dB wide. However, the patient in the second example has a usable listening range that is only 35 dB wide, which is too narrow to accommodate the range of intensities found in the real world of sound. Imagine the implications of a restricted dynamic range for hearing aid use: Amplifying sound levels so they become audible (which is desirable) will also cause many sounds to exceed the patient’s UCL (which is undesirable). Consequently, in addition to amplifying them, we must also try to “squeeze” the wide range of real-world sounds into the patient’s narrower dynamic range. There is a readily understandable distinction between the threshold for speech and the ability to understand the speech that is heard. Consider the following complaints expressed by a variety of hearing-impaired patients: “I can hear speech but I can’t understand it”; “Words aren’t clear”; “Speech sounds muffled [or distorted]”; or “I mistake one word for another.” The common theme here is that the speech heard by the patient is lacking in intelligibility. This problem is experienced in terms of inaccurately received messages and/or reduced clarity. Speech recognition measures have been used in every phase of audiology, such as (1) to describe the extent of hearing impairment in terms of how it affects speech understanding, (2) in the differential diagnosis of auditory disorders, (3) for determining the needs for amplification and other forms of audiologic rehabilitation, (4) for making comparisons between various hearing aids and amplification approaches, (5) for verifying the benefits of hearing aid use and other forms of audiologic rehabilitation, and (6) for monitoring patient performance over time for either diagnostic or rehabilitative purposes. Speech intelligibility can be tested clinically in a straightforward manner. The most common approach is to present the patient with a list of test words. The percentage of test words correctly repeated by the patient is called the speech recognition score, the word recognition score, or the speech discrimination score. Speech recognition score is the preferred term because it describes the task in terms of the patient’s response, which involves recognizing or identifying the test items. It is often called the “suprathreshold speech recognition score” because these tests are typically performed at levels above the threshold for speech. Word recognition score is an equally acceptable term provided the test items are words, which is usually the case. Even though it is a popular term, speech discrimination score is less desirable because it refers to a different kind of test than that usually performed. Specifically, a speech discrimination test involves comparing two (or more) items and judging whether they are the same or different. Speech recognition scores are sometimes called “PB scores” for reasons that will become clear, although this term is technically correct only when “PB” materials are used. One sometimes sees references to “articulation testing” and “articulation scores,” particularly in the older literature. Even though this term is rarely used anymore, it was actually quite appropriate because it alludes to the degree of correspondence between the stimulus and the response. The student has probably noticed that speech recognition score looks and sounds a lot like speech recognition threshold. The possible confusion of these terms is one reason that many audiologists continue to use the terms speech reception threshold and speech discrimination score even though the preferred nomenclature is more descriptive and precise. Speech recognition tests were originally devised to assess the effectiveness of telephone and radio communication systems, and various different kinds of speech material were used for this purpose. The most commonly used materials for clinical speech recognition testing are monosyllabic words that are presented in an open-set format. An open-set format means the patient must respond without any prior knowledge of what the possible alternatives might be, whereas a closed-set format means the patient is provided with a choice of several possible response alternatives. In other words, an open-set item is much like a fill-in question and a closed-set item is much the same as a multiple-choice question. This section outlines the development of the W-22 and NU-6 lists, which are the most widely used speech recognition tests in general clinical practice. We can then discuss the fundamental aspects and implications of speech recognition testing without being overwhelmed by the details of alternative kinds of tests. Other speech recognition materials will be discussed later in the chapter. The common features of the W-22 and NU-6 speech recognition tests include an open-set format; 50-word lists composed of reasonably familiar monosyllabic words, each of which is preceded by a carrier phrase (such as “You will say …” or “Say the word …”); and phonetic or phonemic balance within each list. Several recorded versions of these tests are commercially available. The CID W-22 and NU-6 test lists may be found in Appendices C and D. The first monosyllabic word materials to enjoy wide clinical use were the Harvard PAL PB-50 test (Egan 1948). The PB-50 test is the precursor of the W-22 and NU-6 materials, which have supplanted it in day-to-day speech recognition testing. Each of the 20 PB-50 lists included 50 words that were phonetically balanced (hence the name “PB-50”). Phonetic balance means that the relative frequencies of the phonemes on the test list are as close as possible to the distribution of speech sounds used in English, which was in turn based on Dewey’s (1923) analysis of 100,000 words in newsprint. To improve word familiarity and phonetic balance, Hirsh et al (1952) included 120 of the 1000 PB-50 words in the CID W-22 test lists. The W-22 test includes 200 words arranged in four 50-word lists (1–4), each of which was recorded using six randomizations. Phonetic balance on the W-22 lists is based on an analysis of spoken English (business telephone conversations) by French, Carter, and Koenig (1930), as well as the Dewey word counts, where 95% of the words on the W-22 lists are among the 4000 most common words found by Thorndike (1932). Northwestern University Auditory Test No. 6, or the NU-6 test, is composed of four lists of 50 phonemically balanced consonant-vowel nucleus-consonant, or CNC, words (Tillman & Carhart 1966). Just as the W-22 test was derived from the PB-50 materials, the NU-6 lists were based on the earlier work of Lehiste and Peterson (1959; Peterson & Lehiste 1962). Lehiste and Peterson (1959) modified the concept of phonetic balance to one of phonemic balance in recognition of the fact that speech recognition is accomplished on a phonemic rather than a phonetic basis. This is a real distinction because phonemes are actually groups of speech sounds (each of which is a phonetic element) that are classified as being the same by native speakers of the language. Thus, all phonetic differences are not phonemically relevant. For example, phonetically different variants of the phoneme /p/ (allophones of /p/) are identified as /p/ even though they vary in terms of their articulatory and acoustic (i.e., phonetic) characteristics in different speech sound contexts (e.g., /p/ as in /pat/ versus /pit/, or initially versus finally as in /pεp/) and from production to production. To achieve a reasonable degree of phonemic balance, Lehiste and Peterson developed test lists from 1263 monosyllabic words. These were all CNC words drawn from the Thorndike and Lorge (1944) word counts. The original CNC lists were subsequently modified to replace the least familiar words (Peterson & Lehiste 1962), so that all but 21 of the words on the final version of the CNC lists have a frequency of ≥ 5/million. Tillman, Carhart, and Wilber (1963) used 95 of Lehiste and Peterson’s CNC words and 5 others to construct two 50-word lists known as the NU-4 test, which may be viewed as an intermediate step in the development of the NU-6 test. The 100 CNCs on the NU-4 lists were increased to 200 words (185 of which are from the Lehiste and Peterson materials) to develop the four 50-word lists that compose the NU-6 test (Tillman & Carhart 1966). The speech recognition testing process is extremely simple. We will assume that the test is being done with either recorded W-22 or NU-6 materials, but the fundamentals are largely the same regardless of which test is used. The patient is instructed to listen to the test recording and to repeat each test word, guessing if necessary. The attenuator is then set to the desired presentation level, and the speech materials are presented to the patient through the desired output transducer (e.g., one of the earphones). The clinician keeps a tally of right and wrong responses during the test and then calculates a percent correct score. Each word is worth 2% on a 50-word test. For example, the speech recognition score would be 92% if four words are missed or repeated incorrectly, 86% if seven words are wrong, etc. Foreign language speakers and those who cannot give a verbal response can often be tested effectively by having them respond by pointing to the response word from a choice of alternative words or pictures (Spitzer 1980; Wilson & Antablin 1980; Comstock & Martin 1984; McCullough, Cunningham, & Wilson 1992; McCullough, Wilson, Birck, & Anderson 1994; Aleksandrovsky, McCullough, & Wilson 1998). Speech recognition scores are generally expected to be ~ 90 to 100% in normal-hearing individuals. The range of speech recognition scores is typically between 80 and 100% with most conductive losses (e.g., otitis media, otosclerosis), but has been found to be as low as 60% in cases of glomus tumor; and the range for sensorineural losses is anywhere from 0 to 100%, depending on etiology and degree of loss (Bess 1983). In general, speech recognition scores that are “abnormally low” are associated with retrocochlear lesions; however, there is no clear cutoff value for this decision (e.g., Johnson 1977; Olsen, Noffsinger, & Kurdziel 1975; Bess 1983). As we shall see in the next section, a lower than expected speech recognition score can also occur if the test level is not high enough. Thus, an atypically low speech recognition score often means the clinician must retest at a higher hearing level. When is a speech recognition score “too low” with respect to the patient’s audiogram? There is a rough relationship in which speech recognition scores tend to become lower as sensorineural hearing loss worsens, but it is hardly predictive and is complicated because the notion of “better” and “worse” on an audiogram often involves considering both the amount and configuration of the loss. Some guidance was provided by 98% lower cutoff values for PB-50 test scores associated with various amounts of cochlear hearing loss among patients younger than 56 years of age (Yellin, Jerger, & Fifer 1989). However, those cutoff values based on PB-50 test scores do not seem applicable to scores obtained with more commonly used tests such as CID W-22 (Gates, Cooper, Kannel, & Miller 1990). Dubno, Lee, Klein, Matthews, and Lam (1995) reported 95% lower cutoff values for the NU-6 test (Auditec version) as a function of the patient’s three-frequency PTA. These lower cutoff values are shown for both 50- and 25-word lists in Fig. 8.5. Fig. 8.5 Lower 95% confidence limits for PBmax when obtained using the NU-6 test (Auditec) as a function of the degree of hearing loss. (Based on data by Dubno, Lee, Klein, Matthews, and Lam 1995.) The percentage of words that are repeated correctly depends on more than just the patient’s speech recognition ability. It also depends on the conditions of the test, such as the level at which the words are presented. The graph in Fig. 8.5 is called a performance-level (PL) function because it shows how the patient’s speech recognition performance (in percent correct on the y-axis) depends on the level of the test materials (along the x-axis). The more traditional term, performance-intensity (PI) function, is often used as well. The PL function is a type of psychometric function, which shows performance (in this case speech recognition) as a function of some stimulus parameter (in this case the speech level). It is often called a PL-PB or PI-PB function when phonetically or phonemically balanced (PB) words are used. The PL function in Fig. 8.6 is from a normal-hearing individual. Notice how his speech recognition scores are low when the words are presented at very soft levels, and that the scores improve as the intensity increases. In this case, a maximum score of 100% is eventually achieved when the intensity reaches a level of 30 dB HL. The maximum score on the PI-PB function is traditionally called PBmax. Notice that the PL function flattens (or becomes asymptotic) as the intensity is raised above the level where PBmax is found. This plateau establishes the fact that PBmax has been reached, because it shows that the score does not improve any more when the intensity continues to be raised. (This is a moot point when 100% is reached, but it is a real issue when PBmax is lower than 100%.) This maximum score is used to express a patient’s speech recognition performance. It is assumed that a patient’s “speech recognition score” refers to PBmax unless otherwise indicated. Thus, we must be confident that PBmax has been obtained (or at least approximated).
 Thresholds for Speech
Relation to the Pure tone Audiogram
Materials for SRT Testing
Measuring the Speech Recognition Threshold
Instructions and Familiarization
Recorded versus Monitored Live-Voice Testing
Carrier Phrase Use for SRT Testing
The Initial (Ballpark) SRT Estimate
Testing Techniques
 x
x
 ” or “x
 x
x x
x ” or “xxx

 ”).
”).
Testing by Bone-Conduction
Comfortable and Uncomfortable Loudness Levels for Speech
 Assessing Speech Recognition
Traditional Test Materials
Speech Recognition Testing
Performance-Level Functions
Stay updated, free articles. Join our Telegram channel

Full access? Get Clinical Tree


