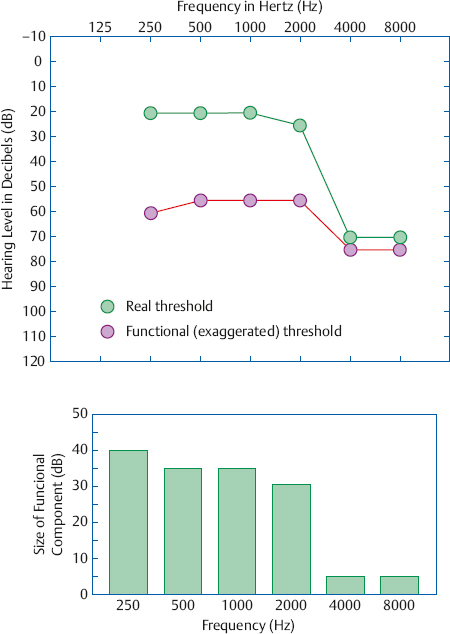
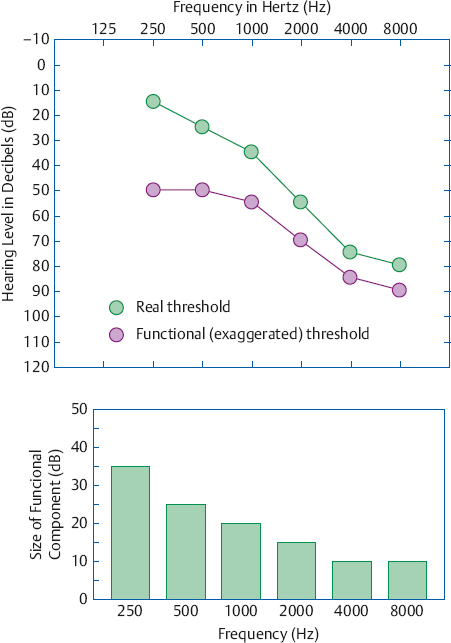
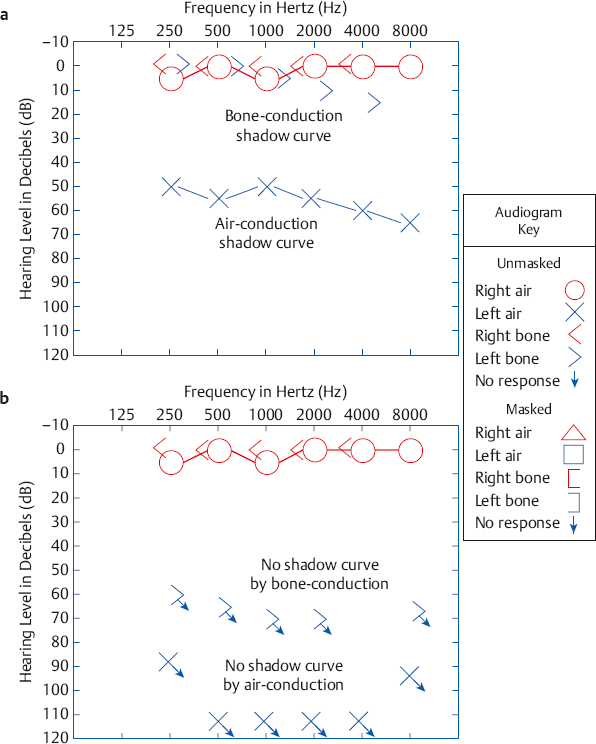
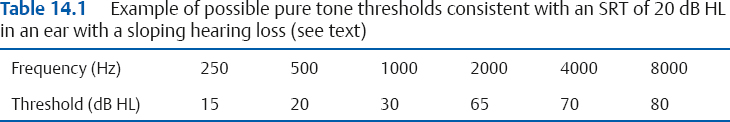
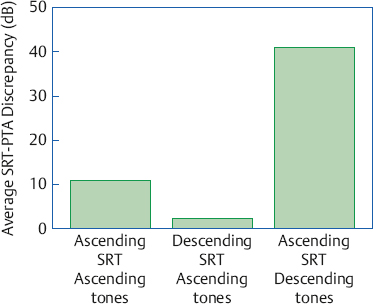
14 Nonorganic Hearing Loss Routine audiological tests rely on the patient’s behavioral responses to the stimuli presented to her. If she can hear a tone as soft as 0 dB HL, then she will respond to tones down to 0 dB HL, and if the softest tone she can hear is 50 dB HL then she will respond to all tones down to 50 dB HL. Her thresholds represent her actual hearing sensitivity, and any hearing loss revealed by these thresholds will be due to some kind of real, physical disorder or anomaly. Here we may say that the hearing loss is of organic origin because it is the result of anatomical and/or physiological abnormalities. In contrast, another patient might not respond as directed. Instead of responding to the softest sound she can hear, she might wait until the sounds are well above her actual threshold before she is willing to volunteer a response. For example, she might hold off on responding until a tone reaches 55 dB HL even though she could really hear it as low as 0 dB HL. In this case, her 55 dB HL threshold gives the false impression that she has a hearing loss even though she is actually normal. This exaggerated loss is not due to an organic cause, and may therefore be called a nonorganic hearing loss. Nonorganic hearing losses are also known as functional or exaggerated hearing losses, or pseudohypacusis, and these terms will be used interchangeably here. A functional loss involves questionable test results. In operational terms, a nonorganic hearing loss is identified on the basis of observable discrepancies in the audiological tests and/or between the patient’s behavior and the test results, that are not accounted for by an organic disorder (Ventry & Chaiklin 1965). On the other hand, a functional loss is not indicated by test results that are better than expected from the patient’s complaints, or when subjective problems cannot be verified by routine audiological tests. In fact, subjective complaints that are not accounted for by the audiogram may suggest the possibility of abnormalities requiring more advanced diagnostic efforts (e.g., Saunders & Haggard 1989; Baran & Musiek 1994). Not all patients with exaggerated hearing losses actually have normal hearing. In fact, most adults with functional impairments have at least some degree of underlying organic hearing loss (Chaiklin & Ventry 1963; Coles & Priede 1971; Coles & Mason 1984; Gelfand & Silman 1985, 1993; Gelfand 1994). For example, a functional patient whose real threshold is 35 dB HL might not respond until 65 dB HL. In this case, 35 dB of the loss is organic (real) and the remaining 30 dB is nonorganic. Hence, we often distinguish between (1) the overall nonorganic loss, which is represented by the patient’s voluntary thresholds, and (2) the functional component or overlay, which is the nonorganic part of the loss. The nonorganic component is simply the difference between the exaggerated thresholds volunteered by the patient and the underlying organic loss. The literature is unclear about the relative incidences of bilateral and unilateral nonorganic hearing loss, but clinical experience suggests that it is more common bilaterally. For example, among 88 patients whose nonorganic losses were eventually resolved, 72% were bilateral cases and 28% were unilateral (Gelfand & Silman 1993). Some possible reasons to explain why bilateral functional losses might be more common are (1) an underlying organic loss is more likely to be experienced in both ears, (2) it is easier to respond the same way for both ears, and (3) the belief that “real” hearing losses “should be” bilateral. On the other hand, sensing a difference between the ears might influence the patient to exaggerate the impairment in only one ear. A loss might be exaggerated in the poorer ear to maximize the benefits that can be derived from the loss in that ear. Alternatively, the patient might feign a loss in the good (or “better”) ear because he (1) believes that hearing losses “should be” bilateral or (2) envisions greater benefits from an impairment in both ears instead of just one. Because functional losses do not have an organic basis they must be due either to psychogenic causes or to malingering or feigning. The psychogenic explanation says the hearing loss is the result of unconscious psychodynamics, and includes such phenomena as hysterical and conversion reaction deafness. It implies the patient actually experiences impaired hearing and he truly believes the hearing loss is real. Malingering means the patient is faking a hearing loss he does not have, or is falsely exaggerating whatever amount of loss he actually does have. Malingering may be motivated by financial or other benefits that the patient associates with a hearing loss. Financial gain is often an issue with injury-related lawsuits, and with veterans’ and workers’ compensation claims. Here, worse hearing translates into larger legal settlements, pensions, and/or compensation payments. The other real or perceived benefits to be derived from an exaggerated hearing loss may be summarized as the desire for real or perceived special attention, preferential treatment, considerations, and support in a host of social and occupational life situations. Goldstein (1966) argued that exaggerated hearing losses are due to malingering because they cannot meet the criteria for a psychogenic disorder, which must include alleviation of the nonorganic hearing loss when the underlying psychiatric disorder is resolved. Others argued that we cannot ascribe a patient’s functional loss to malingering (unless he admits feigning) because we really do not know why his responses are exaggerated, which may well include a psychogenic cause (Hopkinson 1967, 1973; Chaiklin & Ventry 1963; Ventry 1968). This is one of the reasons for using nonjudgmental, descriptive terms such as functional hearing loss. Noble (1978, 1987) has challenged the concept of “functional hearing loss” as a clinical entity and the appropriateness of the term itself to describe the exaggeration of thresholds during compensation evaluations. He argued that we are dealing with faking that is related to a process that is legalistic and adversarial rather than clinical, and that is often itself unfair. This point of view makes sense, but it does not explain why patients should have exaggerated losses when monetary issues are not involved. Reported cases of psychogenic hearing loss are noticeably sparse. For example, Ventry (1968) presented only one case to make his point, and Coles (1982) reported that he might have seen three cases, but was not certain. The author came across only one reasonably convincing case of psychogenic hearing loss among all the patients seen in a Veterans Administration audiology program over ~ 15 years. This patient had psychiatric diagnoses that included an infantile personality and conversion reactions. He had various somatic disorders that responded to placebo treatments, among which was a functional hearing loss that he insisted was helped by a hearing aid. The intangible nature of other people’s motivations and the desire to be fair-minded makes it hard to conclude with absolute certainty that psychogenic cases of nonorganic hearing loss do not exist. However, it appears that these cases are few and far between. Even in the absence of a deeply rooted psychogenic cause, it is still reasonable to ask what psychological factors are associated with nonorganic hearing loss. Most of what we know about the personality and other psychosocial characteristics of individuals with nonorganic hearing loss is based on a fairly small number of studies reported during the 1940s through the 1960s. These culminated with the authoritative and well-known study by Trier and Levy (1965), who compared adult male veterans with functional losses and those with organic hearing impairments. The subjects with nonorganic hearing loss had an average intelligence quotient (IQ) of 98.7, which was slightly but significantly lower than the average IQ of 106.8 in the organic group. Compared with those with organic losses, the functional group were found to exhibit more emotional disturbances, nervousness and submissiveness, hypochondria and preoccupation with their hearing problems, tinnitus, tendencies to exploit their physical symptoms, and variability in the manifestation of the effects of their hearing losses. In addition, the individuals in the functional group earned $1300 less per year than their organic loss counterparts, and their mean family incomes were $2000 per year lower. This reflects a major economic difference between the two groups because the median regional family income at that time was about $7000. Trier and Levy hypothesized that the patients with nonorganic hearing loss experienced general feelings of inadequacy, which included the belief that they were incapable wage earners. These beliefs led to exaggeration of their impairments for monetary compensation to help provide for their families, and doing so caused them to suffer a loss of self-esteem. Nonorganic hearing losses in children have been described by many investigators (Dixon & Newby 1959; Barr 1963; Rintelmann & Harford 1963; Ross 1964; Berger 1965; Lumio, Jauhiainen, & Gelhar 1969; McCanna & DeLupa 1981; Veniar & Salston 1983; Aplin & Rowson 1986, 1990; Bowdler & Rogers 1989; Pracy, Walsh, Mepham, & Bowdler 1996). Non-organic hearing loss tends to occur in children who fail hearing screening tests at school, but it has also been reported following incidents of head trauma (Radkowski, Cleveland, & Friedman 1998) and in some cases of child abuse (Riedner & Efros 1995). Many of these children do not show any evidence of hearing impairment except for the failed screening tests in school and functional losses on subsequent audiological evaluations, and for the most part their nonorganic hearing losses are usually resolved over time. Different samples of children with nonorganic hearing loss have been described as having normal intelligence and academic performance (e.g., Dixon & Newby 1959); normal intelligence but poor educational achievement (e.g., Barr 1963); and widely ranging (and below-average mean) intelligence with a substantial rate of poor academic achievement (e.g., Aplin & Rowson 1990). These observations suggest that children with nonorganic hearing loss can vary widely in terms of their intellectual abilities and academic performance. Financial rewards are clearly not the motivation for nonorganic hearing loss in children. Instead, children with pseudohypacusis are usually motivated by the secondary gains of having a hearing impairment. For example, a hearing loss can serve as a justification for underachievement at school, and to lighten the academic demands made upon him by teachers and parents, and can also provide a means to obtain needed attention and emotional support at home or school (Lumio et al 1969; Aplin & Rowson 1986). These gains become apparent to the child who has failed a routine hearing screening test. Ross (1965) recommended that actual hearing losses should be identified as soon as possible, preferably during the screening process before referrals are made, to avoid undue attention and concern that could precipitate pseudohypacusis in children who are actually normal. The majority of children with nonorganic hearing loss do not appear to have significant emotional problems, but this certainly does occur. There is also evidence of psychodynamic origins in at least some cases of childhood nonorganic hearing loss (e.g., Hallewell, Goetzinger, Allen, & Proud 1966; Lumio et al 1969; Broad 1980). Several modified testing methods can help obtain improved thresholds from children with nonorganic losses. Ross (1964) modified an earlier method used by Dixon and Newby (1959) to arrive at the variable intensity pulse count method. The child’s task is to count the number of tones that are heard. Groups of tones are then presented, composed of various numbers of tones at different levels. Testing begins above the child’s admitted threshold. Once she is responding properly, the tone levels are manipulated until finding the lowest level at which the child is able to respond appropriately three times in a row. The success of this procedure depends on presenting it to the child as a test of counting rather than hearing. In the Yes-No Method (Miller, Fox, & Chan 1968; Frank 1976) the child is told to immediately say “yes” whenever she hears a tone and “no” whenever she does not hear one. The tones are then presented using an ascending technique. Any response associated with the presentation of a tone indicates that the child heard the tone, regardless of whether she says “yes” or a “no.” This technique depends on the immaturity of the child’s logic, which allows her to say “no” in response to a supposedly inaudible tone without realizing that any response demonstrates that the tone was actually heard. Rintelmann and Harford (1963) reported that children with non-organic hearing losses could be identified by atypical findings on the SAL test (Chapter 9). Here, the patients’ voluntary thresholds presented a picture of sensorineural hearing loss, but their SAL test results were of the type found with normal hearing or conductive hearing losses. Patients with nonorganic hearing loss have functional components that are related to the configuration of the underlying, organic thresholds (Coles & Mason 1984; Gelfand & Silman 1985, 1993; Gelfand 1993). This relationship is seen most clearly in patients who actually have precipitously sloping sensorineural losses, as illustrated in Fig. 14.1. Notice how the functional components are relatively large for the frequencies up to 2000 Hz, where the organic thresholds are relatively low, and become abruptly smaller beginning at 4000 Hz, where the organic thresholds get abruptly worse. Similarly, functional patients who really have sloping losses tend to have nonorganic components that become progressively smaller as their real thresholds become progressively worse (Fig. 14.2). However, functional components and underlying organic thresholds are not related in patients who actually have normal hearing and mild losses. Patients with functional loss seem to use an internalized reference level or “anchor” that has a certain loudness level, which we will call the “target.” It appears that they will not respond to a test stimulus until its loudness level reaches the target (Gelfand & Silman 1985, 1993; Gelfand 1993). The inverse relationship between the degree of organic loss and the size of the functional component at each frequency appears to be produced by the following mechanism: Because of loudness recruitment, test tones reach the target at lower sensation levels (SLs) for frequencies where the underlying organic thresholds are higher (worse), and at higher SLs where the underlying thresholds are lower (better), within the same ear. This occurs because loudness recruitment is related to the amount of sensorineural loss (Chapter 10). Larger functional components are more common at lower frequencies and smaller ones are more common at higher frequencies because most sensorineural losses tend to worsen with increasing frequency. These relationships cause the exaggerated audiograms of patients with underlying high-frequency losses to appear relatively flattened (Coles & Mason 1984). Functional components tend not to be systematically related to the underlying organic thresholds in patients who really have normal and mildly impaired hearing because these patients do not experience substantial loudness level differences between test frequencies. Fig. 14.1 Example of how the configuration of functional components is related to the configuration of the underlying sensorineural hearing loss sloping precipitously at 4000 Hz. Fig. 14.2 Example of how the configuration of functional components is related to the configuration of the underlying sloping sensorineural hearing loss. Even though the configurations of functional components are consistently related to the configurations of the underlying losses, patients vary widely in terms of the absolute sizes of their functional components. This variability is probably influenced by differences between patients with respect to (1) the loudness level used as the target, (2) the range between the organic threshold and the highest stimulus level the patient is willing tolerate, and (3) the amount of recruitment. The first factors that raise the index of suspicion for a possible nonorganic hearing loss involve real-world considerations about who referred the patient and why the evaluation is being done, rather than his clinical behavior or complaints. These include referrals made by attorneys, insurance companies, or compensation boards. Also included are referrals that are in any way related to legal issues, accidents, employment and/or work environment issues, or any form of claim that deals with any kind of pension or compensation. The characteristics of patients with functional hearing loss are well established in the audiologic literature (Chaiklin & Ventry 1963; Hopkinson 1973; Coles 1982). Many of these patients exaggerate the behaviors and complaints that they associate with people who have real hearing problems. Examples include leaning forward, turning the head to favor the “better side,” cupping a hand over one ear to make sounds louder, and obviously gazing at the talker’s mouth to demonstrate a reliance on lipreading. Some patients talk loudly in an exaggerated effort to hear their own voices. Many functional patients fail to have the speech and voice aberrations associated with long-standing hearing losses, but the same behavior also occurs in many patients with organic impairments. Functional patients may also constantly ask for repetition and clarification, or even insist on having things written for them. Vague complaints about hearing problems, excessive needs to rely on lipreading, and a lack of knowledge about the use of hearing aids by a patient who “used to own one” also raise the index of suspicion for pseudohypacusis. One might observe the patient conversing effortlessly with others in the waiting room even though his audiometric thresholds would make this impossible. Few adult feigners make this mistake when the clinician is present unless they are caught off guard. However, it is not uncommon for children with nonorganic hearing loss to carry on a conversation in an informal setting but not in a test situation. Two caveats should be mentioned about the behavioral manifestations of nonorganic hearing loss. First, even though many patients are caricature-like in their portrayal of these behaviors, there are many others whose deportment typifies any patient with a real hearing impairment, or who play the part with practiced subtlety. Subtlety should not be surprising because, after all, patients do talk to other patients and are perfectly capable of reading an audiology textbook. Second, the diagnosis of pseudohypacusis depends on test results. Behavioral signs of exaggeration raise the index of suspicion for a nonorganic hearing loss and provide support for any test findings that are obtained, but they do not indicate a functional loss themselves. Several signs of nonorganic hearing loss are obtained during the routine audiological evaluation that is administered to almost every patient. The fact that functional impairments can be revealed by routine testing is important because the clinician does not have to suspect a patient of exaggerating his hearing loss before she is able to test for it. Acoustic reflex tests are covered later along with other physiological measures, even though they are most certainly part of the routine evaluation battery. Almost all patients who have normal hearing and organically based hearing losses will occasionally respond even though no tone has been presented. These responses that are made during the silent periods between tone presentations are called false-positive responses or false alarms. False alarms can be disturbing to the audiologist because they make it more difficult to establish the patient’s threshold; however, they do demonstrate that the patient is highly motivated to hear every possible signal, no matter how faint it might be. Patients with functional losses obviously do not share this desire and often fail to elicit any false alarms. For example, Chaiklin and Ventry (1965b) found that false alarms were elicited by 86% of patients with real hearing losses compared with only 22% for those with pseudohypacusis. They recommended that pure tone testing should include 1-minute “silent periods,” during which no stimuli are presented, as a check for false alarms. One should consider the possibility of nonorganic hearing loss if the patient does not produce any false alarms, especially during these rather long silent intervals. Pure tone thresholds are usually repeatable within a range of ± 5 dB, and test-retest reliability is certainly expected to be within ± 10 dB. Thresholds that vary by 15 dB or more from test to retest are associated with a nonorganic hearing loss (Chaiklin & Ventry 1965b). On the other hand, good test-retest reliability does not rule out a nonorganic hearing loss because many functional patients are able to produce thresholds that are quite reliable (Berger 1965; Shepherd 1965). Recall that cross-hearing means that the test signal is actually heard by the opposite ear instead of by the ear being tested. With this in mind, consider the audiogram in Fig. 14.3a, which is from a patient who is unilaterally deaf in the left ear and has normal hearing in the right ear. The unmasked thresholds for the left ear are actually due to cross-hearing in the right ear, and are known as a shadow curve. The hearing levels of the shadow audiogram are in the 50 to 65 dB HL range because they depend on interaural attenuation and the bone-conduction thresholds of the better ear. In this case, the right ear has bone-conduction thresholds of 0 dB HL and interaural attenuation is in the 50 to 65 dB range. Hence, the right cochlea is able to hear the tones presented to the left ear by air-conduction at 50 to 65 dB HL. The shadow curve disappears when the deaf left ear is retested with masking noise in the opposite ear.1 Fig. 14.3b shows the unmasked audiogram of a patient with nonorganic unilateral deafness in the left ear and normal hearing in the right ear. There is no shadow curve because the patient refuses to respond to any sound being presented to the left ear, no matter how intense it might be. He is unaware that the normal right ear would have started hearing these tones by the time they reached ~ 50 to 60 dB HL in a genuinely deaf left ear, and it is the absence of the shadow curve that reveals the nonorganic origin of the loss. Similarly, a real unilateral loss has a shadow curve for bone-conduction. However, the “no response” symbols for bone-conduction show that this functional patient would not respond when the bone vibrator was on the left side of his head, in spite of the fact that little interaural attenuation occurs for bone-conduction. 1 If these points are not clear, the student should review the material on crossover, cross-hearing, interaural attenuation, and masking in Chapters 5 and 9. Fig. 14.3 (a) Shadow curves occur for air-conduction and bone-conduction in the unmasked audiogram of a patient who is completely deaf in the left ear and normal in the right ear. (b) Shadow curves are missing in the unmasked audiogram of a patient who is feigning unilateral deafness in the left ear. Functional patients often give a variety of atypical responses to spondee words during speech recognition threshold (SRT) testing (Chaiklin & Ventry 1965b). They often miss spondee words previously repeated correctly at lower hearing levels. For example, a patient might not repeat “farewell” at 55 dB HL even though she could repeat that word at 45 dB HL earlier during the same test. They also give many half-word responses to the spondee words (e.g., “cow” for “cowboy,” or “well” for “farewell”), and even monosyllabic word responses that are unrelated to the spondee that was presented (e.g., “ball” for “armchair”). Functional patients may also obtain higher than expected speech recognition scores when tested at low sensation levels (SLs) relative to their admitted thresholds (Gold, Lubinsky, & Shahar 1981). This suggests a nonorganic hearing loss because high speech recognition scores are not expected until the presentation level reaches ~ 30 dB SL or even higher (Chapter 8). For example, suppose a patient whose SRT is 50 dB HL is able to score 92% correct for words presented at 60 dB HL, which is only 10 dB SL (re: SRT). Such high scores rarely occur at only 10 dB SL. This implies that 60 dB HL is more than just 10 dB above the SRT, and for this to be true the patient’s real SRT must be lower (better) than 50 dB HL. The pure tone average (PTA) of the 500, 1000, and 2000 Hz thresholds and the SRT normally agree within reasonable limits. In contrast to the agreement between the SRT and PTA in patients with real hearing losses, Carhart (1952) observed that the SRT is often better (lower) than the PTA in patients with functional losses. An SRT-PTA discrepancy (or PTASRT discrepancy) of 12 dB or more is considered to indicate a nonorganic hearing loss (Chaiklin & Ventry 1965b). For example, if a patient has a PTA of 47 dB HL and an SRT of 30 dB HL, he would be considered to have a nonorganic hearing loss because his SRT is better than his PTA by ≥ 12 dB. A significant SRT-PTA discrepancy has been shown to be the best audiometric indicator of functional losses (Ventry & Chaiklin 1965). One must be mindful of the shape of the audiogram when making the SRT-PTA comparison. Suppose a patient has an SRT of 20 dB HL and the pure tone thresholds given in Table 14.1. The 2000 Hz threshold is clearly out of line with the thresholds at 500 and 1000 Hz. Hence, the SRT should be compared with the two-frequency PTA of 500 and 1000 Hz, which is (20 + 30)/2 = 25 dB HL. The SRT-PTA discrepancy is only 5 dB, which is perfectly acceptable. In contrast, the three-frequency PTA is (20 + 30 + 65)/3 = 38 dB HL. This results in an 18 dB SRT-PTA discrepancy, giving the false impression of a non-organic hearing loss. This example shows that the two-frequency PTA should also be considered before labeling a patient as functional. In fact, it is even occasionally appropriate to compare the SRT to the single frequency that has the best tonal threshold, which is usually 500 Hz but can be 250 Hz (Gelfand & Silman 1985, 1993; Silman & Silverman 1991). The size of the SRT-PTA discrepancy also appears to be affected by how the SRT and pure tone thresholds are tested. Exaggerated losses are more clearly identified (i.e., the discrepancy is bigger) when the SRT is obtained with an ascending testing method compared with a descending method (Conn, Ventry, & Woods 1972; Schlauch, Arnce, Olson, Sanchez, & Doyle 1996). This difference can be seen by comparing the first two bars in Fig. 14.4. Schlauch et al (1996) also demonstrated that the SRT-PTA discrepancy can be enhanced considerably by using a descending method for pure tones with an ascending method for the SRT (third bar in Fig. 14.4), and they recommended this approach as a screening test for functional loss. The descending pure tone procedure involves (1) presenting the first tone at each frequency at high level (90 dB HL), (2) working downward in 10 dB steps, and (3) then following the standard audiometric method to arrive at a threshold (see Chapter 5). The classical literature described nonorganic hearing loss as “saucer-shaped” or “flat,” but it has been shown that no particular audiometric configurations are characteristic of functional losses (Chaiklin, Ventry, Barrett, & Skalbeck 1959; Chaiklin & Ventry 1965a). On the other hand, the functional components of exaggerated audiograms are related to the configuration of the underlying, organic thresholds (Coles & Mason 1984; Gelfand & Silman 1985, 1993; Gelfand 1993). This relationship is seen most clearly in patients who actually have precipitously sloping sensorineural losses, as illustrated in Fig. 14.1. Notice how the functional components are relatively large for the frequencies up to 2000 Hz, where the underlying thresholds are relatively good, and become abruptly smaller beginning at 4000 Hz, where the organic thresholds get abruptly worse. Similarly, functional patients who really have sloping losses tend to have nonorganic components that become progressively smaller as their real thresholds worsen with increasing frequency (Fig. 14.2). In general, the functional components are (1) bigger at the lower frequencies where the organic thresholds are better, and (2) smaller at the higher frequencies where the organic thresholds are worse. As explained earlier, this appears to happen because patients with functional impairments use an internalized reference level or “anchor” that has a certain loudness level; they will not respond to a test tone (or other test stimulus) until its loudness level reaches that of the anchor (Gelfand & Silman 1985, 1993; Gelfand 1993). Within an ear, functional components are smaller at the frequencies where the actual losses are worse and larger at the frequencies where the real thresholds are better because loudness recruitment is related to the degree of hearing loss (Chapter 10). As a result, the majority of functional components tend to be wider at lower frequencies and narrower at higher frequencies simply because high-frequency losses are so common. Fig. 14.4 The size of the discrepancy between the speech recognition threshold (SRT) and pure tone average (PTA) depends on whether ascending or descending methods were used to arrive at the SRT and the pure tone thresholds. (Based on data of Schlauch, Arnce, Olson, Sanchez, and Doyle [1996].)
 Nonorganic Hearing Loss in Adults: Motivating Factors
 Nonorganic Hearing Loss in Children
 Relation to Organic Hearing Thresholds
 Clinical Signs and Manifestations of Nonorganic Hearing Loss
Presenting and Behavioral Manifestations of Nonorganic Hearing Loss
Indicators of Nonorganic Hearing Loss in the Routine Evaluation
Lack of False Alarm Responses
Threshold Variability
Absence of a Shadow Curve
Atypical Speech Audiometry Responses
SRT-PTA Discrepancy
Audiogram Configuration
Stay updated, free articles. Join our Telegram channel

Full access? Get Clinical Tree


