Screening: Relationship to Diagnosis and Therapy
M. Cristina Leske
Barbara S. Hawkins
Leslie Hyman
Päivi H. Miskala
OVERVIEW
Although primary prevention is directed to averting the initial occurrence of disease, for example, through immunizations, secondary prevention aims to improve outcome of disease by early detection and treatment.1 Screening, typically considered as secondary prevention, seeks to detect disease at a preclinical stage with the expectation that early treatment will deter disease progression.
DEFINITIONS
Screening has been defined as the presumptive identification of unrecognized disease or defect by the application of tests, examinations, or other procedures that can be applied rapidly. Screening tests sort out apparently well persons who probably have a disease from those who probably do not.2 By this definition, screening is conducted on asymptomatic, presumably healthy individuals who are tested to determine whether they have high or low probabilities of disease. The results of screening, therefore, are tentative, and neither positive nor negative findings can be considered conclusive. Positive screening results do not necessarily imply disease; they only indicate the need for additional evaluation, typically by more extensive and more expensive methods. Similarly, negative screening results cannot be interpreted as conclusive evidence of the absence of disease.
Screening activities can be classified as “mass” or “selective.”3 Mass screening, or population-based screening, is provided on a large scale to unselected populations, such as visitors to health fairs, shopping centers, or other ad hoc settings. Selective screening, or high-risk screening, is limited to persons who have already been identified as being at an increased risk for a particular disease. Tools suitable for mass screening are typically less invasive and less expensive than screening tools to be applied in select population settings.4
Screening may be performed on volunteers in different community settings or on patients seeking health care for unrelated symptoms. Identifying previously unrecognized disease by screening among patients consulting for an unrelated disease (e.g., glaucoma screening of a patient consulting for myopia) is sometimes defined as case finding. When implementing a screening program, it is appropriate to provide follow-up evaluation for persons with positive screening tests. Screening is more likely to identify cases with a long preclinical phase of the disease than cases with a short preclinical phase.5
CRITERIA
Screening raises ethical, clinical, as well as scientific issues, and the decision to screen for a particular disease must be evaluated carefully. Several general principles have been proposed to assist in this evaluation.3,6,7,8,9 To be suitable for population-based screening, a disease should meet the following criteria:
The disease should have an important effect on morbidity or mortality.
The disease should have a sufficiently high prevalence within the target population to justify screening.
The disease should have a natural history that is adequately understood.
Treatment of the disease should be acceptable, effective, and available.
The outcome of disease would be better if treatment were initiated before the usual time of diagnosis.
Screening tests should be acceptable, reliable, and valid (i.e., high sensitivity and specificity) and have a reasonable cost.
The cost of screening and subsequent follow-up evaluation and care should be less than the cost of providing treatment and other services at the usual time of diagnosis.
The rationale for each criterion is discussed below.
Morbidity and Mortality
A condition merits screening only if it has an important public health impact and is serious enough to affect the quality or quantity of life.
Prevalence
Ideally, screening should be aimed at detecting relatively common conditions within the population targeted. As the prevalence of a condition increases in the target population, screening yields more cases and the cost per case detected decreases.9
Natural History
Knowledge of the course of the disease process is essential for screening.10 In some conditions, there is a marked overlap in measurements between diseased and nondiseased persons, and the diagnosis is not clear cut. To be suitable for screening, a disease must have a clearly recognized biologic onset and a diagnosis that can be confirmed by accepted criteria. The disease should also have a latent, asymptomatic stage before it becomes clinically apparent (see Fig. 1). The presence of this asymptomatic stage will permit detection and intervention before the usual time of diagnosis. The time lapse between early detection by screening and the usual time of diagnosis is known as the lead time.8,11
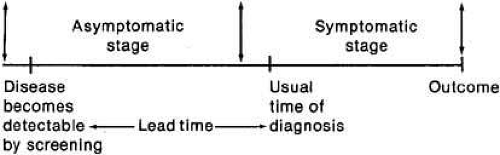 Fig. 1 Stages in the natural history of disease and lead time of screening. |
Effectiveness and Availability of Treatment
Screening is of value when the disease can be effectively treated or controlled. With incurable hereditary conditions, control of disease may be possible with counseling.12
In addition to being effective, the treatment must be accessible. Screening is justified only when facilities for diagnosis and treatment are available to persons with positive screening results. A major issue to emphasize, because it is often overlooked, is that resources for effective follow-up must be an integral part of a screening program.
Better Outcome with Early Treatment
The rationale for screening is that early detection and treatment will improve disease outcome. This goal can be attained only if intervention in the asymptomatic stage (Fig. 1) produces better results than when treatment is begun after the usual time of diagnosis.
Screening Tests
An important prerequisite for a screening test is its acceptability to the person being screened and to those performing and interpreting the test. Other requirements are simplicity, so the test can be easily administered and reliability or reproducibility, so that consistent results may be expected on repeated measurements by the same or a different observer. An important requirement is test validity (i.e., the ability to correctly identify diseased and nondiseased persons).1,4 Validity is measured by sensitivity and specificity (see Table 1). Sensitivity is the ability of a test to identify cases (i.e., diseased persons) correctly. Thus, a screening test with 90% sensitivity will be positive in 90 of 100 cases screened. Specificity is the ability of a test to identify noncases (i.e., nondiseased persons) correctly. Thus, a test with 95% specificity will be negative in 95 of every 100 noncases tested. In the example given in Table 1, Test A has a 70% sensitivity and 80% specificity.
TABLE 1. Example of Sensitivity, Specificity, and Predictive Values of a Screening Test, Assuming an Eye Disease with a Prevalence of 10% in the Target Population | |||||||||||||||||||||||
|---|---|---|---|---|---|---|---|---|---|---|---|---|---|---|---|---|---|---|---|---|---|---|---|
| |||||||||||||||||||||||
Sensitivity and specificity should always be evaluated together. A test with high sensitivity will detect most of the cases and will thus have few false-negative results. However, if the same test has low specificity, many false-positive results will occur and lead to overreferrals. In contrast, a test with low sensitivity and high specificity will have many false-negative results but few false-positive results.
Ideally, a test should have high sensitivity and high specificity, but this goal is difficult to achieve in practice. Because the test results of diseased and nondiseased persons usually overlap, some cases have low (negative) test values and some noncases have high (positive) values (see Fig. 2). The specific test value chosen as a cutoff to define a “positive” screening result will affect both the sensitivity and the specificity. If a low cutoff value is chosen, the sensitivity will be high, because most cases will have “positive” screening results and will be referred for further diagnostic examinations. The specificity, however, will be low because many noncases will also be referred. Increasing the test value chosen as “positive” to trigger referral will increase the specificity, at the expense of the sensi-tivity. The decision to select a specific test value to determine referral depends on the disease being detected. If the failure to detect cases has serious consequences, for example, nondetection of malignant disease, a low test value should be chosen for referral, thus increasing sensitivity even though the specificity will decrease. If an excessive number of overreferrals is unacceptable, for example, when follow-up of screening requires invasive procedures, a high screening test value should be chosen for referral to increase specificity, although the sensitivity will decrease.
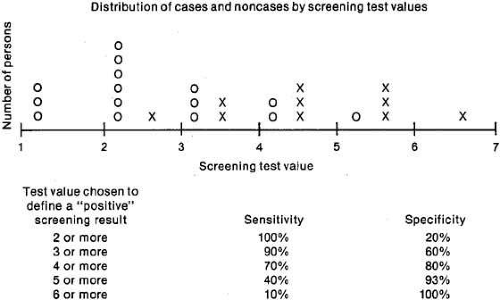 Fig. 2 Sensitivity and specificity at different screening test values (0, noncases; X, cases). |
The evaluation of tests also includes “predictive values.” Sensitivity and specificity evaluate the ability of a test to separate cases correctly from noncases and are measures of validity, but predictive values are not. The predictive value of a positive test refers to the percentage of cases found among all those with positive tests (Table 1). In the example in Table 1, where Disease X had a prevalence of 10%, 250 persons had positive tests and 70 truly had the disease, resulting in a positive predictive value of 28% for Test A in this population. The predictive value of a negative test is defined as the percentage of noncases found among persons with negative tests (Table 1). Therefore, if 720 of 750 persons with negative tests were noncases, the negative predictive value was 96%. Predictive values depend not only on sensitivity and specificity of the test, but also on the prevalence of disease in the population screened. As the prevalence of the disease increases, the positive predictive value increases (see Table 2). Therefore, false-positive results are reduced when screening is performed in populations where the disease is common; conversely, screening leads to a large number of overreferrals when carried out in populations where the disease is rare. For this reason, the cost per case detected increases when the population screened has a low prevalence of disease.
TABLE 2. Positive Predictive Values by Disease Prevalence at Selected Levels of Sensitivity and Specificity | |||||||||||||||||||||||||||||||||||||||||
|---|---|---|---|---|---|---|---|---|---|---|---|---|---|---|---|---|---|---|---|---|---|---|---|---|---|---|---|---|---|---|---|---|---|---|---|---|---|---|---|---|---|
| |||||||||||||||||||||||||||||||||||||||||
TWO-STAGE SCREENING
Sometimes a screening program is multiphasic, that is, involves a series of sequential tests.4 Usually, an initial screening test that is inexpensive and noninvasive is performed first; then those with positive results are retested using a more accurate test, which is typically more expensive and/or more invasive.4 In this situation, sensitivity and specificity of the two screening tests can be combined and used in sequence, being referred to as net sensitivity and net specificity.4 These concepts are illustrated through the example that assumes multiphasic screening for Disease X, first using Test A (see Table 1) and then applying Test B (see Table 3) to the subset that screened positive with Test A.
TABLE 3. Example of Two-Stage Screening, Net Sensitivity and Net Specificity for a Sample Eye Disease X, Based on Screening Test A Followed by Screening Test B | ||||||||||||||||||||||||||||
|---|---|---|---|---|---|---|---|---|---|---|---|---|---|---|---|---|---|---|---|---|---|---|---|---|---|---|---|---|
| ||||||||||||||||||||||||||||
Net sensitivity and net specificity are derived in two stages. Stage 1 evaluates the initial screening test for the total population, as presented for Test A in Table 1. For Stage 2, individuals who tested positive by Test A are rescreened using Test B. In the example, the 250 individuals who tested positive, as in Table 1, would be retested with Test B, which has 90% sensitivity and 90% specificity as indicated in Table 3. To calculate net sensitivity, the numerator is the number of individuals who were identified as true positives (i.e., tested positive and have the disease) by Test B, which is 63 in the example, and the denominator includes the total number of cases (i.e., the sum of true positives and false negatives) in the target population initially screened with Test A, which is 100 in the example. Therefore, net sensitivity is 63% and is lower than the sensitivity of either test, being equivalent to the sensitivity of Test A times the sensitivity of Test B. Net specificity is calculated by defining the numerator as the sum of the true negatives (i.e., tested negative and do not have the disease) identified by Tests A (n = 720) and B (n = 162) and the denominator as the total number of noncases (i.e., a sum of true negatives and false positives) in the population (n = 900), evaluated by Test A. Therefore, the net specificity is 98%, which is higher than the specificity of Test A and Test B, resulting in an overall gain by using the two screening tests. As demonstrated by this example, retesting individuals who initially test positive will increase specificity, thus decreasing the likelihood of over-referrals due to false-positive tests. Positive predictive value also increases by retesting persons in this group, because they have a higher prevalence of the disease.
Cost-Effectiveness
Aside from the purely humanitarian and social benefits of preventing morbidity, the cost-benefit of screening must be evaluated. Although screening may ultimately reduce the public health impact of a disease and bring about economic savings, the screening process itself generates costs. A common problem is the lack of inexpensive tests that can effectively separate cases from noncases. In addition to the resources expended in the testing process itself, these costs include the follow-up and diagnosis of persons with positive tests, as well as the costs of treating all the newly detected cases. The errors in classifying persons as “positives” and “negatives” also have a cost. Besides being subjected to unnecessary diagnostic tests for a condition they do not have, persons with false-positive tests may suffer other undesirable consequences, such as anxiety and worry at being considered a disease suspect. Additionally, costs are incurred by persons with false-negative screening tests, who may derive false reassurance from screening. Thus, screening for eye conditions may be justified if the cost of a screening program and associated services is less than the costs incurred when the disease is detected at the usual time of diagnosis, for example, the costs of providing long-term services for the visually disabled. It is also justified if earlier diagnosis will diminish psychologic and/or other negative consequences associated with the ophthalmologic condition.
APPLICATIONS OF SCREENING
Few conditions meet all the criteria for screening, and the issues related to screening may be different depending on the condition. To illustrate issues related to screening in ophthalmology, the remaining section will focus on glaucoma and amblyopia screening.
GLAUCOMA SCREENING
Primary open-angle glaucoma is a major cause of blindness and visual impairment throughout the world, particularly affecting persons of African descent.13 Because the visual disability caused by glaucoma is knownto be preventable by early treatment, efforts have been made to identify the disease in its asymptomatic stages. To assess the value of these efforts, it is necessary to determine how well the disease meets the criteria required for screening. First, the disease must be defined.
Definitions
The glaucomas are a group of conditions characterized by progressive optic nerve damage.14 Primary open-angle glaucoma occurs in the presence of an open iridocorneal angle and without any apparent cause; the diagnosis is made after other possible types of glaucoma have been excluded. The primary open-angle type of glaucoma is the most frequent among adults of European and African descent and is an important cause of visual disability. The discussion that follows is limited to screening for primary open-angle glaucoma, referred to hereafter as glaucoma, for brevity.
The diagnosis of glaucoma is made in the presence of nerve fiber bundle defects of the visual field, accompanied by structural changes of the optic disc (cupping or excavation), in the absence of other causes. An intraocular pressure over the population mean often, but not always, accompanies the disease. It is well recognized that field defects and disc cupping may occur at any intraocular pressure level. Therefore, glaucoma definitions from large epidemiologic studies are based on the presence of disc and/or field changes and, with few exceptions, do not use specific numerical values of intraocular pressure as a diagnostic criterion.13,14,15,16,17,18,19,20,21,22,23,24,25,26,27,28,29 Glaucoma definitions, however, are not standardized. Some reports distinguish normal tension glaucoma (disc and field changes with intraocular pressure less than or equal to 21 mm Hg) as a subcategory of open-angle glaucoma.22 For the purposes of this discussion, the diagnosis of primary open-angle glaucoma requires characteristic visual field and disc changes in the absence of other possible causes, regardless of intraocular pressure. Persons with pressures over 21-mm Hg, but without disc or field changes, are categorized as having ocular hypertension not glaucoma.30,31
Criteria
Traditionally, the most commonly used method for early identification of glaucoma has been mass tonometry screening, implemented in many community settings. This approach, however, has limitations, and its effectiveness has long been in question,32,33,34,35,36,37,38,39 thus leading to the search for better screening methods. The rationale for developing new methods and approaches to population screening rests on the assumption that detecting undiagnosed glaucoma is a desirable public health measure. To evaluate the validity of this assumption, a discussion of the criteria to justify screening, as applied to glaucoma, follows.
PUBLIC HEALTH IMPACT
Glaucoma is a leading cause of blindness worldwide and is among the three leading causes of blindness in the United States, being the major reason for blindness registration among the African-American population.40 Although precise data are difficult to obtain, over 2 million Americans were estimated to have glaucoma in 2003 and about 90,000 were thought to be blind from the disease.41 Available sources suggest that glaucoma is responsible for 11% to 13% of existing blindness,42,43 a frequency that increases to over one-fourth among persons of African origin.44,45 In one U.S. study, primary open-angle glaucoma was 6.6 times higher in the black than in the white participants, and glaucoma blindness was seen at an earlier age, markedly increasing with age.43 These and other health care utilization data13 indicate that glaucoma is an important cause of visual impairment, especially among the African-derived population.
When assessing the impact of glaucoma, it is necessary to consider its effects on quality of life, which are largely dependent on the stage of the disease. The quality of life of glaucoma patients has been studied using various methods and approaches. Results consistently show a clear relationship with degree of visual function, particularly visual acuity.46,47,48,49,50 Most glaucoma patients, however, do not have important visual losses until advanced stages of the disease, thus suggesting that early glaucoma may have few or no effects on vision function-related quality of life. Alternatively, it may be that current instruments are not sufficiently sensitive to assess these effects. Using available methods, the impact of glaucoma is mainly evident among patients who have later stages of the disease.
PREVALENCE
The prevalence of glaucoma is best determined by multiple diagnostic methods, including tonometry, ophthalmoscopy, and visual field testing of every survey participant. The first prevalence studies of glaucoma were conducted in Europe, starting in the 1960s, but a large number of studies from various parts of the world have followed (see Table 4).15,16,17,18,19,20,21,22,23,24,25,26,27,28,29 The earlier prevalence studies initially screened for glaucoma with tonometry and sometimes with ophthalmoscopy, with referral for visual field tests being limited to a subset of participants, such as the glaucoma suspects. This two-stage testing protocol leads to an undercounting of cases having ocular tensions below the cutoff for positive tonometry screening. In contrast, recent studies have emphasized methods other than tonometry for preliminary screening and have not included elevated intraocular pressure as a diagnostic criterion. As seen in Table 4, the variations in definitions of elevated IOP or ocular hypertension have led, at least in part, to differences in the prevalence of these conditions.
TABLE 4. Estimated Prevalence of High Intraocular Pressure and Glaucoma Defects at Screening in Population-Based Studies of Persons Older Than 40 Years of Age | ||||||||||||||||||||||||||||||||||||||||||||||||||||||||||||||||||||||||||||||||||||||||||||||||||||||||||||||||||
|---|---|---|---|---|---|---|---|---|---|---|---|---|---|---|---|---|---|---|---|---|---|---|---|---|---|---|---|---|---|---|---|---|---|---|---|---|---|---|---|---|---|---|---|---|---|---|---|---|---|---|---|---|---|---|---|---|---|---|---|---|---|---|---|---|---|---|---|---|---|---|---|---|---|---|---|---|---|---|---|---|---|---|---|---|---|---|---|---|---|---|---|---|---|---|---|---|---|---|---|---|---|---|---|---|---|---|---|---|---|---|---|---|---|---|
| ||||||||||||||||||||||||||||||||||||||||||||||||||||||||||||||||||||||||||||||||||||||||||||||||||||||||||||||||||
When glaucoma is defined on the basis of optic disc changes with field defects, prevalence is around 1% to 2% for white populations aged 40 years and older (Table 4). Prevalences of open-angle glaucoma are markedly higher among black populations,19,20,21,29 especially those reported from studies in the Caribbean Islands of St. Lucia20 and Barbados.21 The prevalence of intraocular pressure over 21 mm Hg is also higher in these areas (Table 4).20,21 All studies show a sharp increase in glaucoma prevalence with age. At 70 years of age, prevalences reach 1% to 3% in white populations13,18,19 and 8% to 14% in black populations.19,20,21 For the purposes of screening, the prevalence of undetected cases is of most interest, since these persons are the target for screening efforts. A consistent result among population studies is that at least half of the cases were newly discovered and were unaware of their glaucoma diagnosis.19,21,24,26,27 Although the degree of severity of these undetected cases is seldom reported or compared to the known cases, they are likely to have an earlier stage of disease than persons with a known glaucoma diagnosis. Supportive evidence is provided by a Swedish study, where glaucoma cases newly identified in a population screening had significantly better visual field status and lower intraocular pressure than self-selected cases.51 If the goal of a screening program is to find all undetected cases, these results indicate that the program must include tests that are sufficiently sensitive to identify early glaucoma.
NATURAL HISTORY
The reasons why open-angle glaucoma develops are not well understood, but age, high intraocular pressure, family history, African ancestry, and myopia have been confirmed as risk factors in many studies. (Hypertension and diabetes are positively associated with elevated intraocular pressure, but a similar relationship to glaucoma has not been shown consistently.13,27,52,53,54) Since high intraocular pressure often accompanies the disease, the distinction between “ocular hypertension” and glaucoma is not always clear cut, leading to a potential overlap between diseased and nondiseased persons.30,31 However, the natural history does not always consist of an orderly progression from an asymptomatic stage with high intraocular pressure to a clinical stage with optic nerve damage and visual field loss. Glaucoma damage may occur at any tension level and is not necessarily preceded by an increase in intraocular pressure.55,56 Although many persons sustain high intraocular pressures without damage, others develop field loss; it is not yet possible to distinguish between persons who will develop damage from glaucoma and those who will not. Ocular hypertensives are at higher risk of optic nerve damage, but the magnitude of this risk is small, estimated at less than 1% per year.13 Incidence was somewhat higher in the black population of the Barbados Eye Study cohort, where 5% of ocular hypertensives developed OAG after 4 years of follow-up.56 Consistent results were found in the Ocular Hypertension Treatment Study, suggesting a higher glaucoma risk in African-American participants.57
A requisite for screening is that the disease have a long preclinical stage to allow early detection. The natural course of glaucoma has been difficult to determine, because under usual standards of practice, all diagnosed patients are given intraocular pressure-lowering treatment. Recently, some information on natural history has been obtained from clinical trials with untreated and treated arms. These data indicate there is large variability in clinical course among individuals, with some patients progressing rapidly and others remaining very stable for years, with and without treatment.58,59 This variability could be explained by the presence of factors related to progression,60 which should be considered when planning patient management.
EFFECTIVENESS AND AVAILABILITY OF TREATMENT
At present, medical and surgical therapies for open-angle glaucoma are based on lowering the intraocular pressure. This approach to treatment has been assumed effective in preventing, but not reversing, visual loss. Until recently, the available evidence on the effectiveness of intraocular pressure–lowering treatment to decrease the progression of glaucoma was mainly derived from nonrandomized studies and from clinical trials including ocular hypertensives.61 To demonstrate effectiveness, it was necessary to have evidence from randomized, controlled clinical trials that compared the frequency of visual field progression in treated and untreated patients with glaucoma. The Collaborative Normal Tension Glaucoma Study compared progression in treated versus untreated eyes of patients with a median IOP of 20-mm Hg or less.58 Although results showed a slower progression in treated eyes after controlling for the effects of cataract, the intent-to-treat analysis revealed no significant difference in visual field progression between groups.58
Definitive evidence on the effectiveness of treatment to slow progression in various types of glaucoma was provided by the Early Manifest Glaucoma Trial.59 The results are highly relevant to population-based screening, because participants in the trial were all previously undetected and largely identified from a specific population. After a median follow-up of 6 years, the progression of patients randomized to treatment was significantly slower than in the untreated control patients, with the overall risk being reduced in half.60 Results were consistent across various patient categories, such as older and younger ages, high and normal tension glaucoma, and eyes with more or less visual field loss at baseline.59
Similar results on the effectiveness of lowering the intraocular pressure to reduce the incidence of glaucoma were reported by the Ocular Hypertension Treatment Study, a large randomized clinical trial.57 In this study, ocular hypertensive patients treated with topical medications experienced conversion to glaucoma at less than half the rate of untreated patients, although the incidence of glaucoma in either group was low. This finding indicates that therapeutic lowering of intraocular pressure can slow disease onset and as such, it has potential for possible primary prevention of glaucoma. There are many caveats to consider, because the prevalence of ocular hypertension in the population is high (Table 4), yet the incidence of glaucoma is low, so that most ocular hypertensives will never develop optic nerve damage. Universal treatment for ocular hypertension is thus not recommended and should be limited to persons at higher risk. Additional information is needed to develop guidelines regarding which individuals with ocular hypertension would benefit most from treatment. The effectiveness of treatment in ocular hypertension relates to primary prevention of glaucoma and not directly to screening, which is a secondary prevention measure aimed to identify undetected glaucoma.
BETTER OUTCOME WITH EARLY TREATMENT
A crucial issue to justify screening is that the outcome must be clearly and significantly improved by bringing the patient under clinical care in the asymptomatic preclinical stage. Evidence to indicate that early treatment improves visual field outcomes was provided by the Early Manifest Glaucoma Trial, based on a highly sensitive method to detect early changes.59 In addition to clinical outcomes, it is important to know whether early detection and treatment of glaucoma lead to improved quality of life for the patient. Because glaucoma treatment is lifelong, the early identification of cases through screening will lead to a prolongation of the usual length of therapy, as compared to no screening. This prolongation has consequences for the patient, because current treatments have a number of side effects and potential complications, which may affect quality of life. Further evaluation is needed of the long-term effects of early treatment on clinical and nonclinical outcomes. The additional costs of extended glaucoma treatment must be considered in the calculation of cost-effectiveness of screening.
Evaluation of Glaucoma Screening Methods
Are acceptable and valid screening tests available? Can these be applied at a reasonable cost? Should they aim to detect very early disease stages (which requires highly sensitive tests), or to detect moderate or more advanced disease (which has more impact on the patient)? These issues are important in glaucoma, which has no symptoms until vision is impaired. The most frequently used screening methods aim to detect different manifestations of glaucoma: (1) tonometry to detect high intra-ocular pressure; (2) assessment of the disc to detect structural optic nerve changes, usually through ophthalmoscopy; and (3) perimetry to detect functional losses of the visual field. An overview of these screening methods is presented in Table 5.
TABLE 5. Comparison of Methods for Glaucoma Screening | ||||||||||||||||||||||||||||||||||||||||||
|---|---|---|---|---|---|---|---|---|---|---|---|---|---|---|---|---|---|---|---|---|---|---|---|---|---|---|---|---|---|---|---|---|---|---|---|---|---|---|---|---|---|---|
| ||||||||||||||||||||||||||||||||||||||||||
INTRAOCULAR PRESSURE
Historically, the most commonly used test in glaucoma screening has been tonometry, although its shortcomings to detect the disease are now well recognized.32,33,34,35,36,37 Ocular tensions are extremely variable, and values are affected by age, time of day, sex, type of tonometer used, central corneal thickness, and many other factors.62,63 Some screening programs have used the Schiotz tonometer because it is less costly and simpler to use, but its measurements are subject to interinstrument and interobserver variations. Furthermore, Schiotz measurements may differ from those obtained with the Goldmann applanation tonometer. Interpretation of the Goldmann readings must consider the potential effects of central corneal thickness, because persons with thick corneas may have artifactually high readings and the reverse may occur in those with thin corneas.63,64 As such, screening with Goldmann tonometry could potentially lead to over- and under-referrals.
Stay updated, free articles. Join our Telegram channel

Full access? Get Clinical Tree


