Chapter 40 Retinitis Pigmentosa and Allied Disorders
 For additional online content visit http://www.expertconsult.com
RP may be seen in isolation (typical RP) or in association with systemic disease (syndromic RP). The prevalence of typical RP is approximately 1 : 5000 worldwide. In Maine, USA, the prevalence of typical RP has been found to be 1 : 5200, and the birth incidence of those who will eventually be affected with RP has been calculated as 1 : 3500.1 The prevalence of RP has been found to be 1 : 7000 in Switzerland,2 1 : 4016 in China,3 and 1 : 4500 in Israel.4 The highest frequency of occurrence, 1 in 1878, is among the Navajo Indians.5 The prevalence of syndromic RP is less well documented. The prevalence of Usher syndrome (RP with congenital deafness) is estimated to be 1 : 6000.6
Early history
The first description of the fundus findings and the use of the term “retinitis pigmentosa” are attributed to Donders in 1855 and 1857.7–9 However, the diagnosis of complicated night blindness (presumably RP) has probably existed in all cultures for hundreds, if not thousands, of years. Ovelgün, in 1744, made observations on familial complicated hemeralopia (or night blindness), which probably represented RP.9 Shortly after the discovery of the ophthalmoscope by Helmholtz in 1851, van Trigt10 in 1853 and Ruete11 in 1854 described cases that most assuredly were RP.
Typical retinitis pigmentosa
Clinical features
Nyctalopia
Difficulty with vision at night (night blindness) is one of the two hallmark symptoms of RP. Patients with typical RP usually attribute the beginning of night vision difficulties to the first or second decade of life. In some patients, especially those living in an urban setting, night vision problems may not be apparent until ocular disease is at an advanced stage. Tanino and Ohba12 noted that the onset of symptoms of RP, most commonly nyctalopia, occurred at a median age of 10.7 years in autosomal recessive disease and 23.4 years in autosomal dominant disease. The symptom of nyctalopia should not be confused with the symptom of blurred vision with night myopia or uncorrected refractive error. People with RP have a narrowing of the visual field in the dark and may describe getting easily disoriented on dimly lit evenings when others are able to see adequately. Becoming accident-prone, especially at night, is a highly suggestive symptom.
Visual field loss
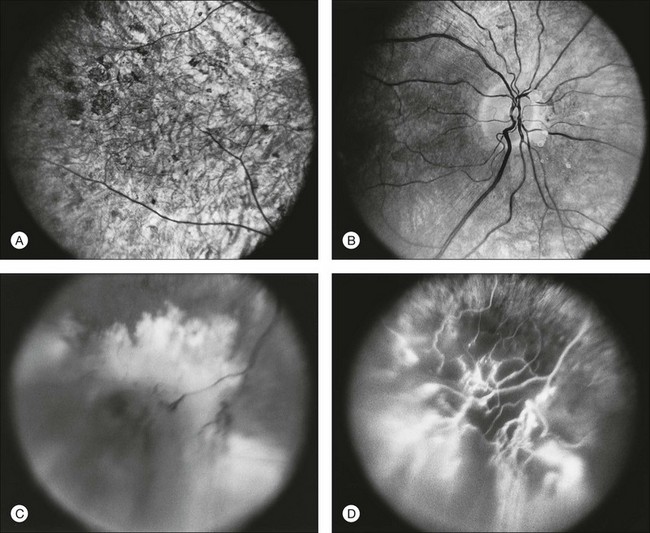
The second hallmark feature or symptom of RP is an insidious, progressive loss of peripheral visual field. In some patients, especially those with severe disease beginning in childhood, this may be manifested as a progressive contraction of the visual field (see also Perimetry under Psychophysical findings). Loss of peripheral vision can be detected in early disease with small, dim test targets (Fig. 40.1). For many types of RP, field deficits are usually found first, and are most severe, in the superior visual field (Fig. 40.2). This reflects the early involvement of the inferior retina in RP. Occasionally the visual field loss will be greater temporally, nasally, or inferiorly (Fig. 40.3). See the section on Perimetry for specifics about testing the visual field.
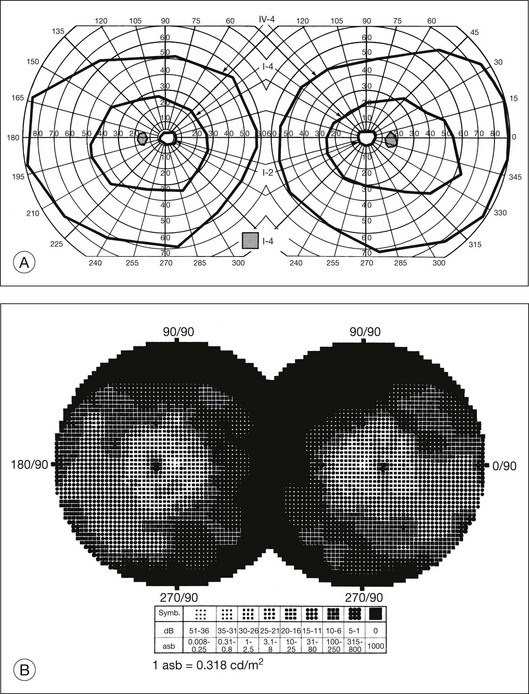
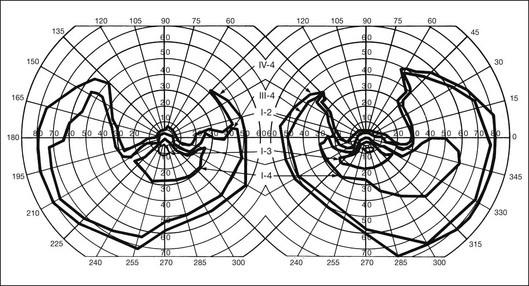
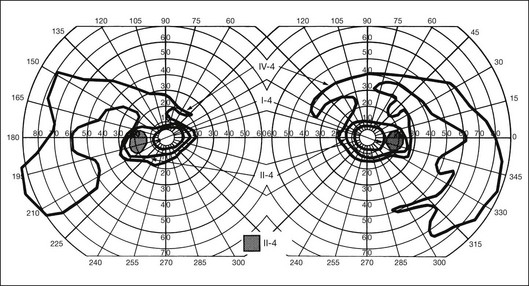
Fig. 40.3 Goldmann kinetic perimetry for an 18-year-old man with autosomal recessive retinitis pigmentosa associated with posterior column ataxia (same patient as Fig. 40.15A and brother of patient in Fig. 40.21). Visual acuity was 20/30, J1, right eye, and 20/50, J2, left eye.
In a group of patients with several types of RP, Berson et al.13 found that overall about 4.6% of the remaining visual field was lost per year. Massof et al.14,15 found that, in most forms of generalized RP, the kinetic visual field shrank approximately 50% over 4.5 years. Massof and Finkelstein15 argue that the time course for field loss in all major genetic and functional classes of RP is nearly identical if one corrects for the critical age, which is defined as the age when visual field loss is first detected by a test target of given size and brightness. In conjunction with this concept, they have proposed a two-stage hypothesis for the natural course of RP. The first stage is a predisposition for retinal degeneration, such as genetic or environmental factors, which would be different for the separate types of RP and possibly among individuals. The second stage involves the actual retinal degeneration, which proceeds on its own internal time course and which would be common to most forms of RP.
In general, there is a strong tendency for the visual field loss to be symmetric between the two eyes.14,15 A notable exception to this is the phenotype expressed in female carriers of X-linked RP. In this situation, the distribution of mutant photoreceptors in the retina is determined by lyonization (X-chromosomal inactivation). This is a random event determining which genes of the two X chromosomes (the normal or mutant copy) are expressed in a particular cell. This leads not only to unusual, irregular patterns of visual field loss in individual eyes but also to quite striking differences in field loss between the two eyes.16 However, even in these cases the visual fields usually correspond quite closely to the fundus appearance, with the greater visual field loss in the eye with greater pigmentary abnormalities.
In typical RP the rate of progression of visual field loss is usually slow and relentless, with changes best appreciated when observed over many years or even decades. However, the visual fields may change dramatically over a few months or years. A patient may not notice what may be a striking loss of peripheral visual field if the central field remains clear. As the visual field reaches the stage of “tunnel vision,” the patient usually becomes acutely aware of subsequent change with time. This often leads the patient to the conclusion that the rate of degeneration is accelerating. In the USA, statutory legal blindness results when the remaining central visual field measures 20° or less horizontally in the better eye, using the III-4-e test target on a Goldmann perimeter.17 In the UK, most RP patients, with normal acuity, would be registered as partially sighted (“gross field defect”). Legal blindness occurs when fields become “very contracted” – a stage at which acuity loss has also usually occurred (www.dh.gov.uk/assetRoot/04/07/48/48/04074848.doc).
Central vision loss
There is a common misconception in RP (documented in older texts) that the central vision will remain good until most, if not all, the peripheral field is lost. Central visual function can, however, be seriously affected early in typical RP, while significant peripheral field remains.18 Cystoid macular edema (CME),19 diffuse retinal vascular leakage,20 macular preretinal fibrosis21 (Fig. 40.4), and retinal pigment epithelial (RPE) defects in the macula or fovea22,23 can occur early in the disease. Macular edema is the topic of a section on treatment of RP later in this chapter.
To a considerable extent, the likelihood of retaining “good vision” (central acuity) to a given age in life depends on the specific inheritance type of RP. Patients with regional (“sector”) RP may retain good visual acuity all their life. Patients with autosomal dominant RP (adRP) are more likely than patients with autosomal recessive (arRP) or X-linked RP to retain good acuity beyond 60 years of age.13 Marmor, in his study of visual loss in adRP and arRP,26 found that when visual acuity began to fail, it generally dropped to 20/200 within 4–10 (median 6) years. Patients with X-linked RP are usually blind (acuity 20/200 or worse) by 30–40 years of age.13,24,25 A good prognostic sign of retention of central acuity is electroretinograph (ERG) amplitudes remaining quite large (e.g., greater than 100 µV).26
Photopsia and other symptoms
Many patients with RP at some time during the course of their disease have light flashes, or photopsias. These are reported as occurring in the midperipheral field of vision, often adjacent to areas of relative or absolute scotomas. These photopsias are described as tiny, blinking or shimmering lights or as a coarse, sparkling graininess to vision. The phenomenon is similar to that reported by patients with ophthalmic migraine except that, although retinal disease involvement expands over the years, the photopsias are generally stationary within the field. Also, unlike ophthalmic migraine, the photopsias may be continuous rather than episodic. As the scotomas become denser over the years, the photopsias decrease and finally disappear. In a retrospective survey of symptoms and findings in 500 patients with RP, Heckenlively et al.27 reported light flashes in 170 (35%). Since 8 patients in this series had retinal detachments, the symptom of light flashes must be considered an indication for careful fundus examination.
The cellular or tissue correlates that underlie photopsias in RP are unknown but may include photoreceptor dysfunction, neurite sprouting, aberrant synapse formation, and secondary remodeling of the retina, all of which occur as sequelae of photoreceptor degeneration (see section on Cell and tissue biology: Histopathology, for further discussion).
Fundus appearance
The classically described fundus appearance of RP includes attenuated retinal vessels, mottling and granularity of the RPE, bone spicule intraretinal pigmentation, and optic nerve head pallor (Fig. 40.5). In general, when ophthalmoscopically detectable abnormalities of the fundus are present, there is a high degree of symmetry between the two eyes and fundus pigmentation is often greater in the midperiphery (Fig. 40.6). In advanced disease, atrophy of the RPE and choriocapillaris leads to fundus pallor and larger choroidal vessels become visible (Fig. 40.7). In some forms of RP and allied disorders, sufficient atrophy of the retina and choroid will occur during the late stages of the disease that the fundus appearance overlaps with certain of the primary choroidal atrophies (Fig. 40.7).28 As the disease advances to late stages, vessel attenuation can become so severe that the retinal vessels appear thread-like (Fig. 40.8).
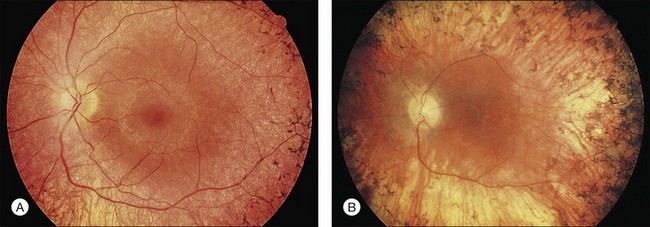
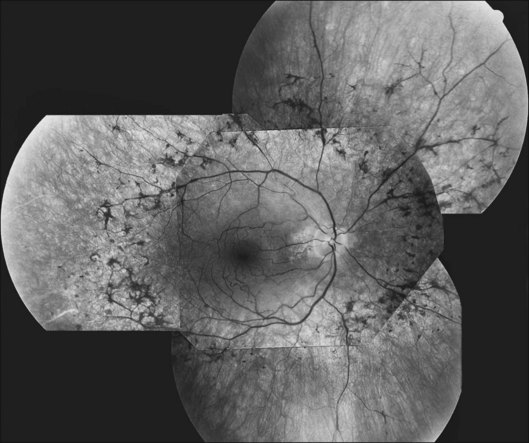
Fig. 40.6 Fundus appearance of the right eye of a 40-year old patient with rhodopsin Pro23His retinitis pigmentosa. Areas of fundus changes correlated well with kinetic visual fields, performed at 39 years of age, as shown in Figure 40.19.
Fig. 40.7 Fundus appearance of the left eye of a 75-year-old patient with advanced rhodopsin Pro23His retinitis pigmentosa. This patient is the father of the patient whose visual field is shown in Figure 40.19 and whose fundus appearance is shown in Figure 40.6.
Almost all forms of RP go through a stage where the retina appears either normal or nearly normal, even though relative scotomas may be evident on visual field testing or areas of decreased retinal threshold may be present on static perimetry. Patients who have very early RP without fundus pigmentary abnormalities are often diagnosed as having RP sine pigmento or paucipigmentary RP. This is no longer considered a specific subtype of RP but a stage through which many, if not most, patients with RP pass. The sine pigmento stage may exist for decades before typical RP signs appear. For patients with high myopia and RP, the typical fundus features of high myopia may delay the appreciation of other retinal abnormalities (Fig. 40.9).
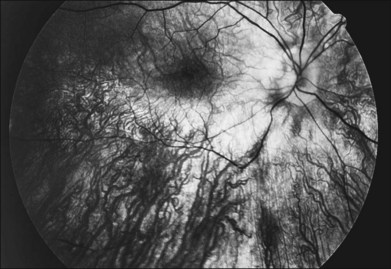
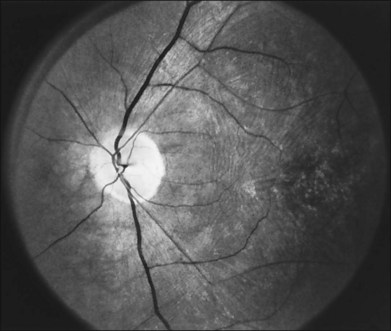
Fig. 40.9 Fundus of a 27-year-old man with high myopia and X-linked retinitis pigmentosa (same patient as in Fig. 40.2). Sparse but definite bone spicules were present in the inferior mid and far periphery. Discs showed a myopic tilt with peripapillary chorioretinal atrophy. The retinal pigment epithelium was diffusely hypopigmented.
When fundus abnormalities are evident, the earliest features are attenuation of retinal vessels and the appearance of fine mottling or granularity of the RPE in the mid and far periphery (Fig. 40.10). Spectral-domain optical coherence tomography (SD-OCT) imaging demonstrates that retinal thickness is decreased, particularly for outer layers, outside the macula and in areas of abnormal pigmentation with bone spicules.29,30 The macular region may exhibit increased luster, abnormal highlights, or wrinkling, suggesting either macular edema or early epiretinal membrane formation or preretinal fibrosis.19,22 In advanced stages, patients with RP may exhibit atrophic macular lesions (Fig. 40.11) that simulate what some authors have called (perhaps inappropriately so) “macular coloboma.”
Intraretinal, bone spicule pigment formations represent migration of pigment into the retina from disintegration of RPE cells with accumulation in the interstitial spaces surrounding retinal vessels. This process occurs most prominently at the junctions of vessels producing perivascular pigmentary cuffing and spicule-shaped deposits. The loss of pigment within the pigment epithelial cells often produces an overall gray, desaturated appearance to the retina with greater visibility of underlying choroidal vessels through the more transparent pigment epithelium. Eventually, the normal salmon-pink color of the entire mid and far peripheral fundus is replaced by dense bone spicule pigmentary formations. Heckenlively31 has described several patients with advanced RP with preservation of the RPE in a para-arteriolar distribution. Porta and colleagues32 described two additional cases. Van den Born et al.33 reported a large consanguineous family with preserved periarteriolar RP and confirmed the autosomal recessive inheritance. Almost all these patients were hyperopic. The gene for this form of RP (termed RP12) has been found to be the human homolog CRB1 of the Drosophila crumbs gene.
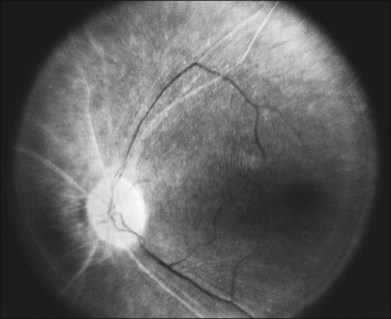
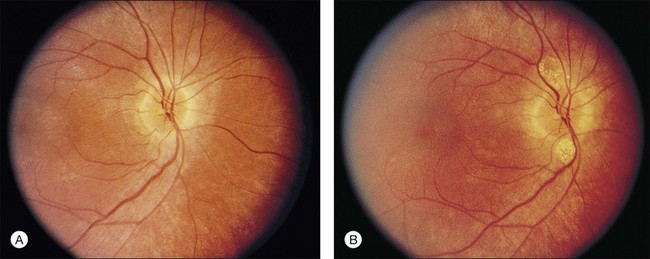
A yellowish-white metallic tapetal-like reflex or sheen can occasionally be observed in women who are carriers for the X-linked form of RP34 (Fig. 40.12) and rarely in young males with early disease35–37 (Fig. 40.13). With time, regional or diffuse mottling and atrophy of the RPE eventually replace the tapetal-like sheen. At least one form of dominant RP can show a tapetal-like reflex limited to the foveal and parafoveal region (Fig. 40.14). No histopathologic assessment has yet identified the source of a tapetal-like reflex. Cideciyan and Jacobson38 suggested that abnormal cones are the sources of the tapetal reflex. Berendschot et al.,39 using spectral fundus reflectance, confirmed that outer segments of peripheral photoreceptor cells are the source of the abnormal reflex but that this abnormality was not confined to cones. The carrier state for X-linked RP appears to be a slowly progressive retinal dystrophy in its own right, with a patchy distribution of affected retina as determined by lyonization.40,41 A number of studies have reported that the ERG is abnormal in most X-linked RP carriers.16,42–45 A tapetal-like reflex is not pathognomonic of X-linked RP but has also been reported in occasional cases of X-linked retinoschisis,46 and Oguchi disease.47
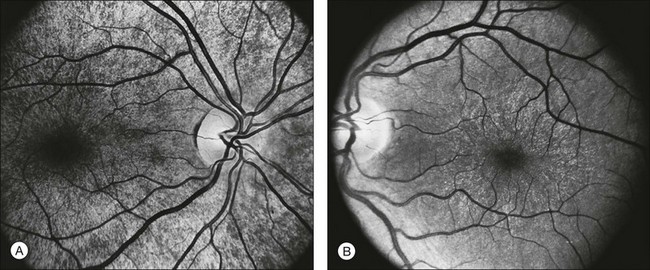
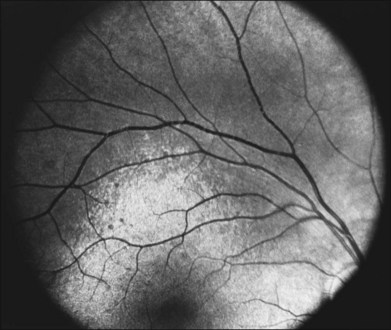
Fig. 40.13 Tapetal-like yellow-white reflex in a 13-year-old boy with X-linked retinitis pigmentosa.
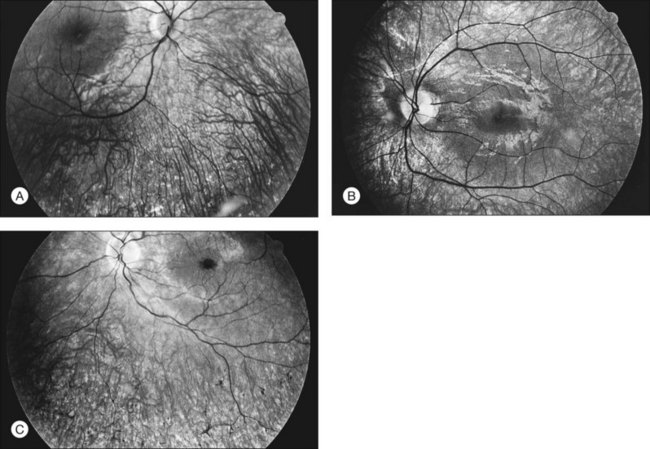
The optic disc may be normal in early RP, show a waxy fullness with hyperemia, or appear waxy and pale (Fig. 40.15A). A “golden ring” or yellowish-white halo can often be seen surrounding the optic disc in early RP (Fig. 40.15B). As disease progresses, this golden ring is replaced with peripapillary mottling, hyperpigmentation, and atrophy of the RPE (Fig. 40.15C). The optic nerve head cup-to-disc ratio has been reported to be significantly smaller in RP patients of all types (0.19 compared to 0.35 in normal subjects).48 In advanced disease, dense optic nerve head pallor results, in part from optic atrophy and in part from gliosis overlying the discs.21 Drusen-like globular excrescences may develop on the optic nerve or adjacent retina (Fig. 40.16). These have been mistaken for astrocytic hamartomas49 and are consistent with disc drusen due to aberrant axoplasmic transport.50,51 In a survey of 117 RP patients,52 10% were found to have clinically apparent optic nerve head drusen. Edwards et al.53 suggested that this phenomenon is particularly common in RP associated with Usher syndrome type 1.
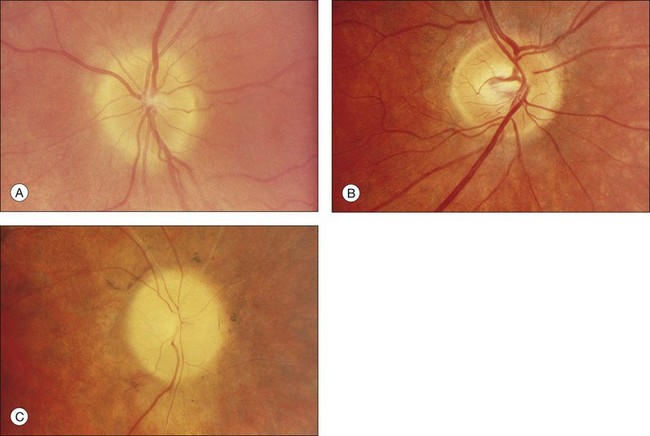
Fig. 40.15 Optic discs in an 18-year-old man with autosomal recessive retinitis pigmentosa as part of posterior-column ataxia and retinitis pigmentosa syndrome (A) (same patient as in Fig. 40.3), a 32-year-old man (B), and his 55-year-old father (C), both of whom have autosomal dominant retinitis pigmentosa. The disc in A shows peripapillary chorioretinal pallor, or the “golden ring” sign, that is characteristic of early retinitis pigmentosa. Note that the disc is nearly normal in the son (B), but shows severe waxy pallor in the father (C).
Flynn et al.54 found that the presence or absence of macular RPE defects is of significant prognostic importance with regard to retention of visual acuity over the next 5 years. Specifically, the absence of macular lesion was associated with only one line of acuity loss over the 5-year period, whereas bull’s-eye or geographic atrophy lesions were associated with a predicted acuity loss of three to four lines. The authors emphasize the importance of this type of information for prognostic counseling of patients with RP regarding the likelihood of preservation of visual acuity. Other maculopathies associated with RP include cellophane maculopathy, macular hole (complications of CME),55 and a single report of RP with central serous retinopathy.56
Vitreous abnormalities
The most common abnormality of the vitreous in RP is the presence of fine, dust-like pigmented cells released from degeneration of the RPE. In patients with RP, complete posterior detachment of the vitreous, “cotton-ball” opacities, interwoven filaments in the retrocortical space, and spindle-shaped vitreous condensations are seen more frequently than in normal subjects.57,58 A single case is reported of vitreous opacity so dense that vitrectomy was required.59 Vitreous abnormalities related to peripheral retinal ischemia and preretinal neovascularization have been reported in rare cases of adRP and arRP.60 Uncommonly, a peripheral Coats-like retinal vasculopathy with lipid exudations and serous retinal elevation can be seen in RP61–63 (Fig. 40.17). Unlike idiopathic Coats syndrome, the retinal vasculopathy seen in RP is usually bilateral, shows no sex predilection, and typically occurs in older patients. Coats-like disease is seen in 3.6% of RP cases64 and has been reported with adRP,62,63 arRP33 but not X-linked inheritance63 (although see Fig. 40.17). Coats-like changes that occur in children64,65 may change over a relatively short period of months to years, must be monitored carefully, and may need to be considered for laser or cryocoagulation. Vitreous hemorrhage related to preretinal neovascularization has also been described in rare cases.60,66 Retinal edema in some cases may be caused by inflammation resulting from the degeneration of outer retina.60,67
Anterior-segment abnormalities
Cataracts are frequent anterior-segment complications of RP. The prevalence of cataracts in RP patients aged 20–39 years varied with the inheritance type, being roughly 52% for autosomal dominant, 39% for recessive, and 72% for X-linked cases.68 The incidence of cataracts in RP is highly age-dependent.68,69 The most frequent type of cataract is a posterior subcapsular lens opacity, which occurs in 35–51% of patients.69,70 One study has suggested that posterior subcapsular opacities are most commonly associated with autosomal dominant inheritance (51%),69,70 whereas another has suggested a more common association with X-linked inheritance.71 Although keratoconus has been claimed to be more frequent among patients with RP,72 the occurrence of keratoconus in typical juvenile- or adult-onset RP is extremely rare in our experience. Glaucoma, especially primary open angle glaucoma, is also allegedly more frequent in RP.73 Sector RP appears to be associated with hyperopia and angle closure glaucoma.74 Because of the other abnormalities of the disc and fundus and because of the already abnormal visual fields, the diagnosis and management of glaucoma are quite challenging in RP patients.
Psychophysical findings
Perimetry
Assessment of visual field is an important aspect of the management of RP. This is an invaluable tool in the diagnosis of RP, as well as being the most reliable method of quantifying real change in visual deficit. It should be remembered when assessing the results of visual field testing that the reproducibility of visual fields is significantly less in patients with RP than in normal subjects. Kinetic visual fields tested on separate days by the same examiner varied by 5–6% in normal subjects but by 11–13% in patients with RP (intraobserver variation); variability between examiners for the same patient was 4–6% for normal subjects but 10–16% for patients with RP (interobserver variation).76
In the great majority of cases of RP, the earliest defects of the visual field, on kinetic perimetry, are relative scotomas in the midperiphery, between 30 and 50° from fixation (Fig. 40.18). These enlarge, deepen, and coalesce to form a ring of visual field loss. These midperipheral depressions of retinal sensitivity are readily documented as decreased retinal thresholds on static perimetry. As ring scotomas enlarge toward the far periphery, islands of relatively normal visual field remain, usually temporal but occasionally inferior or nasal (Fig. 40.19). The peripheral islands or remnants of visual field are often lost before the central field contracts sufficiently to qualify the individual as legally blind.
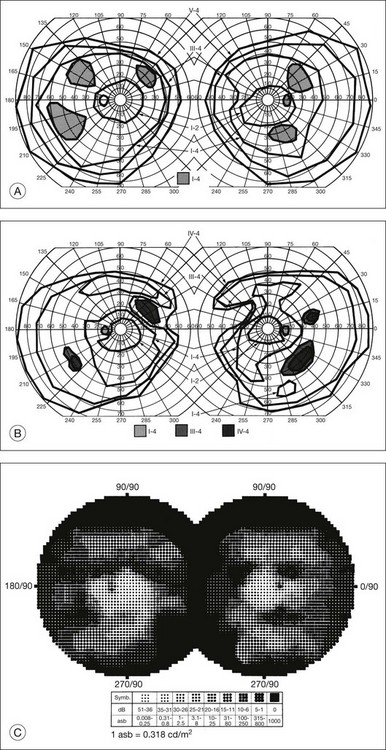
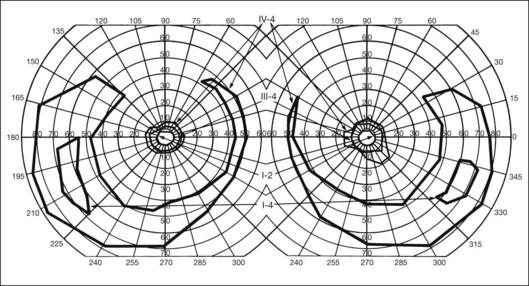
Fig. 40.19 Goldmann kinetic perimetry for a 36-year-old patient with retinitis pigmentosa from the Pro23His mutation of rhodopsin. Dense ring scotomas have broken through to the periphery superiorly, leaving a central field of 25° in diameter and only an incomplete annulus of peripheral vision in each eye. The fundus appearance of this patient at 40 years of age is shown in Figure 40.6.
Kinetic visual field testing has traditionally been performed with the manual Goldmann perimeter. Recent advances have occurred in both kinetic and static perimetry. Semiautomated kinetic perimetry,77 as implemented on the Octopus 101 and 900 perimeters (Haag-Streit, Köniz, Switzerland) (Fig. 40.20) automatically documents the testing and enables quantification of field by measurement of isopter area. A new fast thresholding algorithm, known as German adaptive thresholding estimation (GATE),78 has enabled another advance in perimetry, that of full-field static perimetry to assess the entire visual field in a time frame comparable to that required to test the central 30° field with the Standard 4–2-1 strategy (Fig. 40.20) (Weleber et al., 2012, in preparation). The static threshold data from such testing can be modeled as sensitivity values into a three-dimensional hill of vision from which the magnitude and extent of the total visual field can be determined as a volumetric measurement (Weleber et al. 2011, in preparation).
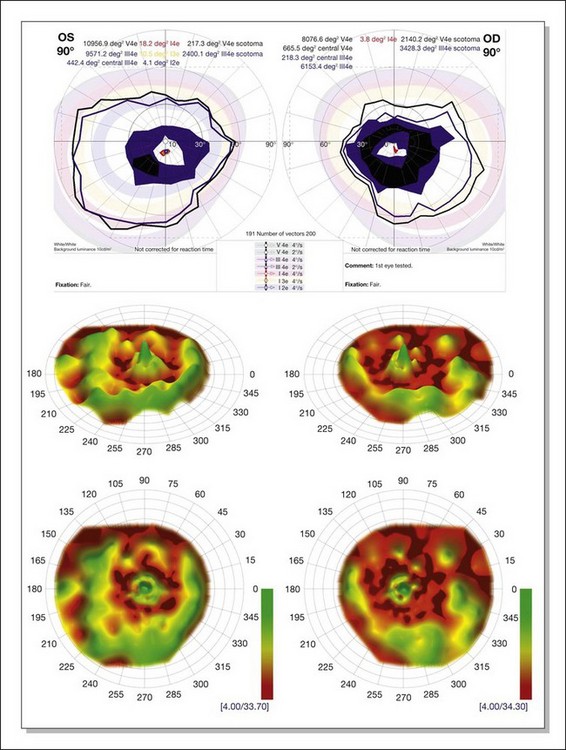
Fig. 40.20 Semiautomated kinetic perimetry in a 27-year-old woman with retinitis pigmentosa (top). The shaded areas depict the normal range for the isopters for the test targets presented. Three-dimensional (3D) model of the hill of vision for full-field static perimetry for this same subject (middle in tilted view, below in face view) using the size V test target and the German adaptive thresholding estimation thresholding algorithm.78 The volume of this model, which was 40.2 dB-sr OD and 28.0 DB-sr OS (compared to a normal 112.5 dB-sr for a normal), reflects the magnitude and extent of the visual field for this subject. Thus, this patient has 35.7% OD and 24.9% OS of expected field volume for his age. Note that the 3D model provides much more topographical information on the location of the defects in the field of vision than does the kinetic perimetry. This is the same patient whose fundus autofluorescence image for the left eye is shown in Figure 40.29A.
Two-color static perimetry has been shown to be a useful tool in assessing the dark-adapted visual fields of patients with RP. Using this technique, Massof and Finkelstein79–81 found that their patients with RP could be divided into two groups: (1) type I RP, which is associated with early diffuse loss of rod sensitivity relative to cone sensitivity and childhood-onset nyctalopia; and (2) type II RP, associated with regional and combined loss of both rod and cone retinal sensitivity and adult-onset nyctalopia. No patients have been observed to change from one type to the other.82 No families have been reported that contain both types I and II in the same sibship.15 An excess of type II RP over the type I form has been reported in simplex disease. Analysis of subgroups within simplex and multiplex RP suggest that a sizable proportion of type II patients may represent sporadic or acquired disease, and not true RP.83
Arden et al.84 studied a series of cases of adRP both with ERGs and psychophysically with scotopic static thresholds. They found that the preservation of sizable rod responses on the ERG correlated perfectly with the Massof type II classification. Absence of rod ERG did not always indicate type I disease, and both types were seen in this group. Lyness et al.85 reported clinical, psychophysical, and ERG findings in 104 patients (from 44 families) with adRP. Subgroup D (13 patients in four families) had diffuse loss of rod function and night blindness before the age of 10. Subgroup R (28 patients in 13 families) had regional loss of rod function, and most of these patients were unaware of night blindness until after the age of 20. Both groups had regional loss of cone functions. In the R group the rod-mediated ERG was usually present and substantial, whereas in the D group the rod ERG was undetectable. Although not identical, the D group bears similarities to Massof type I, and the R group bears similarities to type II. These studies suggest that the two types or groups may represent different pathophysiologic subtypes of RP. It should be emphasized, however, that a large proportion of patients (27 of the 44 families studied by Lyness et al.85) could not be incorporated into the D- versus R-type classification, partly because many patients with RP have almost undetectable ERG responses at presentation, which is quite common.
The techniques of two-color scotopic static perimetry have been further developed to evaluate rod and cone retinal sensitivities in different regions of the retina.86,87 Such testing allows the definition of which class of photoreceptor (rod or cone) is the determinant of retinal threshold in a particular region or area of the retina. This has allowed the characterization of the relative losses of rods and cones in various types of RP associated with specific mutations.88,89 Equally important to the definition of early retinal abnormalities in retinal degenerations, two-color perimetry can be used for monitoring disease therapy or for testing hypothesis of disease pathophysiology. For example, the abnormal, thickened Bruch’s membrane, which acts as a diffusion barrier between the retina and choroid, has been proposed as a major factor leading to night blindness in Sorsby’s fundus dystrophy.90 The return of rod function after oral vitamin A supplements (50 000 IU/day) was elegantly recorded using these techniques.90
Dark adaptometry
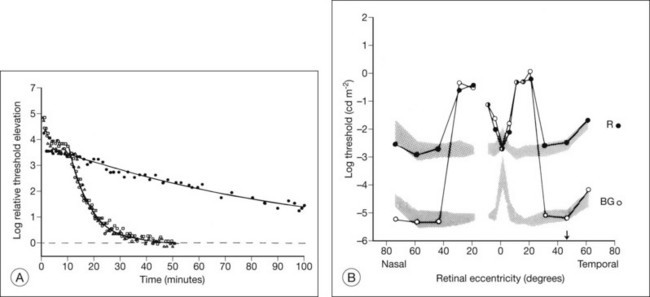
Normal subjects, when placed in the dark after exposure to a strong adapting light, will rapidly reduce their retinal psychophysical threshold using their cone system, reaching a plateau in about 5 minutes. Thereafter rod adaptation slowly increases, and rods determine retinal thresholds for another 3 log units of sensitivity before a second plateau occurs at about 30 minutes of dark adaptation. Patients with RP, when tested with dark adaptometry, may show elevation of the cone segment, the rod segment, or both, to varying degrees (Fig. 40.21). Also, in some patients there may be a delay in reaching what eventually for them is a relatively good final dark adaptation rod threshold91 (Fig. 40.22).
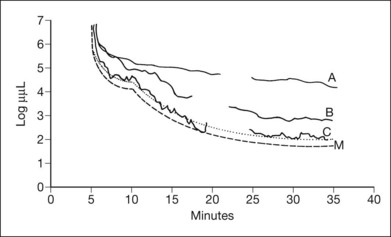
Fig. 40.21 Dark adaptometry showing marked elevation of both cone and rod thresholds with little or no cone–rod break in an 18-year-old woman, broken solid curve (A), with autosomal recessive retinitis pigmentosa and large-fiber sensory peripheral neuropathy (sister of patient shown in Figs 40.3 and 40.15A). Mild elevation of cone threshold with greater elevation of rod threshold in a 15-year-old young woman with Bardet–Biedl syndrome, broken solid curve (B). Borderline normal cone and rod segments in a 15-year-old young woman with type 2 Usher syndrome, broken solid curve (C). Dashed curve (M) is mean for normals aged 10–20 years.
Time course analysis of dark adaptometry has been performed in patients with adRP and prolonged dark adaptation is associated with rhodopsin mutations Thr17Met, Pro23His, Gly106Arg, and Thr58A.88,89,92 The most characteristic feature of the Pro23His genotype was prolonged dark adaptation, which was present in all patients regardless of their stage of disease.89 Jacobson et al.88 also reported prolonged rod dark adaptation in patients with Thr58Arg and Thr17Met mutations of rhodopsin. Indeed, prolonged rod dark adaptation appears to be a characteristic finding of virtually all rhodopsin mutations. These studies suggest that each of these mutations produces specific abnormalities in the rate of reactions within the rods that limit the recovery of scotopic sensitivity. For patients with regional forms of RP from other causes, zones of more normally functioning retina may allow reasonably good final rod thresholds (Fig. 40.22). Minor abnormalities in cone thresholds are more likely to result in complaints of poor dark adaptation than mild to moderate elevation of rod thresholds. One study has indicated that abnormalities in the normal interactions between rods and cones may underlie the symptoms of poor night vision in some patients rather than isolated rod deficits.93
Retinal densitometry (fundus reflectometry)
Retinal densitometry is a technique whereby, to deduce effective photoreceptor photopigment density, measurements are made of the difference between light shone into the eye and light reflected out of the eye. These measurements can be made and compared at different retinal loci, at different times, or against a retinal standard. From these data, estimates can be made of the rates of photopigment regeneration. Retinal densitometry has been performed on patients with RP by several investigators using a variety of techniques.94–97 Rhodopsin levels were found to be reduced in all patients, but rhodopsin bleaching and regeneration kinetics have been normal. Van Meel and van Norren98 found subnormal cone pigment levels in all patients studied and found prolonged cone pigment regeneration in eight of 12 patients with RP.
The losses of retinal sensitivity in RP in some patients are believed to relate to loss of quantum catch by the reduction of rhodopsin levels in the retina.94,95 A reduction of rhodopsin level to one-tenth of normal, for example, would be expected to be associated with a 10-fold elevation in the rod threshold. These calculations are only estimates, however. In vitamin A deficiency, the elevation of the rod threshold is much greater than predicted by the reduction in rhodopsin levels.95 Perlman and Auerbach99 described a group of patients with RP who, when studied with retinal densitometry, were found to have elevations of rod thresholds greater than what would be expected purely on the basis of reductions of rhodopsin levels. Kemp et al.100 found that 4 patients with type II (regional) adRP had elevations of retinal threshold that could be explained solely by loss of quantum catch from reductions of rhodopsin levels in the retina. However, 5 patients with type I (diffuse) adRP had elevations of threshold that were much greater than expected on the basis of loss of rhodopsin and quantal absorption for the reduction of rhodopsin levels observed.100 These studies provide evidence suggesting that the two classifications represent different pathophysiologic entities. Others have studied patients with defined mutations of rhodopsin. Kemp et al.89 have shown that, for patients with the Pro23His mutation of rhodopsin, rhodopsin levels are decreased below normal by amounts that indicate that rod sensitivity loss is determined by the reduced ability to absorb light. Similar findings were reported for patients with rhodopsin Thr17Met, Thr58Arg, and Gln344ter.88
Fulton and Hansen97 have reported reflectometry results on a mother and three daughters whose RP appeared to have a sectoral distribution. Elevations of retinal threshold were greater than those predicted by reductions of rhodopsin seen on densitometry measurements, suggesting that the dysfunction was central to the photoreceptor outer segments.
Electrophysiology
Karpe101 in 1945 first reported that the ERG was “extinguished” in RP. The standing, or resting, potential of the eye was first described by DuBois-Reymond in 1849. Riggs102 in 1954 was the first to report that the resting potential was decreased in pigmentary degeneration of the eye. Arden et al.103 in 1962 developed the currently widely used technique for measurement of the light-induced rise of the resting potential of the eye (the electro-oculogram (EOG)), which is considered a function of the RPE. Fast oscillations of the resting potential can be recorded, and these offer another measure of RPE function.104 Gouras105 in 1970 based clinical ERG on the use of Ganzfeld stimulation. Standardized conditions and assessment protocols have now been established for electrodiagnostic investigations.106,107
Electrodiagnostic responses in an RP patient can range from normal to undetectable. In general, more sizable responses are seen with younger patients or at earlier stages of disease. Most patients with advanced RP have undetectable responses (typically less than 10 µV) to single-flash, nonaveraged techniques.105 Computer averaging, however, can usually detect small ERG responses in even moderately advanced stages.13,108 In studying the natural course of RP, Berson et al.13 found that patients lost an average of 16–18.5% per year of remaining ERG amplitude to bright white flashes (a mixed rod–cone response).
Many studies have compared ERG responses in the different RP inheritance types. Tanino and Ohba12 and Berson,109 using conventional techniques, found that the ERG is more likely to be recordable in older patients with adRP than arRP. Berson et al.13 have also shown that progressive ERG loss of amplitude over a 3-year period is least in adRP. Birch and Fish110 found that the rate of progression of rod loss, as indicated by the half-saturation coefficient of the rod stimulus–response curve, varied among the inheritance groups. This ranged from 0.3 log unit/year in elevation of rod threshold in X-linked RP to 0.12 log unit/year elevation in adRP.
Agreement exists that the cone-mediated implicit times can be significantly prolonged in various forms of RP. Berson111 has also stressed the importance of delays in the implicit time for cone-mediated 30-Hz flicker responses. Berson and colleagues112,113 found that the cone-mediated b-wave implicit time in their patients was characteristically prolonged in adRP with reduced penetrance but not in completely penetrant adRP. Sandberg et al.114 suggested that this was due to an abnormal contribution of extrafoveal cones in adRP with incomplete penetrance. This may be due to abnormal cone light adaptation or a disturbance of normal rod–cone interactions.
Histopathologic study has indicated that, in RP, a postreceptor deficit may contribute to macular dysfunction.115 ERG study has confirmed this. Falsini et al.116 have assessed 8–10-Hz focal ERGs in 22 simplex and recessive RP cases. They found a loss of fundamental and second harmonic components and an increase in the fundamental-to-second harmonic ratio. This was interpreted as suggesting that both inner and outer retinal abnormalities contribute to visual deficit. Cideciyan and Jacobson117 have documented electronegative b-waves in some cases of RP. This finding was seen with abnormalities of on/off components of cone ERGs and reduced oscillatory potentials117 and was interpreted as indicative of significant inner retinal abnormalities in these RP cases.
Models of analysis of the ERG have been developed that attempt to isolate from the ERG the photoreceptor and bipolar contributions, specifically the original components of Granit’s model of the cat ERG, termed P3 and P2118 (Fig. 40.23A). These analysis methods have been developed to quantify the visual deficit attributable to outer and inner retinal disease (Fig. 40.23B–D). P3 is the corneal-negative response of photoreceptor outer segments that contributes to the a-wave of the Ganzfeld ERG. The analysis involves subjecting the leading edge of the a-wave of the ERG at a range of intensities to a mathematical curve-fitting algorithm119–121 (Fig. 40.23C) using equations that describe the kinetics of rod phototransduction activation.122 The method of Hood and Birch123 allows for estimation of two variables: S, which is a sensitivity factor, and Rmp3, which is the maximum amplitude. Such analysis can determine whether phototransduction is affected in a given disease.
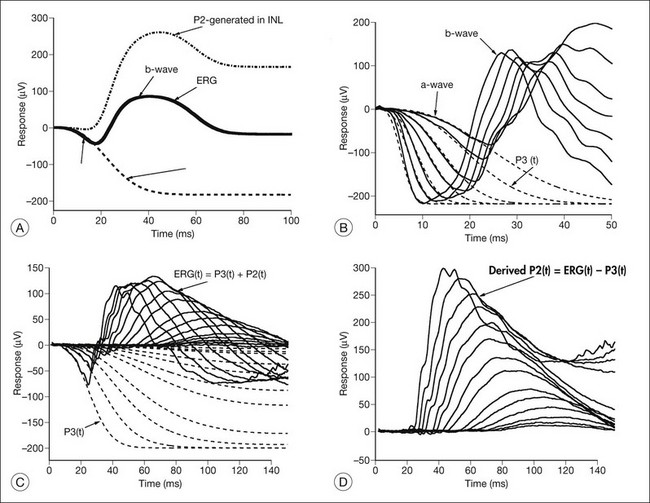
P2 is the bipolar cell-derived component of the rod-isolated b-wave. The P2 component of the rod b-wave, derived from bipolar cells, can be isolated from the full-frequency ERG, using an algorithm whereby the P3 is first calculated for a given series of intensities, after which the P3 is subtracted from the series of rod responses124,125 (Fig. 40.23D). This gives a much better estimate of the ON bipolar contribution to the b-wave, especially for patients in whom the ON bipolar cells are more affected than the photoreceptors.124
Application of these techniques to 15 patients with RP has shown that, for P3 analysis, all patients had significantly reduced values of Rmp3, indicating effective loss or damage of rods, and a wide spectrum of values for S.126 Three patients had normal values for S. Four RP patients had subnormal S values but normal local retinal psychophysical thresholds in some regions of their retina. The rest had abnormal S values and abnormal visual fields with globally reduced thresholds. The rod b-wave amplitudes to a range of intensities for these RP patients were fitted with the Michaelis–Menten equation, generating the parameters Kbw (the semisaturation intensity, which is a sensitivity function) and Vmax (the maximum amplitude). For all patients, the changes in Kbw and Vmax followed the changes seen in S and Rmp3.126 Hood and Birch123 studied rod phototransduction in 11 patients with RP and four with cone–rod dystrophy (CRD). Their findings, which were similar to those above, supported the conclusion that the activation stage of rod phototransduction is affected in some forms of RP and CRD but not all.
Supernormal and delayed derived P2 responses were found by Hood et al.127 when they applied modeling analysis to an unusual retinal dystrophy, first reported by Gouras et al.128 in 1983 as “cone dystrophy, nyctalopia, and supernormal rod responses.” Although Gouras et al.128 initially attributed this dystrophy to an abnormality in receptor cyclic guanosine monophosphate (cGMP) activity, P3 and P2 modeling by Hood et al.127 showed that the delays in the rod and cone b-wave were not caused by the speed or amplification of phototransduction but resulted from delays beyond the outer segments involving a delay in activation of the inner nuclear layer activity. This disorder was subsequently clinically and electrophysiologically defined as the enhanced S-cone syndrome (ESCS)129,130 and was later shown to result from mutation of the gene NR2E3.131
Paradigms have been developed to study the kinetics of rod transduction deactivation.132 This technique uses a bright conditioning flash followed by a probe flash. The recovery of the amplitude of the response to the probe, which is presented at varying intervals after the conditioning flash, provides a measure of the return to baseline of the response to the conditioning flash and, hence, the kinetics of transduction deactivation. The authors conclude that the lifetime of activated rhodopsin in normal human rods is 2.3 seconds. This technique has been applied to humans with the Pro23His rhodopsin mutation, demonstrating a reduction of the gain of activation and marked slowing of deactivation of rhodopsin (by a factor of at least 5).132 Animal models of RP, for example, transgenic mice expressing the mutant Pro23His rhodopsin gene, have also demonstrated increases in the half-maximal recovery period, T50%, indicating abnormally prolonged recovery from the conditioning flash.133
Analysis of the a-wave leading edge has also recently shown that in RP, the efficiency of cone phototransduction is affected very early, even in some patients in whom the sensitivity of rod phototransduction is normal. X-linked inheritance seemed to be associated with greater phototransduction abnormalities in cones and rods at a younger age than seen in other modes of inheritance.134
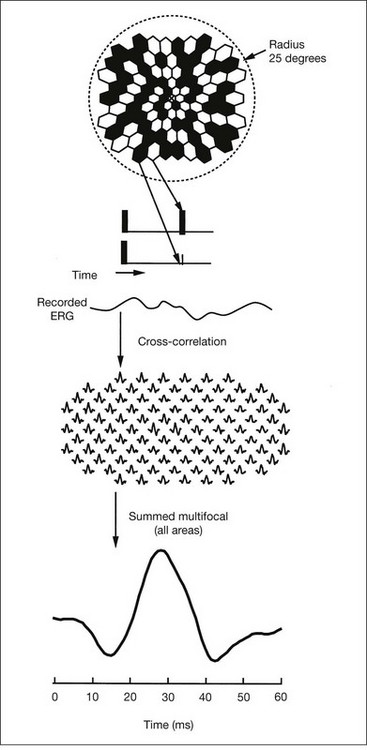
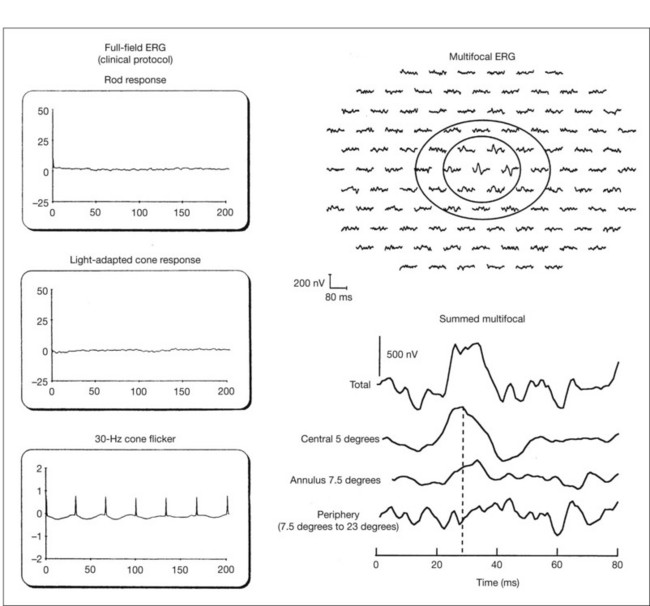
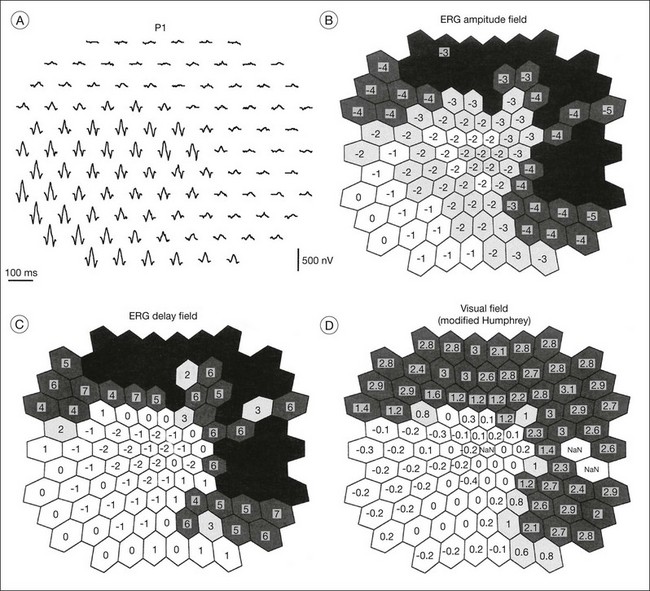
Multifocal ERG techniques have been developed whereby, through patterned stimulation of the retina cross-correlated with recording of the ERG responses from a corneal electrode, very small ERG responses can be obtained from precisely localized regions of the retina135–137 (Fig. 40.24). Multifocal ERGs can be seen in advanced RP where the 30-Hz flicker response is barely detectable138 (Fig. 40.25). Hood and Li137 have shown that, in RP, amplitudes of ERG responses do not correspond as well as b-wave implicit times with the retinal sensitivity as measured by static perimetry (Fig. 40.26). This is most evident with the regional or sectoral types of RP. Thus the b-wave implicit time appears to reflect early involvement of the disease process in regions of the retina that still have relatively good retinal sensitivity. Robson et al.139 compared pattern ERG changes in RP patients with abnormalities of fundus autofluorescence (FAF). In such patients, pattern ERG responses suggested that visual loss was attributable to dysfunction rather than cell death.
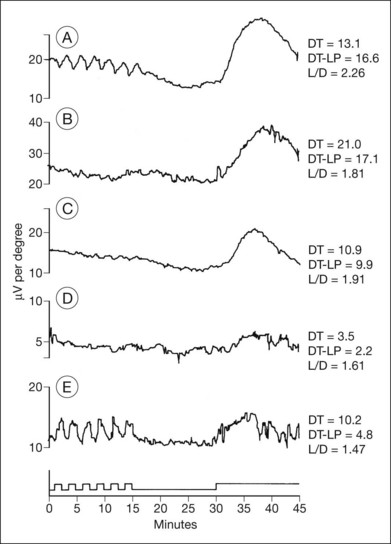
In general, the EOG is abnormal in diffuse hereditary rod–cone degenerations of the retina.140 In typical RP, the slow and fast light-induced oscillations of the resting potential are usually decreased simultaneously early in the disease (Fig. 40.27). In some patients the fast oscillations of the resting potential are diminished earlier than the slow oscillation.104 In others the fast oscillations of the EOG are more preserved than the slow oscillation, a finding that also occurs in Best vitelliform macular dystrophy.104,141 In most cases of RP the EOG is abnormal when the ERG is abnormal.
Imaging modalities in RP
Fundus photography/fluorescein angiography
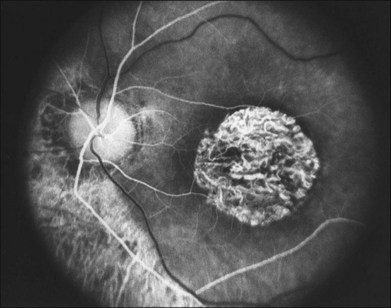
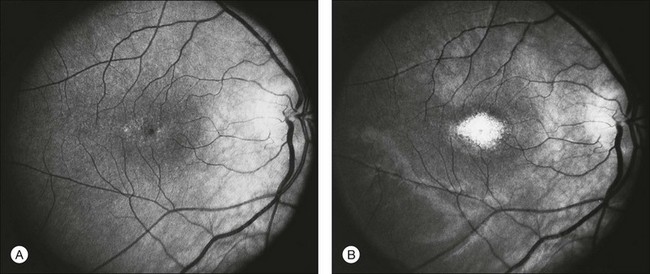
Documentation by fundus photography can assist in monitoring changes in patients with RP. Fluorescein angiography in patients with RP will demonstrate hyperfluorescence in areas of RPE atrophy and can highlight areas of CME (Fig. 40.28). However, fluorescein angiography has largely been supplanted by OCT for detecting cystoid maculopathy. In addition, concerns about light exposure accelerating certain forms of RP in animal models have prompted many ophthalmologists to exercise caution in obtaining excessive photographs.142
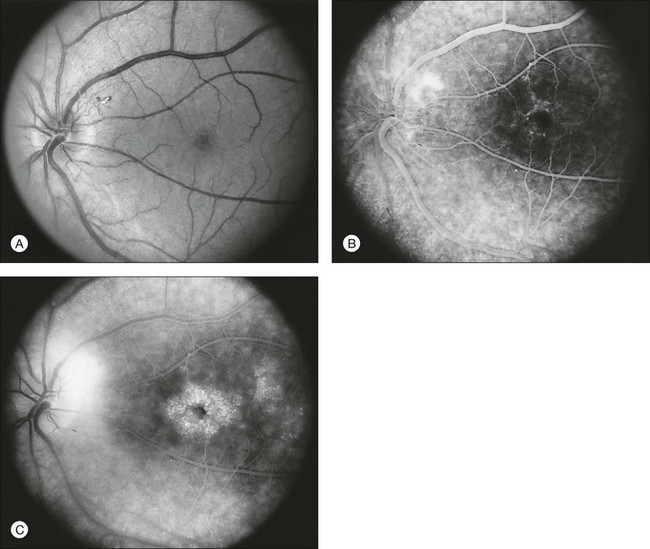
In many cases of mild to moderate RP, fluorescein angiography reveals transmission defects of the RPE with later diffuse leakage.143 In 78 of 82 patients with RP, Newsome144 found extravasation of dye from perifoveal capillaries in only a few patients but frequent abnormalities of the blood–retinal barrier at the level of the RPE. Such angiographically significant CME can often be seen at an early stage of disease in young patients who still retain good vision (20/25 or better). Macular edema is a significant cause of early loss of visual acuity in RP.144,145
Autofluorescence
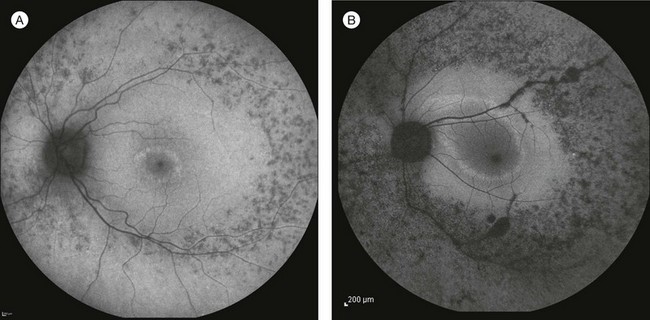
FAF utilizes a scanning laser ophthalmoscope to stimulate intrinsically autofluorescent molecules of lipofuscin to visualize the RPE.146 Studies from patients with RP have shown that lack of signal on FAF correlate well with areas of RPE atrophy, while areas of increased FAF can be seen in areas with persistent macular edema as well as within areas of surviving retina.147 Most RP patients demonstrate a perifoveal ring (Fig. 40.29) of increased autofluorescence within the macula, which denotes the border between functional and dysfunctional retina (see Chapter 4, Autofluorescence).139,147–149 The border of the parafoveal ring of increased autofluorescence has been shown to correlate with functional status as measured by pattern ERG, multifocal ERG, scotopic fine matrix mapping, and microperimetery.150,151 In addition, areas outside the ring have been correlated with the loss of outer nuclear layer thickness and disruption of the inner-segment–outer-segment (IS/OS) junction on OCT.152,153 Near-infrared autofluorescence (NIA) has also been used to image melanin present in the apical tips of the RPE.154 Similar to FAF, rings with increased NIA are seen in patients with RP.155 Combined NIA and blue light FAF imaging suggest that the presence of NIA may correlate better with preserved cone function, while blue light FAF indicates only preservation of RPE cells.155
Optical coherence tomography
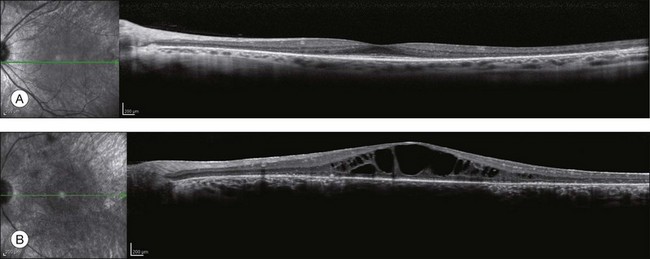
OCT has become one of the most utilized imaging modalities for studying retinal disease in the past several years. Ultrahigh-resolution OCT and SD-OCT have been used to study retinal structures in patients with RP.156,157 In these patients, such studies have demonstrated decreased thickness of the outer nuclear layer and loss of the external limiting membrane and IS/OS junctions. Loss of outer nuclear layer thickness or of the IS/OS has been correlated with visual defects measured by visual fields, microperimetry, or multifocal ERG.29,158–160 SD-OCT is especially useful for detecting CME (Fig. 40.30) or epiretinal membranes, which are common features in patients with RP.161 The ability to detect CME by OCT ring often eliminates the need for fluorescein angiography.
Adaptive optics scanning laser ophthalmoscopy
Traditional imaging modalities cannot resolve individual retina cells due to the optical limits imposed by the cornea and lens which create higher-order aberrations resulting in image blur.162 A combination of adaptive optics with flood illumination or scanning laser ophthalmoscopy can compensate for these factors and provide imaging of individual cone photoreceptors.163 Adaptive optics studies from patients with both CRD and RP have demonstrated increased cone spacing as well as qualitative areas where cone profiles could not be identified.164–166 Recent advances have now enabled imaging of rod photoreceptors and foveal cones.167 The ability to quantify cone photoreceptors has already been studied in one treatment trial for RP168 and will undoubtedly play a role in future studies.
Classification
Subdivision by inheritance type
The most useful subclassification of RP both in clinical and research setting is still subdivision on the basis of mode of inheritance. Typical RP can be inherited as an arRP, adRP, or X-linked recessive trait (X-linked RP). Although mitochondrial inheritance is associated with pigmentary retinopathy, typical nonsyndromic RP has yet to be reported with this type of inheritance. The percentage of each inheritance type has been found to vary from author to author and with country of origin of the study. Despite the fact that typical RP is always genetic, a lack of family history of retinal disease is often reported. Studies around the world have found that no other affected family member can be identified in 15–63% of cases. Such cases are labeled “simplex RP.” Averaging results from different studies suggests that 35% of RP patients in the USA, 42% in the UK, and 48% in China are simplex. It is assumed that large proportions of these cases represent recessive inheritance. Jay169 has estimated that no more than 70% of simplex cases are autosomal recessive.
Stay updated, free articles. Join our Telegram channel

Full access? Get Clinical Tree


