Purpose
To evaluate relationships between age-related macular degeneration (AMD) morphology on spectral-domain optical coherence tomography (SDOCT) and visual function.
Design
Cross-sectional, observational.
Methods
From the Alabama Study on Early AMD baseline visit, visual acuity, cone-mediated sensitivity, rod-mediated dark adaptation, and SDOCT were obtained in 1 eye per subject with no apparent retinal aging (n = 15), normal aging (n = 15), early AMD (n = 15), and intermediate AMD (n = 46). The volumes of retinal pigment epithelium (RPE)-drusen complex, RPE-drusen complex abnormal thinning, RPE-drusen complex abnormal thickening, and inner and outer retina were calculated in specified regions using semi-automated SDOCT segmentation.
Results
Better cone-mediated sensitivity was associated with greater RPE-drusen complex volume (r = 0.34, P < .001) and less RPE-drusen complex abnormal thinning volume (r = −0.31, P = .003). Longer rod-mediated dark adaptation time, the duration for rod-mediated sensitivity to recover from photo-bleach exposure, correlated with lower RPE-drusen complex volume (r = −0.34, P = .005) and greater RPE-drusen complex abnormal thinning volume (r = 0.280, P = .023). In 19 eyes with subretinal drusenoid deposits (SDD) vs 47 eyes without SDD, rod-mediated dark adaptation time was longer (mean ± SD 13.5 ± 7.0 vs 10.2 ± 3.1 minutes, P = .004), RPE-drusen complex abnormal thinning volume was greater ( P < .0001), and visual acuity and cone sensitivity did not differ.
Conclusion
Decreased function relates to structural markers on SDOCT in AMD. Because the RPE-drusen complex includes the interdigitation of outer segments and RPE apical processes and SDD in eyes with AMD, slower dark adaptation might be related to structural abnormalities of the RPE, the RPE-photoreceptor interface, or both.
Despite advances in medical and surgical care, age-related macular degeneration (AMD) remains an important cause of central vision loss in the United States. In AMD, the neurosensory retina in the macula is thought to degenerate in part owing to the accumulation of extracellular deposits in the spaces found on either aspect of the retinal pigment epithelium (RPE). When deposits in the sub-RPE space coalesce into visible lesions, they are termed drusen. In the subretinal/pre-RPE space, lesions are termed subretinal drusenoid deposits (SDD), also known as reticular drusen or reticular pseudodrusen. The degeneration of photoreceptors is believed to be rooted in the failure of their support system (RPE, Bruch membrane, and the choroid). Photoreceptor degeneration in early AMD is associated with decreased light sensitivity in the macula and slowed dark adaptation despite normal visual acuity.
This study is an initial step in phenotyping early and intermediate AMD using spectral-domain optical coherence tomography (SDOCT). We hypothesized that early AMD classification by measurement of SDOCT structures and/or retinal function may better indicate disease stage than AMD solely classified by color fundus photography. We examine the relationship between morphology and function in early AMD by correlating severity of disease as assessed by SDOCT scans with macular function measured by visual acuity, cone-mediated light sensitivity, and rod-mediated dark adaptation. Our goal is to identify methods that reveal the relationship between AMD pathology and psychophysically measured cone- and rod-mediated function. The structural and functional markers studied herein have the potential to lead to improved endpoints integral to the design of large multicenter AMD clinical studies.
Methods
The data source for our analysis was the Alabama Study on Early Age-Related Macular Degeneration (ALSTAR), a prospective study on the association between visual function at baseline in older adults in normal macular health and incident early AMD. The eligibility criteria for enrollment have been described. All participants provided informed written research consent. The analysis of the ALSTAR study data was approved by both the University of Alabama Birmingham Institutional Review Board (IRB) under protocol X120724002, Phenotyping AMD: Relating retinal structure and function in early AMD; and the Duke University Health System IRB under protocol Pro00016373, Duke Advanced Research in SDOCT Imaging (DARSI) Laboratory. Data collected from SDOCT scans for all enrolled eyes were stored and managed in compliance with guidelines from the Health Insurance Portability and Accountability Act.
ALSTAR also assembled a sample of older adults who already had early or intermediate AMD in 1 or both eyes at baseline. A subsample of the ALSTAR baseline group was used for this proof-of-concept study relating morphology to function. For the current study, a subsample of eyes was assembled into 4 groups. Groups were defined by grading 3-field 30-degree digital, color stereo fundus photographs (Carl Zeiss Meditec 450 Plus camera; Carl Zeiss Meditec, Inc, Dublin, California, USA) using the Beckman AMD Classification scale. The groups were as follows: no apparent aging changes (no drusen and no AMD pigmentary abnormalities); normal aging changes (only small drusen <65 μm and no AMD pigmentary abnormalities); early AMD (medium drusen >65 and ≤125 μm and no AMD pigmentary abnormalities); and intermediate AMD (large drusen >125 μm and/or any AMD pigmentary abnormalities, without any area of geographic atrophy). The SDOCT grader was masked to all structural and functional characteristics of eyes. Across all groups, eyes were also categorized as yes or no for the presence of SDD based on SDOCT review by a masked grader at Duke for subretinal vs sub-RPE drusen.
Eyes were randomly selected (1 eye per participant) from the total sample of eyes from ALSTAR patients at baseline who completed satisfactory SDOCT imaging (n = 1243 eyes). There were originally 15 eyes in each of the categories of no apparent aging, normal aging, early AMD, and intermediate AMD. The sample size for intermediate AMD was intentionally increased after qualitative review of the SDOCT revealed sparse and small drusen in the first 15 eyes with intermediate AMD. Thus an additional 31 eyes (36 eyes, with 5 excluded owing to insufficient image quality) were added prior to analysis, since there was considerably more variability in funduscopic appearance and SDOCT characteristics among eyes with intermediate AMD than in the other groups.
Functional Testing
Best-corrected visual acuity for each eye was assessed via the Electronic Visual Acuity tester (EVA; JAEB Center, Tampa, Florida, USA) under photopic conditions (100 cd/m 2 ) and expressed as the logarithm of the minimal angle of resolution (logMAR).
Cone-mediated light sensitivity was measured at 8 retinal loci by the Humphrey Field Analyzer (Carl Zeiss Meditec, Inc) in the 24-degree radius field using the 24-2 SITA protocol and a white stimulus on white background. The diameter of the target stimulus was 0.43 degree of visual angle. Light sensitivity thresholds were expressed in decibel units (dB) of attenuation. In Figure 1 (Bottom left), the white dots represent the 8 test target locations where cone-mediated light sensitivity was measured within the region of SDOCT imaging, as denoted by the green rectangle.
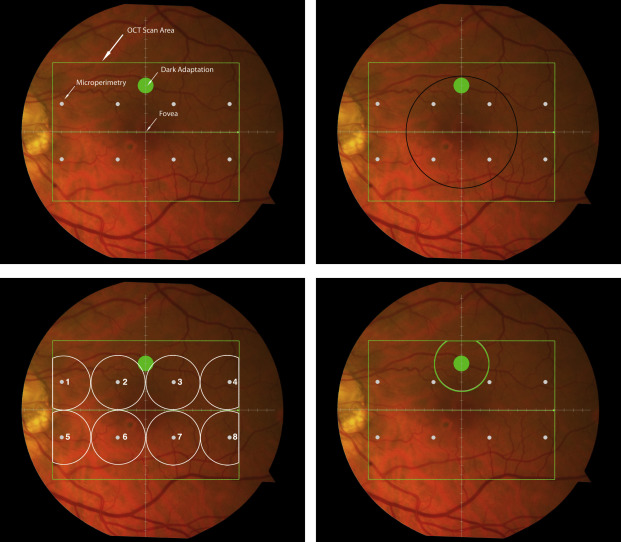
Rod-mediated dark adaptation was measured psychophysically using AdaptDx (MacuLogix, Hummelstown, Pennsulvania, USA), a computer-automated dark adaptometer described previously. Before testing, the eye was dilated with 1% tropicamide and 2.5% phenylephrine hydrochloride so that a pupil diameter of ≥6 mm was achieved. Trial lenses were added for the 30 cm viewing distance, if needed, to correct for optical blur. The fellow eye was occluded with an opaque patch. The participant then placed his or her head in the forehead-chinrest of the adaptometer. An infrared camera behind the fixation light displayed the eye on a monitor viewed by the examiner, who positioned the participant’s test eye to the red fixation light using a reticule. The procedure began with a photo-bleach exposure to a flash (0.25 ms duration, 58 000 scotopic cd/m 2 s intensity; equivalent ∼83% bleach) while the participant was focused on the fixation light. This bleach has been shown to be sufficiently intense to generate impaired dark adaptation parameters in early AMD patients using a 20-minute-duration test protocol. The flash subtended 4 degrees and was centered at 5 degrees on the inferior vertical meridian (ie, superior to the fovea on the retina). This position was also used for the test target for measuring light sensitivity. During threshold measurement, the participant was instructed to maintain fixation on the red fixation light and to press a response button when a flashing target first became visible within the bleached area. Threshold was estimated using a 3-down/1-up modified staircase procedure described previously, and continued at 30-second intervals for 20 minutes. Log thresholds were expressed as sensitivity in dB as a function of time from bleach offset. The speed of dark adaptation was characterized by the “rod intercept time,” defined as the duration required for sensitivity to recover to a criterion sensitivity value of 5.0 × 10 −3 scotopic cd/m 2 (3.0 log units of attenuation of the stimulus). The criterion sensitivity level is located in the latter half of the second component of rod recovery. An increase in the rod intercept time is caused by a slowing of the second component of rod-mediated dark adaptation and thus a rightward shift of the dark adaptation function. In Figure 1 , the large green dot represents the location and size of the test target where rod-mediated dark adaptation was measured. Note that this is located within the region of SDOCT imaging denoted by the green rectangle.
Optical Coherence Tomography
Retinal vascular landmarks on the fundus photographs were used to register the fundus image onto the scanning laser ophthalmoscope retinal image of the 20 × 15 degree SDOCT volume (Spectralis; Heidelberg Engineering, Heidelberg, Germany), which had 60 μm between B-scans. A retinal map was developed, specifying the locations and sizes of test targets for both dark adaptometry and cone-mediated light sensitivity measurements ( Figure 1 ).
The SDOCT structures were qualitatively and quantitatively analyzed for regions of 12 degrees (3.46 mm) diameter centered on the fovea ( Figure 1 , Top right), 6 degrees (1.73 mm) diameter centered on each of the 8 cone sensitivity test sites ( Figure 1 , Bottom left), and 6 degrees (1.73 mm) diameter centered on the dark adaptation site ( Figure 1 , Bottom right). SDOCT analyses were masked to all color fundus photograph, functional, and clinical data. Qualitative analysis included assessment of the vitreoretinal interface, hyperreflective foci within the retina, external limiting membrane, photoreceptor inner segment ellipsoid band, and interdigitation zone (where RPE apical processes and photoreceptor outer segments interface). In our dataset, we found no SDOCT findings (eg, fluid or gross atrophy) that would typically be associated with advanced AMD.
For quantitative SDOCT analysis, semi-automated segmentation of the inner retina, outer retina, and RPE was performed using proprietary software (Duke SDOCT Retinal Analysis Program, DOCTRAP V14.1.2; Duke University, Durham, North Carolina).
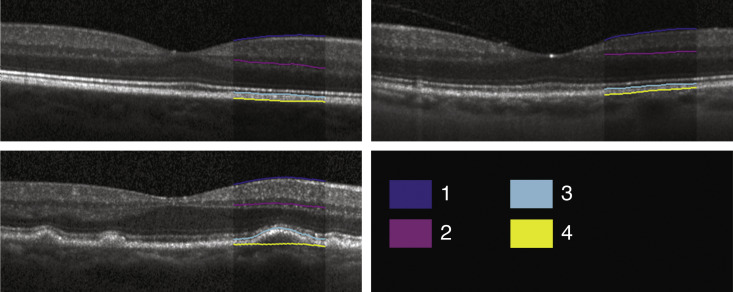
Automated segmentation was reviewed for errors by trained graders. The foveal center was chosen manually based on the deepest site in the foveal pit. Retinal thickness was measured from the inner aspect of the internal limiting membrane to the inner aspect of the RPE plus drusen complex ( Figure 2 , between lines 1 and 3). Inner retinal layers were measured from the inner border of the internal limiting membrane to the inner border of the outer plexiform layer ( Figure 2 , between lines 1 and 2). Thickness of the photoreceptor layer was measured from the outer plexiform layer to the inner border of the RPE or any overlying SDD material ( Figure 2 , between lines 2 and 3). RPE-drusen complex thickness extended from the inner aspect of the RPE plus drusen material to the outer aspect of the Bruch membrane ( Figure 2 , between lines 3 and 4). Thus, according to previously published definitions, the RPE-drusen complex volume contained all extracellular deposits internal to the RPE (SDD) and external to the RPE (basal laminar deposits, basal linear deposits/drusen), as well as RPE apical processes and cell bodies, whether normal, hypertrophic, or atrophied.
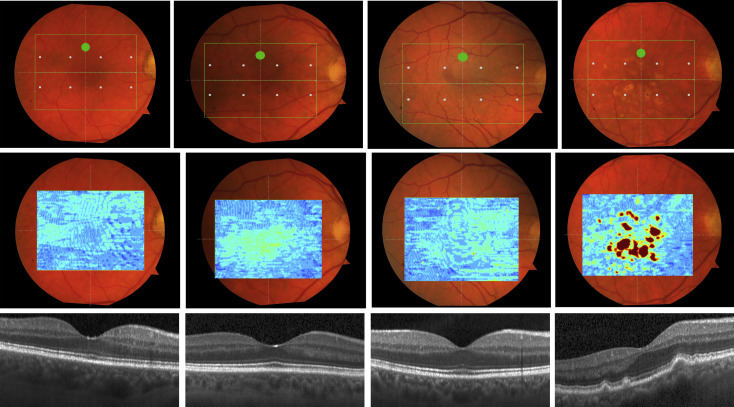
We calculated the volumes of the retina, inner and outer retina, and RPE-drusen complex by first centering the layer boundary positions on the fovea, then generating thickness maps 73 × 1024 pixels in size. These maps were interpolated to 1001 × 1001 pixels to achieve equivalent resolutions in both en face (X-Y) directions. Thickness values were converted from pixels to micrometers according to the Spectralis SDOCT imaging axial resolutions. The volumes consisted of the thicknesses integrated over the 12 degree (3.46 mm) diameter region centered on the fovea ( Figure 1 , Top right, black ring), within a 6 degree (1.73 mm) diameter region centered on each of the 8 cone sensitivity test sites ( Figure 1 , Bottom left, white rings), and within a 6 degree (1.73 mm) diameter region centered on the dark adaptation site ( Figure 1 , Bottom right, green ring). Several of the regions of OCT volumes were truncated at the margin of the SDOCT scan; these were at the same location for all eyes ( Figure 3 ). Overlaid thickness maps and representative B-scans for each group are illustrated in Figure 3 .
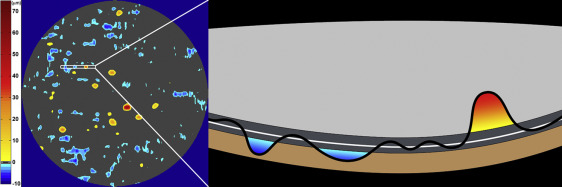
The RPE-drusen complex abnormal thickening and abnormal thinning volumes were also computed. The volume of RPE-drusen complex abnormal thickening is a measure of RPE-drusen complex that exceeds 3 standard deviations above the mean of each SDOCT axial measurement point from the normative dataset composed of the 15 No Apparent Aging subjects ( Figure 4 , orange tones). RPE-drusen complex abnormal thinning volume (mm 3 ) is defined as the cumulative loss of volume from sites with volume loss of 2 or more standard deviations below the mean at each location based on the mapped SDOCT thicknesses from 15 No Apparent Aging subjects ( Figure 4 , blue tones). RPE-drusen complex abnormal thinning is thus the cumulative absolute value of deviation of RPE-drusen complex thickness measurements below the macular site-specific normal range. Detailed methods have been published for these analyses in a larger AMD and control population in the Age-Related Eye Disease Study 2 (AREDS2) Ancillary SDOCT Study.
A post hoc analysis was performed to compare OCT-based-drusen volume in intermediate AMD from this study (n = 46) to the baseline AREDS 2 Ancillary SDOCT Study Intermediate AMD group without geographic atrophy (n = 184). All volumes were calculated as described above over the same retinal area of 12 degrees (3.46 mm) diameter centered on the fovea. The mean and standard deviation of drusen volume per mm 2 were compared between groups using the Wilcoxon rank sum test.
Biostatistical Approach
We compared the 3 different functional assessments with their corresponding structural SDOCT assessment (by region)—visual acuity (foveal centered region, black ring in Figure 1 ), cone-mediated light sensitivity (6 regions, white rings in Figure 1 ), rod-mediated dark adaptation as assessed by rod intercept time (single superior region, green ring in Figure 1 )—and to SDOCT assessments for the entire macular region. Analyses were performed for AMD subgroups based on fundus appearance using the Clinical Classification System, across the entire study population.
Statistical analysis was performed using JMP Pro V11 (SAS, Cary, North Carolina, USA) and SAS V9.4 (SAS). Demographic and visual functional characteristics were compared between groups using χ 2 tests and analysis of variance (or nonparametric equivalents). Age-adjusted Spearman correlation coefficients were calculated for the association between functional and structural variables. Analysis of variance was also used to compare functional and structural variables between eyes with and without SDD, adjusted for age.
Results
There were no significant differences in sex distribution and racial makeup among the 4 groups. The overall sample was 39.6% male and 98.7% white. Patients with intermediate AMD were older than patients in other groups ( Table 1 ). After adjusting for age, there was no difference between groups in visual acuity (overall sample mean logMAR 0.00), cone-mediated sensitivity (overall sample mean 31.3 dB), or rod-mediated dark adaptation (overall sample mean 11.2 minutes) ( Table 1 ).
| Parameter | Overall Sample (N = 91) | No Aging (N = 15) | Normal Aging (N = 15) | Early AMD (N = 15) | Intermediate AMD (N = 46) | P Value |
|---|---|---|---|---|---|---|
| Age (y), M (SD) | 69.3 (6.5) | 66.1 (5.1) | 66.9 (6.0) | 68.9 (5.7) | 71.3 (6.8) | .016 |
| Sex, n (%) | .57 | |||||
| Male | 36 (39.6) | 5 (33.3) | 4 (26.7) | 6 (40.0) | 21 (45.7) | |
| Race, n (%) | .75 | |||||
| White | 89 (97.8) | 15 (100) | 14 (93.3) | 15 (100) | 45 (97.8) | |
| African-American | 1 (1.1) | 0 (0) | 1 (6.7) | 0 (0) | 0 (0) | |
| Other | 1 (1.1) | 0 (0) | 0 (0) | 0 (0) | 1 (2.2) | |
| Visual acuity, logMAR, M (SD) | 0.00 (0.12) | −0.03 (0.12) | 0.00 (0.08) | −0.06 (0.09) | 0.01 (0.13) | .24 |
| Cone-mediated sensitivity, a dB, M (SD) | 31.3 (1.9) | 31.9 (1.2) | 31.7 (3.1) | 31.3 (1.3) | 31.0 (1.8) | .35 |
| Rod-mediated dark adaptation, b rod intercept in minutes, M (SD) | 11.2 (4.8) | 10.3 (2.4) | 11.2 (3.8) | 11.0 (3.3) | 11.7 (6.5) | .82 |
a Mean sensitivity across zones 1–8.
When functional outcomes were analyzed by quantitative structural SDOCT findings across the entire group, visual acuity was not correlated with SDOCT volumes, except for a borderline association between higher logMAR (signifying worse visual acuity) and decreased volume of the inner retina ( Table 2 , r = −0.21, P = .05). Better cone-mediated sensitivity, however, was associated with greater RPE-drusen complex volume ( Table 2 , r = 0.34, P < .001) and less RPE-drusen complex abnormal thinning volume ( Table 3 , r = −0.31, P = .003). No other retinal volume variables were related to cone-mediated sensitivity. Larger rod intercept times (signifying delayed rod-mediated dark adaptation) correlated with lower RPE-drusen complex volume ( Table 2 , r = −0.34, P = .005) and greater RPE-drusen complex abnormal thinning volume ( Table 3 , r = 0.28, P = .02). No other retinal volume variables were related to rod-mediated dark adaptation.
| Visual Function | RPEDC Volume | P Value | Outer Retina Volume | P Value | Inner Retina Volume | P Value | Retina Volume | P Value |
|---|---|---|---|---|---|---|---|---|
| Visual acuity | 0.069 | .516 | −0.013 | .906 | −0.206 | .052 | −0.151 | .154 |
| Cone-mediated sensitivity a | 0.344 | .0009 | −0.175 | .099 | 0.062 | .564 | 0.072 | .500 |
| Rod-mediated dark adaptation b | −0.342 | .005 | −0.053 | .674 | −0.065 | .608 | −0.045 | .722 |
a Mean sensitivity across zones 1–8.
| Visual Function | Drusen Volume | P Value | RAT Volume | P Value |
|---|---|---|---|---|
| Visual acuity | 0.017 | .876 | 0.017 | .875 |
| Cone-mediated sensitivity a | ||||
| Mean | −0.045 | .671 | −0.312 | .003 |
| Minimum | −0.053 | .616 | −0.273 | .009 |
| Maximum | −0.050 | .639 | −0.328 | .002 |
| Rod-mediated dark adaptation b | −0.003 | .979 | 0.280 | .023 |
Stay updated, free articles. Join our Telegram channel

Full access? Get Clinical Tree


