Purpose
To investigate the relationships between peripheral vasculitis, ischemia, and vascular leakage in uveitis using ultra-widefield fluorescein angiography (FA).
Design
Cross-sectional, consecutive case series.
Methods
Consecutive ultra-widefield FA images were collected from 82 uveitis patients (82 eyes) in a single center. The extent of peripheral vasculitis, capillary nonperfusion, and vessel leakage were quantified. Parameters included: (1) foveal avascular zone area and macular leakage, (2) peripheral diffuse capillary leakage and ischemia, (3) peripheral vasculitis, and (4) leakage from neovascularization. Central macular thickness measurements were derived with optical coherence tomography. Main outcome measures were correlations between central and peripheral fluorangiographic changes as well as associations between visual function, ultra-widefield FA–derived metrics, and central macular thickness.
Results
Although central leakage was associated with peripheral leakage (r = 0.553, P = .001), there was no association between foveal avascular zone size and peripheral ischemia (r = 0.114, P = .324), regardless of the underlying uveitic diagnosis. Peripheral ischemia was, however, correlated to neovascularization-related leakage (r = 0.462, P = .001) and focal vasculitis (r = 0.441, P = .001). Stepwise multiple regression analysis revealed that a poor visual acuity was independently associated with foveal avascular zone size and central macular thickness (R 2 -adjusted = 0.45, P = .001).
Conclusions
We present a large cohort of patients with uveitis imaged with ultra-widefield FA and further describe novel methods for quantification of peripheral vascular pathology, in an attempt to identify visually significant parameters. Although we observed that relationships exist between peripheral vessel leakage, vasculitis, and ischemia, it was only macular ischemia and increased macular thickness that were independently associated with a reduced visual acuity.
The assessment and management of uveitis remains challenging. Although definitions of activity, quiescence, and response to treatment are typically defined by clinical criteria, fundus fluorescein angiography (FA) remains a widely used adjunct to aid diagnosis, stage disease activity, assess response to treatment, and detect complications such as ischemia and neovascularization.
Conventional FA is limited to a maximum 60-degree field when extended by creating a photomontage centered on the posterior pole. Although this is sufficient to detect macular and peripapillary involvement, the majority of the total retina will not have been seen. Early attempts at widefield retinal photography were able to extend the field of view to 90 degrees. However, this required the use of a contact lens combined with conventional photography. The subsequent application of the confocal scanning laser ophthalmoscope with a Staurenghi contact lens managed a wider 150-degree field. Nonetheless, the system that has changed the domain of widefield imaging is the commercially available and contactless system that provides up to a 200-degree field of view (Optos Panoramic 200MA; Optos PLC, Dunfermline, Scotland, UK).
Interestingly, the initial attempts at ultra-widefield FA using this system were on patients with uveitis, though this group has been largely overtaken by patients with retinal vascular diseases with peripheral involvement, such as retinal vein occlusions and diabetic retinopathy. The use of ultra-widefield FA in uveitis has many potential advantages. Fewer images are required to cover the retina, the intensity of light used is more tolerable for patients, and the optics of the system permit improved imaging through small pupils. Accurate peripheral documentation is also an advantage, for example in charting the progression of acute retinal necrosis or directing retinal photocoagulation for ischemia. The disadvantages of this system include the high hardware cost, the artificial hue of color images, and frequent artefacts secondary to eyelashes. In spite of these, peripheral assessment of vasculitis and ischemia is arguably the greatest benefit, permitting the documentation of peripheral retinal changes not previously possible with conventional FA. Indeed many types of uveitis appear to develop early or isolated peripheral vasculitis, a finding reinforced by experimental animal models where the peripheral retina is an initial site of cellular infiltration.
Although previous reports have demonstrated a clinical benefit of ultra-widefield FA in treatment decisions for uveitis, no quantitative analyses of the features observed have been published. In this paper we present a large cohort of patients with uveitis undergoing ultra-widefield FA and focus upon the correlation between central and peripheral changes in terms of ischemia and vascular leakage. We also explore the associations among visual function, ultra-widefield FA–derived metrics, and optical coherence tomography–derived retinal thickness.
Methods
Inclusion Criteria and Data Collection
In this cross-sectional, consecutive case series, imaging data were collected retrospectively from uveitis patients who underwent ultra-widefield FA over a 12-month time period in a single center (tertiary-referral uveitis clinics). Approval for data collection and analysis was obtained from the institutional review board of Moorfields Eye Hospital, and the study adhered to the tenets set forth in the Declaration of Helsinki.
Patients with a primary diagnosis of uveitis were included in the study. Demographic and clinical data, such as age, sex, best-corrected visual acuity, and etiology, were collected. A single eye from each patient was included for analysis. In cases of bilateral involvement the right eye was included. Exclusion criteria were the presence of significant anterior segment opacities (corneal scars, cataract) and other ocular comorbidities such as retinal arterial or venous occlusions, age-related macular degeneration, and inherited macular disease.
Acquisition and Analysis of Fluorescein Angiograms
All ultra-widefield FA images were acquired with the Optos C200 MA ultra-widefield retinal imaging system (Optos PLC, Dunfermline, Scotland, UK), which allows imaging of up to 200 degrees (82%) of the retina in a single image. All patients received a standard infusion of 5 mL of 20% sodium fluorescein through the antecubital vein. One early- to mid-phase image (at 20–40 seconds) and a second late-phase image (at 5–7 minutes) were chosen for analysis. The early-to mid-phase image was graded for peripheral ischemia and foveal avascular zone size, and the late-phase image for diffuse capillary leakage, focal vasculitis, and leakage from neovascularization. All ultra-widefield FA images were exported as.tiff files and analyzed on Photoshop CS4 software (Adobe Systems, San Jose, California, USA). No image manipulation was performed prior to grading.
Quantitative analysis of ultra-widefield fluorescein angiography images
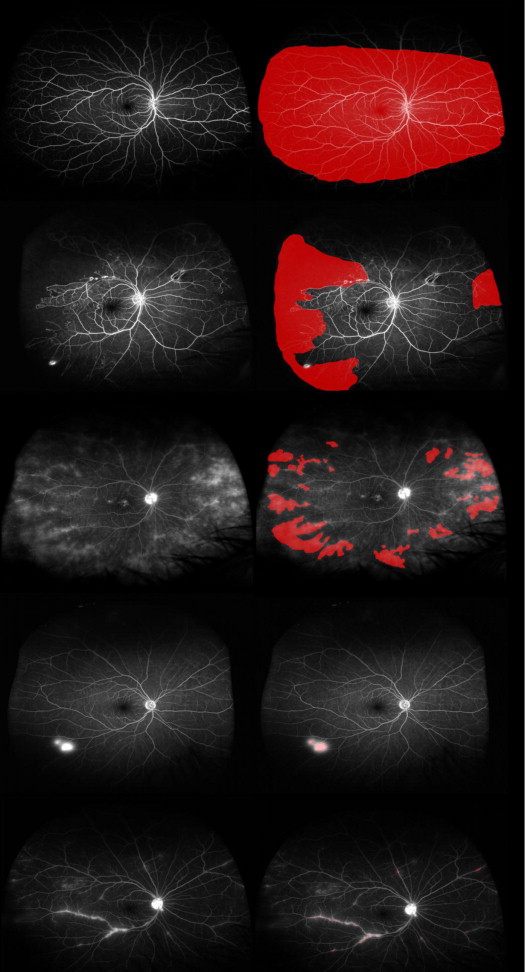
Owing to the spherical curvature of the eye, ultra-widefield images commonly exhibit blurred areas in the far periphery when the central portion of the image is in focus. Furthermore, Optos imaging of the far superior and inferior peripheral retina is less complete compared with imaging of the temporal and nasal retina. In order to address these issues, the total area was defined as the area in which retinal vasculature was in sharp focus, thereby allowing accurate visualization of smaller retinal capillaries ( Figure 1 , First row). Because these blurred areas are excluded from total area measurements, the resultant image is smaller than the 200-degree scanning angle that can be achieved by the ellipsoidal mirror within the Optos imaging system. However, this exclusion reduces underestimation of the peripheral ischemic index resulting from inclusion of retina where capillary nonperfusion cannot be visualized.
Quantification of macular ischemia and leakage
Foveal avascular zone boundaries were manually delineated and area measurements were calculated and analyzed in pixels but were subsequently converted into square millimeters (mm 2 ) for the purpose of clinical interpretation, using a scale factor based on the assumption that the disc area was 2.7 mm 2 . Similarly, areas of diffuse capillary leakage in late-phase angiograms were also delineated.
Quantification of peripheral ischemia, leakage, focal vasculitis, and neovascularization-related leakage
Areas of ischemia were manually delineated in early-phase angiograms, as were areas of leakage and focal vasculitis in late-phase angiograms. A peripheral ischemic index was calculated from the early-to mid-phase FA using previously described methodology. Briefly, areas of capillary nonperfusion, outside the temporal vascular arcades, were expressed as a percentage of the total image area in pixels ( Figure 1 , Second row).
A peripheral leakage index was adapted from the ischemic index; areas of leakage outside the temporal vascular arcades were quantified in pixels and expressed as a percentage of the total area ( Figure 1 , Third row). Similarly, a neovascularization leakage index was calculated by expressing the area of neovascularization leakage as a percentage of the total image area ( Figure 1 , Fourth row), as well as a macular leakage index expressing the areas of diffuse leakage within the arcades as a percentage of the total area.
Areas of focal peripheral vasculitis were also delineated in late-phase angiograms ( Figure 1 , Fifth row). A peripheral vasculitis index was calculated as a percentage of the total area.
Optical Coherence Tomography–Derived Measurements of Retinal Thickness
Spectral-domain optical coherence tomography scans that were acquired on the same day as ultra-widefield FA (3D OCT-2000; Topcon, Oakland, New Jersey, USA) were available in 56 patients. Automated central macular thickness measurements were calculated using the Topcon’s proprietary FastMap software and recorded in micrometers (μm) for analysis.
Statistical Analysis
Clinical and imaging data were analyzed with frequency and descriptive statistics. Snellen visual acuities were converted to logMAR (logarithm of the minimal angle of resolution) visual acuity for the purposes of statistical analysis. Normality of the variables was examined using histograms. Their distribution was positively skewed and we therefore used nonparametric tests, including the Mann-Whitney U test, Kruskal-Wallis, and Spearman correlation coefficient (r), to assess their relationship. A P value of <.05 was considered to be statistically significant. All statistics were calculated using SPSS software version 16.0 for Windows (SPSS, Inc, Chicago, Illinois, USA).
Results
Patients with a diagnosis of uveitis who underwent ultra-widefield FA over a period of 12 months were screened (March 2012-March 2013). Of the 87 ultra-widefield FAs performed, 4 patients were excluded because of poor image quality and 1 patient because of the presence of wet age-related macular degeneration.
Baseline Characteristics
Eighty-two eyes from 82 patients were analyzed. The median age was 45 years (range: 19–85, interquartile range [IQR] = 22) and 37 patients were female (45.1%). The median best-corrected visual acuity was 0.20 logMAR (range: −0.10 to 1.8, IQR = 0.30). Sixty-two patients (75.6%) had bilateral and 20 (24.4%) unilateral disease. Thirty-seven patients (45.1%) were on corticosteroids or other immunosuppressive treatments. Twenty-seven patients (32.9%) had clinically active disease at the time of data acquisition. Thirty-eight patients had a diagnosis of idiopathic uveitis (46.3%), 26 patients (31.7%) had a diagnosis of uveitis secondary to tuberculosis, 7 (8.5%) were diagnosed with sarcoidosis, 2 (2.4%) with rheumatoid arthritis, 2 (2.4%) with multiple sclerosis, 2 (2.4%) with systemic lupus erythematosus (2.4%), 2 patients (2.4%) had acute retinal necrosis, 1 patient (1.2%) had Behçet disease, 1 (1.2%) had vasculitis related to cytoplasmic antineutrophil cytoplasmic antibodies, and 1 patient (1.2%) had uveitis secondary to human immunodeficiency virus. In terms of the anatomic distribution of uveitis, 9 patients (11%) had anterior uveitis, 16 (19.5%) had intermediate uveitis, 37 (45.1%) had posterior uveitis, and 20 (24.4%) had panuveitis.
Quantitative Analysis of Ultra-widefield Fluorescein Angiography Images
From the total of 82 cases, peripheral ischemia was demonstrated in 29 cases (35.3%), diffuse capillary peripheral leakage in 26 cases (31.7%), focal peripheral vasculitis in 24 cases (29.2%), neovascularization-related leakage in 13 cases (15.8%), and macular leakage in 21 cases (25.6%). Descriptive statistics of the segmented areas and their respective indices are summarized in Table 1 and cross-tabulated against etiology in Table 2 .
| N | Median (mm 2 ) | Range | Interquartile Range | Index (%) (Median) | |
|---|---|---|---|---|---|
| Total area | 82 | 684.62 | 430.57–915.52 | 162.44 | |
| Foveal avascular zone | 82 | 0.41 | 0.11–13.39 | 0.36 | |
| Peripheral ischemia | 29 | 67.02 | 9.85–275.73 | 75.55 | 9.23 |
| Peripheral diffuse leakage | 26 | 107.47 | 0.57–549.20 | 209.74 | 16.68 |
| Peripheral focal vasculitis | 24 | 0.65 | 0.14–4.60 | 0.87 | 0.04 |
| Neovascularization-related leakage | 13 | 5.54 | 1.19–55.48 | 14.30 | 0.67 |
| Macular leakage | 21 | 15.17 | 2.19–70.19 | 27.25 | 2.27 |
| Idiopathic | Tuberculosis | Sarcoidosis | Other | |
|---|---|---|---|---|
| N | 38 | 26 | 7 | 11 |
| Foveal avascular zone (mm 2 ) | 0.46 | 0.40 | 0.26 | 0.39 |
| Peripheral ischemia (mm 2 ) | 50.49 | 69.49 | 159.55 | 98.88 |
| Ischemic index (%) | 6.99 | 9.81 | 21.69 | 13.97 |
| Peripheral diffuse leakage (mm 2 ) | 107.47 | 81.16 | 150.98 | 362.04 |
| Peripheral leakage index (%) | 17.59 | 10.58 | 20.14 | 50.67 |
| Peripheral focal vasculitis (mm 2 ) | 0.96 | 0.60 | 0.52 | 1.92 |
| Peripheral vasculitis index (%) | 0.03 | 0.03 | 0.02 | 0.10 |
| Neovascularization-related leakage (mm 2 ) | 8.13 | 5.54 | 2.96 | 8.17 |
| Neovascularization leakage index (%) | 1.05 | 0.67 | 0.40 | 1.15 |
| Macular leakage (mm 2 ) | 12.99 | 18.97 | 17.39 | 11.14 |
| Macular leakage index (mm 2 ) | 2.17 | 2.64 | 2.27 | 1.46 |
Stay updated, free articles. Join our Telegram channel

Full access? Get Clinical Tree


