Purpose
To determine economically efficient referral criteria for a preschool vision-screening program using autorefraction.
Design
Retrospective economic evaluation of a screening protocol.
Methods
Preschoolers in 2 cities received preschool-based Retinomax screening with a standard referral protocol and as-needed comprehensive eye examinations in 2012–2013. Positive predictive values and referral criteria that minimized cost per case detected were derived using data from San Francisco. These modeled referral criteria were then retrospectively tested for cost-effectiveness against other common criteria in Oakland with sensitivity analysis. Cases were defined by American Association for Pediatric Ophthalmology and Strabismus (AAPOS) criteria for amblyopia risk factors. The perspective was a third-party payer. Costs were obtained from a regional insurance provider.
Results
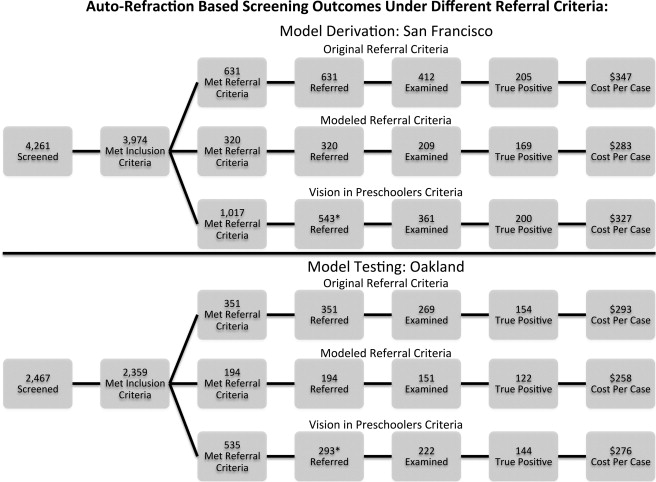
In San Francisco, 3974 children were screened, 631 referred, and 412 examined. Forty-eight percent of referrals, 301 children, met more than 1 of the referral criteria. Positive predictive values ranged from 7% for myopia to 56% for astigmatism. In Oakland, 2359 children were screened and 269 were examined. When applying the modeled referral criteria derived from San Francisco to the population of Oakland, the cost per case detected was $258. When compared in Oakland, the original referral criteria and criteria based on Vision in Preschoolers study cost, respectively, $424 and $371 per additional case detected. The modeled referral criteria had a lower cost per case detected across sensitivity analysis.
Conclusions
More stringent referral criteria may reduce the cost per case detected in vision screening and allow more at-risk children to be detected with the same financial resources.
The Retinomax autorefractor (Righton, Tokyo, Japan) is one of the recommended instrument-based vision screening methods for preschool children. This instrument has gained popularity in recent years on the US West Coast, where it was originally adopted for population-based screening in San Diego with subsequent programming partnerships in Los Angeles and San Francisco. Operating characteristics of this device have been previously described. Briefly, the machine has an infrared camera that takes at least 8 refractive measurements on each eye independently at a working distance of approximately 4 cm. These measurements are then combined to yield an average refractive error with a confidence score.
Choosing the optimal referral criteria for any screening test involves a difficult cost-benefit analysis. Given limited resources, screening programs may desire referral criteria that detect the greatest number of children at risk of amblyopia per dollar spent. Previous studies investigating Retinomax sensitivity, specificity, positive predictive values, and receiver operating characteristic curves across a diverse range of referral criteria have ignored costs. Conversely, studies investigating costs per case detected by Retinomax screening have chosen static referral criteria and ignored how changes in referral criteria may alter cost effectiveness.
In this study, we investigate how cost per case detected varies with changes in referral criteria in an urban preschool vision-screening program. We use data from a screening program in San Francisco to retrospectively model referral criteria that maximize cases detected per dollar spent. We then test these modeled criteria for validity against other established referral criteria in Oakland across a range of follow-up costs in order to determine which referral criteria are most economically efficient.
Methods
This is a retrospective cohort study investigating referral criteria optimization of a screening protocol. The population includes preschool children participating in an autorefraction-based screening program implemented by Prevent Blindness Northern California, a community nonprofit, in San Francisco and Oakland. The perspective is that of a third-party health-care provider such as a community health organization. The study received institutional review board approval from the University of California San Francisco for retrospective cost-effectiveness analysis of screening data and was conducted in accordance with the Health Insurance Portability and Accountability Act.
Lay vision screeners performed Retinomax autorefraction screenings from August 24, 2012 through May 3, 2013 in public, Head Start, and county preschools for low-income families. Demographic information was collected at the time of screening. Patients who met the pre-established referral criteria were referred for a free comprehensive eye examination ( Table 1 ). The original referral criteria were determined by a consensus panel review of the literature and were largely based on Vision in Preschoolers criteria with a less inclusive myopia threshold. Comprehensive eye examination included cycloplegic retinoscopy and was conducted by a licensed optometrist in a mobile eye van at the preschool on a separate visit.
| Type of Refractive Error | Referral Criteria (Diopters): Based on Non–Cycloplegic Autorefraction Screening | Case Definition (Diopters): Based on Cycloplegic Retinoscopy | |||
|---|---|---|---|---|---|
| Original Referral Criteria | Vision in Preschoolers Criteria | Modeled Referral Criteria | Age 31–48 Months | Age Over 48 Months | |
| Hyperopia | ≥1.50 | ≥1.50 | ≥2.25 | ≥4.25 | ≥3.75 |
| Myopia | ≥3.50 | ≥3.00 | ≥5.25 | ≥3.25 | ≥1.75 |
| Astigmatism | ≥1.50 | ≥1.75 | ≥2.00 | ≥2.25 | ≥1.75 |
| Anisometropia (hyperopia/mixed) | ≥1.50 | ≥2.00 | ≥3.25 | ≥2.25 | ≥1.75 |
| Anisometropia (myopia) | ≥2.00 | ≥2.00 | ≥4.50 | ≥2.25 | ≥1.75 |
| Anisometropia (astigmatism) | ≥1.00 | ≥2.00 | ≥2.00 | ≥2.25 | ≥1.75 |
True positive cases were defined as children meeting the 2013 American Association for Pediatric Ophthalmology and Strabismus Vision Screening Committee guidelines for amblyopia risk factors based on cycloplegic retinoscopy. Inclusion criteria were limited to children screened at targeted preschools. Children were excluded from the study if they were previously prescribed corrective glasses, if they had a screening confidence score less than 8, or if they were referred for follow-up examination for nonrefractive criteria such as suspected strabismus. There was no follow-up on children who passed their initial screening. Owing to its larger population, San Francisco was used for calculations of positive predictive value and modeling referral criteria that optimized cost per case detected. The referral criteria found to be most economically efficient in San Francisco were then tested in Oakland against an existing database of screening outcomes to determine validity against other established referral criteria.
Model Derivation—San Francisco
We investigated the positive predictive value for each of 6 referral categories across a range of referral cut points. Referral categories included hyperopia, myopia, astigmatism, hyperopic and mixed anisometropia, myopic anisometropia, and astigmatic anisometropia. Children could be referred for multiple indications and may be included in the positive predictive analyses for more than 1 category of refractive error.
Cost per case detected was defined as the total cost for screening and follow-up examinations divided by the number of true cases detected. Costs were determined in United States dollars as $6 per vision screening and $115 per diagnostic eye examination based on regional insurance provider reimbursement data for 2013. Costs associated with treatment for amblyopia and amblyopia risk factors such as glasses prescriptions were not included in this study.
As we have no follow-up data on children who did not meet original referral criteria, we conducted an analysis of the marginal cost per case detected at the program’s original referral criteria for all 6 of the original categories for refractive error. For example, with hyperopia, we calculate the cost per additional child detected in changing the referral criteria from 1.75 diopters (D) to the original referral limit of 1.50 D. We speculate that changes to even more inclusive referral criteria, which we cannot directly analyze, would tend to detect a smaller proportion of true-positive children and be less cost effective.
We next determined the optimal modeled referral criteria using a global optimization algorithm with an evolutionary strategy. This model was able to adjust multiple referral criteria simultaneously and accounted for the fact that a single child may meet multiple referral indications. The program was run in Excel Solver. An evolutionary model was chosen because it allows for iterative improvements in estimation of optimal referral criteria while accounting for the possibility of a nonsmooth function. We assumed that follow-up rates for comprehensive examinations would not change among referred children unless a child no longer met more stringent referral criteria, in which case such children would not be referred and were assumed to no longer receive a comprehensive eye examination.
Model Verification—Oakland
The modeled referral criteria from the screening results in San Francisco were evaluated in Oakland against other established referral criteria. The case definition for true positives and cost assumptions were the same as those modeled in San Francisco. Average and incremental cost per case in Oakland was also determined under the 3 analyzed referral criteria. As the modeled referral criteria were least costly, we used this as the baseline for incremental cost calculations of additional cases detected with more expansive referral criteria.
The Vision in Preschoolers criteria refers more children for myopia than the program’s original referral criteria. Accordingly, children who would have been referred under Vision in Preschoolers criteria but not referred under the original referral criteria were never offered follow-up examinations. We exclude the costs and effects of referring these children in our formal cost-effectiveness analysis of the Vision in Preschoolers referral criteria.
Sensitivity Analysis
In conducting our sensitivity analysis, we found that the ratio of screening cost to follow-up cost was the key variable for determining how referral thresholds affect cost effectiveness. If follow-up costs are relatively low, false referrals have less effect on costs per case detected. In contrast, when follow-up costs become much more expensive than screening, the reverse is true and a higher positive predictive value at screening becomes more cost effective. In our baseline scenario the cost of an examination was approximately 20 times the cost of a screening test. We varied this ratio across a sensitivity range, modeling exams that were 10–30 times the price of a screening test.
Results
Model Derivation—San Francisco
During the study period, 4261 children were present for Retinomax screening, of which 3974 preschool children were included in analysis for San Francisco. Of those excluded, 213 were excluded for inability to be screened, 62 for previous glasses, and 12 for strabismus. Under the original programming guidelines, 631 children met referral criteria and were offered follow-up examinations. Of these 631, 301 children (48%) met referral criteria for multiple categories of refractive error. Of children meeting multiple referral criteria, 226 (36%) met 2 referral criteria, 63 (10%) met 3 referral criteria, and 12 (2%) met 4 referral criteria. Of the remaining 330 children, 40 (6%) met criteria for hyperopia, 181 (29%) for astigmatism, 37 (6%) for myopia, 31 (5%) for hyperopic or mixed anisometropia, 32 (5%) for astigmatic anisometropia, and 9 (1%) for myopic anisometropia. Of those offered follow-up, 412 (65%) received comprehensive examinations with cycloplegic retinoscopy in the eye van. These 412 preschoolers had an average age of 49 months and were largely of Asian or Hispanic ethnic background ( Table 2 ).
| Screened | Examined | True Positives | |||||||
|---|---|---|---|---|---|---|---|---|---|
| San Francisco | Oakland | P Value | San Francisco | Oakland | P Value | San Francisco | Oakland | P Value | |
| Number of children | 3974 | 2359 | N/A | 412 | 269 | N/A | 205 | 154 | N/A |
| Mean age, months (±standard deviation) | 50.2 ± 7.3 | 51.5 ± 7.0 | <.001 | 49.3 ± 6.8 | 50.1 ± 7.3 | .16 | 50.9 ± 6.8 | 52.5 ± 6.5 | .03 |
| Sex, n (%) | |||||||||
| Male | 2011 (51) | 1164 (49) | .61 | 184 (45) | 132 (49) | .19 | 89 (43) | 81 (53) | .07 |
| Female | 1960 (49) | 1193 (51) | 228 (55) | 136 (51) | 116 (57) | 72 (47) | |||
| Not recorded | 3 (0) | 2 (0) | 0 (0) | 1 (0) | 0 (0) | 1 (1) | |||
| Ethnicity, n (%) | |||||||||
| Asian/Pacific Islander | 1428 (36) | 372 (16) | 130 (32) | 39 (15) | 44 (21) | 20 (13) | |||
| Hispanic | 1352 (34) | 1255 (53) | 215 (52) | 175 (65) | 130 (63) | 101 (66) | |||
| African American | 471 (12) | 617 (26) | <.001 | 44 (11) | 50 (19) | <.001 | 22 (11) | 28 (18) | .07 |
| White | 305 (8) | 23 (1) | 7 (2) | 1 (0) | 3 (1) | 1 (1) | |||
| Other | 375 (9) | 89 (4) | 16 (4) | 3 (1) | 6 (3) | 3 (2) | |||
| Not recorded | 43 (1) | 3 (0) | 0 (0) | 1 (0) | 0 (0) | 1 (1) | |||
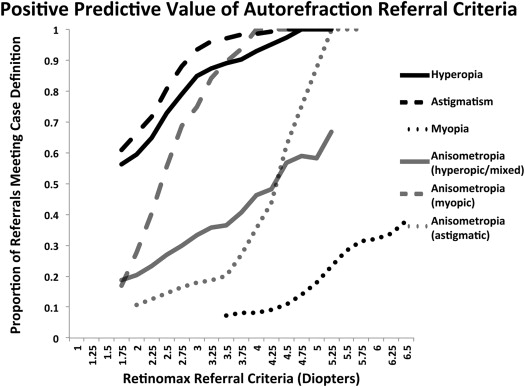
Referral rates and positive predictive values were determined across a range of referral cut points. Hyperopia and astigmatism were the most common reasons for referral and had relatively high positive predictive values (PPV), increasing from slightly over 50% at original referral criteria to over 90% at the strictest referral criteria analyzed. In contrast, myopia referrals had low PPV across the entire range of referral cut points investigated, with values ranging from 7.3% at a referral of −3.50 D up to 50% at a referral of −6.50 D ( Figure 1 ).
Few additional cases were detected in the marginal analysis of the original referral criteria. In the quarter-diopter change from the immediately more stringent referral criteria to the screening criteria implemented in the original program, only the change in hyperopia and astigmatism referral criteria showed an increase in number of cases detected, with a marginal cost per additional case of $460 and $838, respectively. The quarter-diopter change to the original myopia and the anisometropic referral criteria led to additional examinations without additional true positives detected ( Table 3 ).
| Additional Children Examined | Additional Cases Detected | Marginal Positive Predictive Value | Marginal Cost per Additional Case | |
|---|---|---|---|---|
| Hyperopia | 20 | 5 | 25% | $460 |
| Astigmatism | 51 | 7 | 14% | $838 |
| Myopia | 10 | 0 | 0% | – |
| Anisometropia (hyperopic/mixed) | 18 | 0 | 0% | – |
| Anisometropia (astigmatic) | 64 | 0 | 0% | – |
| Anisometropia (myopic) | 7 | 0 | 0% | – |
Of the 412 children examined in San Francisco, 205 met case definition. The average cost per case detected was $347. We then determined the modeled referral criteria in San Francisco with a Monte Carlo evolutionary algorithm ( Table 1 ). Applying these referral criteria to San Francisco would have led to a decrease to 320 referrals, 209 examinations, and 169 detected children at a cost per case of $283 ( Figure 2 ).