Purpose
To characterize perifoveal intraretinal cavities observed around full-thickness macular holes (MH) using en face optical coherence tomography and to establish correlations with histology of human and primate maculae.
Design
Retrospective nonconsecutive observational case series.
Methods
Macular en face scans of 8 patients with MH were analyzed to quantify the areas of hyporeflective spaces, and were compared with macular flat mounts and sections from 1 normal human donor eye and 2 normal primate eyes ( Macaca fascicularis ). Immunohistochemistry was used to study the distribution of glutamine synthetase, expressed by Müller cells, and zonula occludens-1, a tight-junction protein.
Results
The mean area of hyporeflective spaces was lower in the inner nuclear layer (INL) than in the complex formed by the outer plexiform (OPL) and the Henle fiber layers (HFL): 5.0 × 10 −3 mm 2 vs 15.9 × 10 −3 mm 2 , respectively ( P < .0001, Kruskal-Wallis test). In the OPL and HFL, cavities were elongated with a stellate pattern, whereas in the INL they were rounded and formed vertical cylinders. Immunohistochemistry confirmed that Müller cells followed a radial distribution around the fovea in the frontal plane and a “Z-shaped” course in the axial plane, running obliquely in the OPL and HFL and vertically in the inner layers. In addition, zonula occludens-1 co-localized with Müller cells within the complex of OPL and HFL, indicating junctions in between Müller cells and cone axons.
Conclusion
The dual profile of cavities around MHs correlates with Müller cell morphology and is consistent with the hypothesis of intra- or extracellular fluid accumulation along these cells.
En face optical coherence tomography (OCT) is an emerging imaging modality that facilitates the assessment of retinal structures transversely. Available since 2006 on certain OCT devices, the first retinal transverse scans were difficult to interpret, as only plane sections of the concave retina were available. More recently, spectral-domain OCT technology with advanced alignment algorithms have adjusted sections to a reference curve, which has allowed layer-by-layer retinal imaging and provided a new investigation tool for a range of retinal disorders.
The foveal microstructure is formed by a dense compaction of cone photoreceptors and their projected axons, which are intertwined with retinal glial Müller cells and follow a centrifugal course toward the inner layers at the edges of the fovea. Retinal glial Müller cells are critical for retinal homeostasis, providing metabolic support to neighboring neural cells, delivering neuroactive substances and retinoids to cones, and recycling waste compounds. Müller cells are 5 times more abundant in the macula than in the peripheral retina. The “Z-shape” morphology of perifoveal Müller cells has been observed on histologic sections in both animal and human models, where the cells adopt 3 consecutive orientations. From the internal limiting membrane, perifoveal Müller cells run vertically to the inner nuclear layer, then turn inward toward the foveal center across the outer plexiform layer and the Henle fiber layer, where their course is oblique and almost horizontal in the internal portion of the foveal pit. Then, at the junction with the outer nuclear layer, they take a vertical orientation again to reach the external limiting membrane. At the external limiting membrane of the primate retina, Omri and associates have previously shown that Müller cells and photoreceptors are bound by tight-like junctions, where the proteins occludin and zonula occludens-1 are expressed.
Intraretinal fluid accumulation disrupts the foveal architecture, presenting an opportunity to examine its components in better detail. In full-thickness macular hole (MH), intraretinal cysts are frequently observed on OCT around the edges of the hole. On fluorescein angiography, no vascular leakage or filling of the cysts is usually observed. This suggests that they originate from a metabolic dysfunction and supports the hypothesis of Müller cells’ implication in the pathogenesis of full-thickness MH.
In this study, we use en face OCT to characterize and quantify, layer by layer, the perifoveal cystic cavities occurring around full-thickness MHs. To support the OCT findings, we used human and nonhuman primate macular flat mounts and sections to visualize Müller cells stained with a glial marker.
Methods
This retrospective nonconsecutive observational case series adhered to the tenets of the Declaration of Helsinki. The need for approval was waived by the Institutional Review Board of the Nuovo Regina Margherita Hospital, owing to the study’s retrospective nature and the restriction of the analysis to retinal imaging. The use of animals in this study adhered to the ARVO statement for Ophthalmic and Vision Research and protocols were approved by the ethics committee of the Paris Descartes University.
Subjects
Eight eyes from 8 patients presenting with a full-thickness MH surrounded by cystoid cavities were retrospectively included, and high-quality images were reviewed. These eyes had been imaged between May 2011 and June 2014 at the clinical practice Centro Italiano Macula, Rome, Italy. Cases with media opacities, or any macular disorder other than full-thickness MH (such as epiretinal membrane, choroidal neovascularization, macular atrophy, macular edema of vascular, diabetic, or inflammatory origin), were excluded. All patients had been evaluated with comprehensive ophthalmologic examination including full medical history, best-corrected visual acuity testing, slit-lamp biomicroscopy, and funduscopy. After pupillary dilation, OCT imaging was performed using either the RTVue-100 (Optovue, Fremont, California, USA) or Spectralis (Heidelberg Engineering, Heidelberg, Germany). Full-thickness MH staging was based on the Gass classification system.
En Face Optical Coherence Tomography Acquisition
Spectralis images of the macular cube of 20 × 20 degrees (corresponding to approximately 3.6 mm × 3.6 mm) composed of 145 fast horizontal B-scans had been acquired, with the Automatic Real-Time mode averaging 2 images for each scan. Within the Spectralis device, the best-fitting segmentation was applied to all images, and the internal limiting membrane reference was preferred over the Bruch membrane reference for both inner and outer retinal layers, in order to compensate for the high angulation between the full-thickness MH edges and the plane of the Bruch membrane. The thickness of en face sections had been set to 20 μm.
On the RTVue-100 device, OCT scans had been acquired using the “3D reference” protocol. A total of 141 high-speed B-scans were performed inside a 7 × 7-mm-square area projected on the macula, without eye tracking. The total acquisition time was 4 seconds. For the segmentation of the resulting virtual macular cube, en face images of inner retinal sections were obtained using the internal limiting membrane as reference (except for Case 2, where the inner plexiform layer was used), whereas sections of the outer retinal layers were obtained using the retinal pigment epithelium as reference, in the “RPEfit” mode. The thickness of en face sections varied between 19 μm and 25 μm.
Scans Selected for Analysis
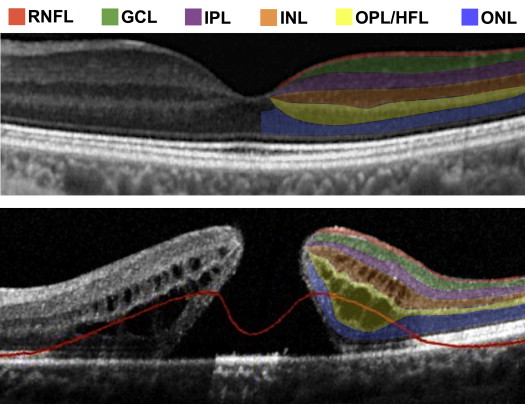
Since hyporeflective cavities observed at the edges of full-thickness MHs were concentrated inside the inner nuclear layer and inside the complex formed by the outer plexiform and Henle fiber layers, en face OCT scans from these 2 regions were retained for analysis ( Figure 1 ). For each layer, a scan with the highest possible quality was selected among those located centrally in the stack, and was used to measure the areas of hyporeflective spaces in the frontal plane.
Quantitative Measure of Cavity Areas
In order to obtain comparable images between the RTVue-100 and the Spectralis, a TIFF image centered on the fovea corresponding to 3.6 × 3.6 mm was extracted from the en face scans obtained with the 2 devices. These en face OCT scans were analyzed using Image J software (Version 1.48q, Wayne Rasband; National Institutes of Health, Bethesda, Maryland, USA). Briefly, after conversion to 8-bit grayscale images, hyporeflective spaces were identified via the built-in “Adjust threshold” function (with grayscale intensity threshold set to 64). On the resulting binary images, all identified hyporeflective spaces were transformed to white areas on a black background. A list of surfaces was obtained using the base package particle analysis function. In order to reduce noise, surfaces greater than 0.001 mm 2 was set as the threshold for inclusion in particle analysis calculations. Two statistical analyses were then performed. First, the distributions of cavity areas in the inner nuclear layer and in the complex of the outer plexiform and Henle fiber layers were compared within each subject using a Mann-Whitney-Wilcoxon rank sum test for non-normal distributions. Second, overall comparison of cavity areas between the inner nuclear layer and the complex of the outer plexiform and Henle fiber layers was performed by a Kruskal-Wallis test and a multiple comparison post-test. Statistical analyses were performed on R Software (Version 3.1.1; R Foundation for Statistical Computing, R Core Team, 2014, Vienna, Austria; http://www.R-project.org/ ) using the “ggplot2” package for graphical representations and the “pgirmess” package for post-tests (Version 1.5.9, Patrick Giraudoux, 2014; http://CRAN.R-project.org/package=pgirmess ). P values inferior to .05 were considered statistically significant.
Supportive Evidence: Immunochemistry of Human and Nonhuman Primate Retina
Two eyes from 2 monkeys ( Macaca fascicularis ) were used. Animals were sacrificed by CO 2 inhalation for other purposes. One healthy human eye from a patient with high-grade mucoepidermoid carcinoma of the tarsal conjunctiva extending into the orbit and requiring orbital exenteration was obtained from the ocular pathology laboratory at Jules Gonin Eye Hospital, in accordance with regulations of the Lausanne University Institutional Review Board.
Cross-sections of the human retina were stained with anti–glutamine synthetase MAB 302 antibodies (Chemicon Technology, Merck Millipore, Billerica, Massachusetts, USA). Sections from 1 primate retina were co-stained with anti–glutamine synthetase MAB 302 and anti–zonula occludens-1 antibodies (Santa Cruz Biotechnology Inc, Santa Cruz, California, USA) and counterstained with 4′,6-diamidino-2-phenylindole (DAPI) (Sigma Aldrich, St Louis, Missouri, USA). The other primate retina was flat-mounted after staining with anti–glutamine synthetase MAB 302 antibodies. Images were captured using a fluorescence microscope (see Supplemental Material, available at AJO.com , for the detailed protocol).
Results
En Face Optical Coherence Tomography of Perifoveal Cystoid Cavities
Mean age of the 8 included subjects (4 female, 4 male) was 69.3 ± 8.1 years. Two patients had stage 2, 2 had stage 3, and 4 had stage 4 full-thickness MH. When considering the 8 cases together, the mean area of hyporeflective spaces was significantly lower in the inner nuclear layer than in the complex formed by the outer plexiform and the Henle fiber layers (5.3 × 10 −3 mm 2 vs 15.9 × 10 −3 mm 2 , P < .0001, Kruskal-Wallis test). As shown in Figure 2 , the statistical distribution and mean value of cavity areas also differed within each subject, where significantly smaller cavities were observed in the inner nuclear layer than in the complex of the outer plexiform and the Henle fiber layers (Mann-Whitney-Wilcoxon rank sum test). Patient characteristics and area measures are reported in the Table . In Figure 2 and Figure 3 it is clear that the hyporeflective spaces also differed in shape: their aspect was rounded in the inner nuclear layer, while the cavities appeared elliptical and radially oriented in the outer plexiform and Henle fiber layers.
| Subject | Age (y) | Sex | OCT Device | Macular Hole Diameter (μm) | Posterior Vitreous Detachment | Macular Hole Stage | Mean Cavity Area (×10 −3 mm 2 ) | P Value | |
|---|---|---|---|---|---|---|---|---|---|
| Inner Nuclear Layer | Outer Plexiform/Henle Fiber Layers | ||||||||
| Case 1 | 69 | F | RTVue | 673 | No | 3 | 6.4 | 21.8 | <.0001 a |
| Case 2 | 71 | F | RTVue | 787 | No | 3 | 5.2 | 13.1 | .0003 a |
| Case 3 | 57 | F | RTVue | 560 | Yes | 4 | 5.9 | 20.5 | <.0001 a |
| Case 4 | 62 | F | RTVue | 350 | No | 2 | 3.6 | 27.5 | .0005 a |
| Case 5 | 80 | M | RTVue | 385 | Yes | 4 | 8.2 | 23.8 | <.0001 a |
| Case 6 | 63 | M | Spectralis | 556 | Yes | 4 | 2.5 | 15.1 | <.0001 a |
| Case 7 | 74 | M | Spectralis | 341 | No | 2 | 4.3 | 10.9 | <.0001 a |
| Case 8 | 78 | M | Spectralis | 238 | Yes | 4 | 4.3 | 9.1 | <.0001 a |
| Mean | 69.3 | – | – | 486 | – | – | 5.0 | 15.9 | <.0001 b |
a Mann-Whitney-Wilcoxon rank sum test.
Examination of the stack of en face OCT sections within the inner nuclear layer showed that most cavities could be followed along a vertical axis; an example of this is shown in Figure 4 . Superimposition of neighboring consecutive sections demonstrated that these smaller, rounded hyporeflective spaces formed parallel vertical bundles. In addition, vertical elongation of hyporeflective cavities in the inner nuclear layer was visible on B-scans, although not always visualized entirely because of the lack of strict parallelism with the section plane ( Figure 1 ).
Figure 3 also showed that in the complex of the outer plexiform and the Henle fiber layers the elongated hyporeflective spaces adopted a radial or “petalloid” pattern, delineated by thin, hyperreflective walls. In addition, OCT B-scans indicated that these outer retinal cavities originated above the external limiting membrane and respected this hyperreflective band across the portion of the macula affected by morphologic changes around the full-thickness MH. The outermost region of the neurosensory retina encompassing the photoreceptor inner and outer segments was indeed devoid of hyporeflective cavities on B-scans ( Figure 1 ). On en face scans, this region appeared as a homogenous hyperreflective ring forming the edges of the full-thickness MH that did not contain hyporeflective spaces ( Figure 3 ).
Morphologic Analysis of Müller Cells in Human and Primate Maculae
In humans and nonhuman primates, Müller cells are extremely dense in the macula and follow a concentric distribution. This distribution was evident on a flat-mounted retina from a healthy monkey, labeled with glutamine synthetase, a specific marker of glial cells ( Figure 5 , Top right). Single Müller cells remained visible across the perifovea and followed a stellate pattern. Moreover, the “Z-shaped” profile of Müller cells was visible on histologic sections of a human macula after specific glial labeling for glutamine synthetase ( Figure 5 , Top left). From the external limiting membrane, the cells followed the previously described triple course with a short vertical segment, an intermediate long oblique portion, and a final vertical segment terminating at the internal limiting membrane. Even though these Müller cells progressed in parallel and formed a bundle, it was possible to visualize them individually.


