Purpose
To monitor retinal pigment epithelial (RPE) atrophy progression during antiangiogenic therapy of neovascular age-related macular degeneration (AMD) over 2 years using polarization-sensitive optical coherence tomography (OCT).
Design
Prospective interventional case series.
Methods
setting : Clinical practice. study population : Thirty patients (31 eyes) with treatment-naïve neovascular AMD. observation procedures : Standard intravitreal therapy (0.5 mg ranibizumab) was administered monthly during the first year and pro re nata (PRN; as-needed) during the second year. Spectral-domain (SD) OCT and polarization-sensitive OCT (selectively imaging the RPE) examinations were performed at baseline and at 1, 3, 6, 12, and 24 months using a standardized protocol. RPE-related changes were evaluated using a semi-automated polarization-sensitive OCT segmentation algorithm and correlated with SD OCT and fundus autofluorescence (FAF) findings. main outcome measures : RPE response, geographic atrophy (GA) progression.
Results
Atrophic RPE changes included RPE thinning, RPE porosity, focal RPE atrophy, and development of GA. Early RPE loss (ie, RPE porosity, focal atrophy) increased progressively during initial monthly treatment and remained stable during subsequent PRN-based therapy. GA developed in 61% of eyes at month 24. Mean GA area increased from 0.77 mm 2 at 12 months to 1.10 mm 2 (standard deviation = 1.09 mm 2 ) at 24 months. Reactive accumulation of RPE-related material at the lesion borders increased until month 3 and subsequently decreased.
Conclusions
Progressive RPE atrophy and GA developed in the majority of eyes. RPE migration signifies certain RPE plasticity. Polarization-sensitive OCT specifically images RPE-related changes in neovascular AMD, contrary to conventional imaging methods. Polarization-sensitive OCT allows for precisely monitoring the sequence of RPE-related morphologic changes.
Age-related macular degeneration (AMD) is a progressive disease leading to substantial visual loss. Independent of the 2 classic pathways of disease progression with an atrophic or a neovascular development, a leading pathophysiologic role of the retinal pigment epithelium (RPE) has been recognized. Defects in the RPE layer continuity with abnormal choroidal vessel growth cause leakage and fluid accumulation resulting in rapid deterioration of vision owing to successive damage to the overlying retina, while clinically masking RPE morphology.
Vascular endothelial growth factor (VEGF)-A is a key factor in the pathogenesis of choroidal neovascularization (CNV). Milestone clinical trials have demonstrated significant efficacy in terms of improving visual acuity (VA) with monthly injections of ranibizumab. The antibody fragment inhibits binding of multiple active forms of VEGF-A to their receptors, resolves leakage, and restores retinal morphology and often function, and became the first-line treatment for neovascular AMD. Recently, an increased progression rate of geographic atrophy (GA) has been recognized during anti-VEGF therapy.
Together with anti-VEGF therapy, high-resolution imaging technologies such as spectral-domain optical coherence tomography (SD OCT) that obtain high-resolution retinal images have become increasingly important modalities in the diagnosis and therapeutic management of neovascular AMD. However, current SD OCT technology visualizes retinal structures exclusively by intensity-based imaging and has substantial limitations in identifying the RPE owing to difficulties in segmenting structures of similar reflectivity. A distinct evaluation of RPE morphology would be of major relevance to gain insight into the primary pathophysiology of AMD, the biologic response to anti-VEGF therapy, and long-term prognosis.
Recently, polarization-sensitive OCT has been introduced, providing morphologic information beyond nonspecific back-scattered intensity patterns, selectively identifying the RPE by measuring several intrinsic tissue qualities simultaneously with spectral-domain high-resolution imaging (reflectivity, retardation, optic axis orientation, degree of polarization uniformity [DOPU]). Polarization-sensitive OCT provides distinct identification of the RPE condition in AMD with drusen, advanced dry AMD, and neovascular AMD. The purpose of the current study was to identify characteristic RPE changes in patients with neovascular AMD undergoing continuous anti-VEGF therapy from early to advanced changes using polarization-sensitive OCT together with conventional SD OCT.
Methods
Inclusion and Exclusion Criteria
Thirty treatment-naïve patients (31 eyes) with neovascular AMD were included in this prospective interventional case series. The mean age of patients was 82 (standard deviation [SD]: 8) years; 18 patients were female and 12 were male. The character and possible consequences of the study were explained in detail prior to inclusion. Each patient gave signed informed consent. Ethics Committee approval (Medical University of Vienna) was obtained. The study adhered to the tenets of the Declaration of Helsinki and to all federal laws of Austria. This study is registered at https://eudract.ema.europa.eu/ , number 2006-005684-26.
Active subfoveal CNV was identified using protocol fluorescein angiography (FA) and conventional SD OCT (Spectralis OCT; Heidelberg Engineering, Heidelberg, Germany) that showed retinal thickening >250 μm. Exclusion criteria were other retinal diseases including primary GA, retinal dystrophies, and severe media opacities. All patients underwent a standardized ophthalmologic examination including best-corrected visual acuity (BCVA) using Early Treatment Diabetic Retinopathy Study (ETDRS) letters, slit-lamp biomicroscopy, fundus photography, and FA.
Retinal Pigment Epithelium Imaging
Patients were imaged by conventional SD OCT, by fundus autofluorescence (FAF), and by a polarization-sensitive OCT prototype specifically imaging the RPE, developed by the Center for Medical Physics and Biomedical Engineering, Medical University of Vienna, used previously. Retinal and RPE morphology was assessed prior to anti-VEGF treatment (baseline) and at 1, 3, 6, 12, and 24 months following baseline.
Polarization-sensitive OCT measures reflectivity, retardation, optic axis orientation, and DOPU simultaneously and images retinal morphology, the RPE, and related depolarizing structures containing melanin. Details of the instrument have been published. RPE identification is based on its depolarizing quality, scrambling the polarization state of back-scattered light, while light back-scattered from other retinal layers remains in a well-defined polarization state. High-resolution 3D polarization-sensitive OCT datasets are recorded in 3.3 seconds with a raster scanning speed of 20 000 A-scans/s and 4.5 μm axial resolution. A 6.2 × 6.7 mm 2 scanning area and a 128 B-scans × 512 A-scans scanning density was used, enabling best image quality.
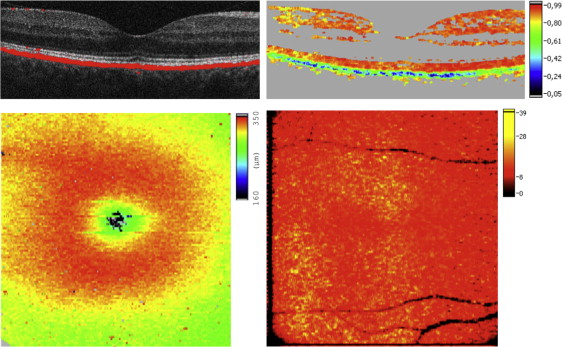
RPE segmentation was performed by an algorithm based on Stokes vector analysis. Stokes vector elements were averaged over adjacent pixels by calculating the mean value of each Stokes vector element within a rectangular evaluation window. The DOPU value related to the degree of polarization was then calculated as a function of position. In polarization-preserving or birefringent tissue, DOPU is approximately 1; in the case of a depolarizing layer, DOPU is lower than 1. Red, orange, or yellow colors in DOPU images indicate polarization-preserving tissue (ie, retinal layers other than the RPE). The RPE appears as a depolarizing layer (green to blue colors) providing selective differentiation. By thresholding the DOPU image, areas of DOPU <0.8 were regarded as depolarizing RPE and used to generate an overlay of the segmented RPE and the intensity SD OCT image enabling visualization of retinal layers together with the RPE ( Figure 1 ).
Intensity-Based Spectral-Domain Optical Coherence Tomography Imaging
Spectralis SD OCT high-resolution macular raster scans, scans of the foveal region, and macular thickness maps were used in this study. Intensity-based SD OCT B-scans were compared to polarization-sensitive OCT images regarding RPE integrity and correlations of hyperreflective material with depolarizing foci in outer retinal layers. Scanning angle was 20 degrees, scan diameter measured 6000 μm, and 20 high-resolution frames were averaged per B-scan.
Semiautomated Segmentation of Retinal Pigment Epithelium Atrophy by Polarization-Sensitive Optical Coherence Tomography
An automated segmentation algorithm was developed for GA lesion quantification in dry AMD and used in a semiautomated fashion for measuring lesions in neovascular AMD in this study. The height of the evaluation band used to sum up the number of depolarizing pixels along each A-line was adjusted manually depending on the curvature of the pathologic RPE (ie, in case of pigment epithelial detachment) and on the amount of choroidal depolarizing pixels. Using the evaluation band, the algorithm excluded depolarizing signals below the RPE/Bruch membrane complex and is therefore described as semiautomated. The algorithm analyzes depolarizing pixels along each A-line of a segmented 3D dataset, subsequently generating a thickness map of depolarizing tissue that was then binarized and smoothed to precisely assess GA dimensions. The algorithm automatically detects patches of connected pixels, marks them as atrophic, and calculates the corresponding atrophy area by scaling with the known pixel area.
Treatment Procedures
Patients received monthly injections of ranibizumab (Lucentis; Novartis Pharma AG, Basel, Switzerland, and Genentech Inc, South San Francisco, California, USA) during the first 12 months and were treated pro re nata (PRN; as needed) from months 12–24 following the Comparison of Age-related Macular Degeneration Treatments Trials (CATT) protocol. Summarized, patients were scheduled for monthly monitoring visits according to protocol and underwent a complete examination including standardized BCVA testing and SD/polarization-sensitive OCT imaging.
Retreatments were performed if visual deterioration occurred or active CNV was evident. Most retreatment decisions were made according to presence or absence of fluid in OCT. Eyes were retreated except if fluid did not decrease following 3 consecutive monthly injections. Treatment was reinstituted at later visits if increased fluid was detected on OCT. If other signs of active CNV presented (including persistent intraretinal or subretinal hemorrhage, new subretinal hemorrhage, decreased VA relative to last visit without other explanation, leakage on FA, or increased lesion size on FA relative to last angiogram) patients were treated.
A total of 0.5 mg ranibizumab was injected intravitreally using a 30 gauge needle.
Morphologic Parameters and Data Analyses
Two independent graders analyzed polarization-sensitive and SD OCT images in a masked and random fashion regarding patient, treatment assignment, and visit. Based on polarization-sensitive OCT, RPE-specific changes were graded qualitatively as: RPE thinning, RPE porosity, focal RPE atrophy, GA areas, and regulatory RPE migration including accumulations of depolarizing material at the RPE level or ectopic depolarizing material within outer retinal layers.
RPE porosity was classified as series of RPE layer gaps over a width of at least 20% of a polarization-sensitive OCT B-scan, with several depolarizing RPE residuals between atrophic regions ( Figure 2 , dashed brace). Focal RPE atrophy was defined as isolated atrophic regions in the RPE, not quantifiable as advanced GA by the segmentation algorithm ( Figure 2 , circle). RPE thinning was defined as an RPE segmentation band thinner than half the normal RPE segmentation band thickness over a width of at least 10% of a B-scan ( Figure 2 , dotted brace). GA was defined as atrophic RPE lesions ≥0.1 mm 2 (minimal GA area detectable by the algorithm).
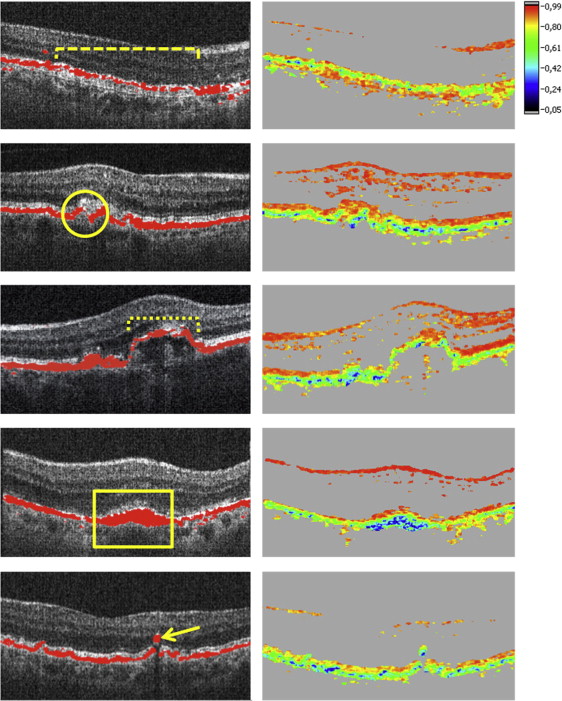
Accumulation of depolarizing material at the RPE level was defined as an RPE area at least twice as thick as normal RPE identified in a B-scan outside of the AMD lesion ( Figure 2 , rectangle). Ectopic depolarizing material was specified as depolarizing structures in outer retinal layers, discontinuous from the RPE ( Figure 2 , arrow).
Quantitative evaluation of presence or absence of described features during follow-up was performed: all polarization-sensitive OCT B-scans were evaluated at each visit and a score of 0 or 1 was assigned for absence (0) or presence (1) of a specific RPE lesion type. The proportion of eyes with evidence of each lesion type was expressed as a percentage for each visit.
Fellow eyes were analyzed and compared to eyes with CNV treated with anti-VEGF based on polarization-sensitive OCT and conventional intensity-based SD OCT. Fellow eyes that developed CNV were immediately treated as needed using intravitreal ranibizumab.
Interobserver variability of qualitative polarization-sensitive OCT results was tested using κ statistics and by calculating percentage of agreement. Spearman correlation coefficients were used to evaluate agreement of identified lesion analyses between observers.
BCVA and central retinal thickness (CRT) (using Spectralis-OCT) were compared during follow-up. The paired sample t test was used for BCVA and CRT assessment and for comparison of GA area between different time points. Software used was MedCalc version 14.12.0 (Informer Technologies, Inc.), Excel 2007 (Microsoft), and Photoshop CS5.1 (Adobe). P < .05 was considered statistically significant.
Results
Changes in Clinical Parameters
At enrollment, BCVA ranged from 20/40 to 20/320. Mean BCVA was 57.7 (range: 14–90) ETDRS letters at baseline and 56.3 (SD: 19.4) letters at month 24 ( P = .98). Mean CRT was 450.9 μm (SD: 128.6) at baseline and 323.9 μm (SD: 124.8) at month 24 ( P < .01). Figure 3 summarizes the results. Mean number of anti-VEGF treatments was 9.9 (range: 3–12) between months 0 and 12 and 3.2 (range: 0–6) between months 12 and 24.
Qualitative Identification of Retinal Pigment Epithelial Morphology by Optical Coherence Tomography Imaging
Primary RPE-related alterations caused by the neovascular pathology and/or secondarily associated with anti-VEGF therapy (RPE atrophy and RPE migration) were consistently identifiable by polarization-sensitive OCT ( Figure 2 ). While conventional intensity-based SD OCT demonstrated a continuous RPE layer feature in the majority of cases, polarization-sensitive OCT revealed distinct RPE discontinuities as well as RPE thinning/thickening within the lesion area ( Figure 4 ). At baseline RPE porosity was identified in 23% and focal atrophy in 55% of eyes ( Figure 5 ). RPE atrophy was mostly associated with fluid or intraretinal cysts in SD OCT ( Figure 6 ).
Progression of Retinal Pigment Epithelial Atrophy in Polarization-Sensitive Optical Coherence Tomography
Continuous progression of RPE loss could be measured during follow-up, based on polarization-sensitive OCT images at each designated visit.
RPE porosity, detected in 7 of 31 eyes (23%) at baseline, increased to 20 affected eyes (65%) at months 12 and 24 during anti-VEGF therapy. Focal RPE atrophy was observed in 17 eyes (55%) at baseline, while following 12 and 24 months 30 eyes (97%) were affected and only 1 eye did not show any area of RPE discontinuity.
No GA lesion was detected by the semiautomated segmentation algorithm in any of the 31 eyes at baseline. However, following 12 months of monthly treatment with anti-VEGF, GA was detected in 17 eyes (55%), and in 19 eyes (61%) at month 24. Of all patients in whom GA was detected, mean GA dimensions were 0.77 mm 2 (SD: 0.67, range: 0.12–2.58 mm 2 ) at month 12 and 1.10 mm 2 (SD: 1.09, range: 0.14–2.58 mm 2 ) at month 24 ( Figure 7 ), showing continuous expansion throughout a fixed and a flexible regimen. Eyes with CNV that developed GA showed subretinal drusenoid deposits (SDD) in 5 eyes (26%) at month 24. Twenty-six percent of eyes with CNV developing GA showed SDD prior to the visit when GA was first detected. All eyes with SDD and GA revealed multilobular GA.
Figure 8 shows a representative example of GA detection by polarization-sensitive OCT in a patient treated with anti-VEGF clearly highlighting progressive GA enlargement. Comparing polarization-sensitive OCT with intensity-based SD OCT and FAF imaging, only polarization-sensitive OCT precisely identifies atrophic RPE. Following 24 months of treatment, 9 of 31 eyes (29%) revealed foveal GA, 5 eyes (16%) extrafoveal GA, and 5 eyes (16%) both foveal and extrafoveal GA.
One patient (1 eye, 3%) was affected by RPE thinning at baseline, 4 eyes (13%) at month 12, and 3 eyes (10%) at month 24 following anti-VEGF therapy.
Evaluation of Retinal Pigment Epithelium Migration Detected by Polarization-Sensitive Optical Coherence Tomography
In addition to atrophic changes, an increase in RPE-related material was noted simultaneously and interpreted as reactive RPE migration/hyperplasia, initially increasing until month 3, followed by a decrease of RPE response throughout month 24 ( Figure 9 ).
Accumulations of RPE-derived depolarization presented in 7 of 31 eyes (23%) prior to treatment, reaching a maximum at month 3 following anti-VEGF therapy (19 eyes, 61%). Eleven eyes (36%) revealed this pattern at month 12 and 8 eyes (26%) at month 24. A typical ring-shaped appearance of accumulating depolarizing material encapsulating the CNV lesion was observed in 3 eyes with classic CNV ( Figure 10 ). All ring-shaped RPE accumulations progressed toward RPE atrophy with treatment continuation.
Ectopic depolarizing material in outer retinal layers changed from 26 affected eyes (26/31, 84%) at baseline to 19 eyes (19/31, 61%) at month 12 and 16 eyes (16/31, 52%) at month 24. These accumulations were located within the outer nuclear layer (ONL) and consistently corresponded to intraretinal foci in intensity-based SD OCT ( Figure 11 ).
Morphologic Analysis of Fellow Eyes
Fifteen fellow eyes (48%) developed neovascular AMD until month 24 of follow-up, revealing RPE-related changes as described above, and were therefore excluded from analysis.
Five fellow eyes (31%) showed GA related to dry AMD at baseline, 1 eye (6%) developed GA at month 6. All GA lesions increased progressively until month 24. Drusen presented at a variable extent in all eyes, increasing in number and area in 5 eyes (31%) until month 24. Three fellow eyes (19%) showed drusen regression resulting in focal RPE atrophy or GA until month 24. SDD presented in 13 eyes (81%) at month 24.
In addition to fellow eyes with GA related to dry AMD, 3 eyes (19%) showed focal RPE atrophy, noted at baseline in 2 eyes (13%). These eyes showed isolated focal RPE atrophy on top of a druse, of which 1 eye (6%) remained stable and the other eye showed RPE atrophy progression through month 24. One eye first revealed focal RPE atrophy at month 12 and showed consecutive RPE atrophy progression until month 24. RPE porosity or RPE thinning was not detected in fellow eyes without GA related to dry AMD.
Excluding fellow eyes with CNV, accumulations of depolarizing material in outer retinal layers appeared in 11 eyes (69%) and remained stable in 8 eyes (50%) until month 24. Accumulations of depolarizing material in outer retinal layers increased in 1 of these eyes from months 12–24; 2 eyes showed a decrease from baseline through month 24.
Reproducibility of Reading Procedures
The Table summarizes interobserver reproducibility of qualitative grading of RPE lesion types in polarization-sensitive OCT B-scans. Highest reproducibility (κ = 1.0) was found for semiautomated GA detection and lowest for RPE thinning (κ = 0.39). Overall agreement was 88%. Semiautomated GA segmentation agreement between observers was consistently high, with r = 0.9 (Spearman correlation coefficient).


