The goal of surgery for the chronic ear is to create a safe, disease-free ear and improve the hearing as much as possible. With respect to the chronic ear, audiologists are tasked with providing valid and complete audiologic data that may determine a course of treatment and afterward be used to monitor treatment. Audiologists conduct a battery of physiologic and behavioral tests that can yield information with regard to how the chronic ear impacts hearing sensitivity and overall sound perception. This typically begins with an otoscopic examination, followed by physiologic assessments of the middle ear and pure-tone and speech audiometry. Otoscopy can help form some initial clues about how testing might go. The principle physiologic test is an immittance battery, which includes tympanometry, acoustic reflex testing, and, occasionally, Eustachian tube dysfunction testing.
From a surgical standpoint, the audiogram is arguably the most important functional tool in the preoperative assessment and the postoperative follow-up of patients. However, pure-tone audiometry should be considered as only part of the hearing evaluation, especially in difficult cases, and the surgeon should pay special attention to all aspects of the audiogram, including tympanometry, speech thresholds, and word recognition scores, all of which should be consistent with the pure-tone average. The tuning fork exam should be performed in all cases, and it should also support the findings on the audiogram. If there is disagreement, especially with the Weber portion of the exam, this should be reconciled before surgery is considered.
10.2 Pure-tone Audiometry
10.2.1 The Audiologist’s Perspective
Pure-tone audiometry remains the unequivocal gold standard for the assessment of hearing sensitivity to identify thresholds across a range of test frequencies that generally encompass the speech range (250–8000 Hz, sometimes 125 Hz). Hearing loss is described primarily in terms of the magnitude of air conduction thresholds. The causes of hearing loss, however, have origins giving rise to the following terms: sensorineural (inner), conductive (outer and/or middle), or mixed (both).
During pure-tone audiometry, patients with chronic ear symptoms may exhibit reduced hearing sensitivity (i.e., poorer [elevated] thresholds) due to damping effects occurring within the middle ear; however, the effect across test frequencies may not be equally distributed. For example, significant negative pressure in the middle ear favors higher frequencies (stiffness tilt), resulting in a low-frequency hearing loss profile with air conduction testing (▶ Fig. 10.1). On the other hand, fluid in the middle ear results in the addition of mass, which impedes high-frequency signals and yields a high-frequency hearing loss profile with air conduction testing (mass tilt, ▶ Fig. 10.2). When negative pressure and fluid coexist in the middle ear, a flatter air conduction audiometric profile may be seen.
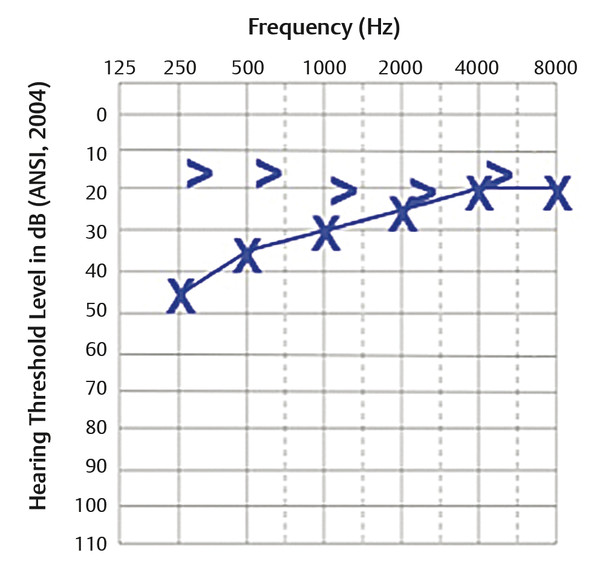
Fig. 10.1 Example of stiffness tilt. High-frequency air conduction is preserved, and there is an ABG in the low frequencies.
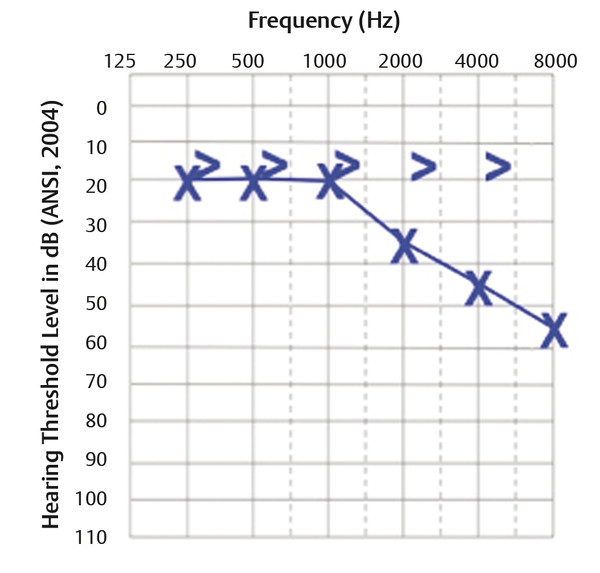
Fig. 10.2 Example of mass tilt. Low-frequency air conduction is preserved, and there is an ABG in the high frequencies.
Bone conduction thresholds, on the other hand, will typically be better (lower) relative to air conduction thresholds, resulting in an air-bone gap (ABG). Middle ear diseases that decrease mobility of the ossicular chain and tympanic membrane (e.g., otosclerosis and lateral fixation) can also produce a stiffness tilt with a low-frequency air conduction hearing loss profile. A curious finding in otosclerosis involving stapes fixation is a reduction of bone conduction hearing sensitivity at 2000 Hz, called Carhart’s notch or Carhart’s effect.1 The magnitude of this reduction is about 5 dB to 15 dB worse than at adjacent frequencies of 500, 1000, and 4000 Hz (▶ Fig. 10.3). Based on chief complaints, bone conduction thresholds may also be helpful with superior canal dehiscence, where ABGs of 10 dB or greater can exist in the lower frequencies (may be mild to moderate) and bone levels are better than expected (<0 dB hearing level [HL]).2
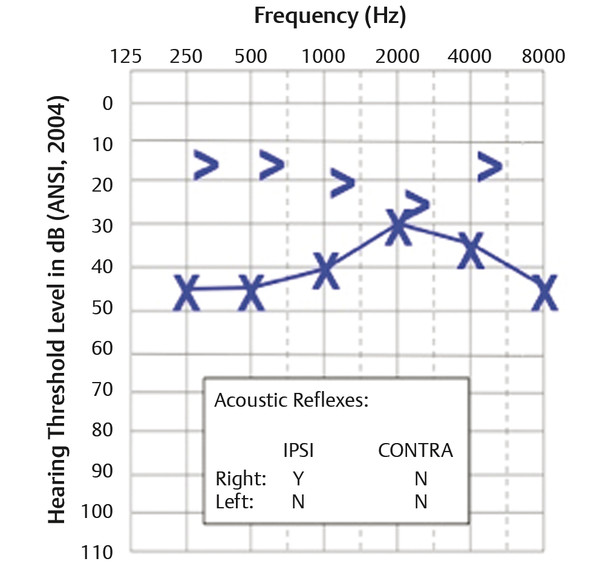
Fig. 10.3 Example of Carhart’s notch. This is typically seen with a stapes fixation.
Without bone conduction thresholds, the magnitude of a conductive hearing loss caused by middle ear diseases cannot be inferred. Large air conduction differences between ears (asymmetric hearing loss) may present a challenge, and audiometric testing will be influenced by interaural attenuation, which is on average around 60–65 dB for supra-aural earphones and about 20–30 dB higher for insert earphones with deep insertion. Supra-aural earphones have poorer interaural attenuation values because of their larger surface contact area with the skull and tissues, which can increase the probability of cross-hearing of high-intensity maskers via bone condition transmission. Conductive hearing losses can range to a maximum of 50–60 dB. Without the use of masking for the non-test ear, the test ear will essentially shadow the configuration of the better, non-test ear (▶ Fig. 10.4). Deep insertion of insert earphones can prevent shadow audiograms up to the limits of the interaural attenuation. Audiologists should be deliberate and diligent in obtaining valid bone conduction thresholds, especially when masking is used.
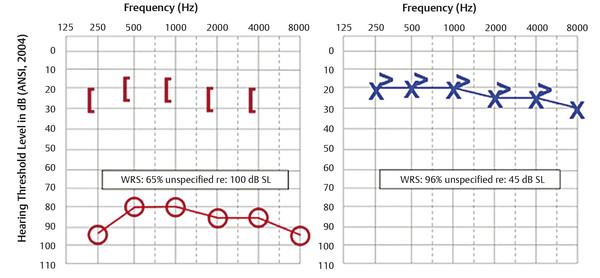
Fig. 10.4 Example of a shadow curve. The ABG exceeds what is physiologically possible. The gap is greater than interaural attenuation, and word recognition scores in the right ear are not typical of a conductive hearing loss.
At least three issues come to mind. One, air conduction masking levels in one ear may be sufficiently loud to cross over to the non-test ear via the passage of vibration through the bones of the skull. Two, supra-aural earphones and shallow insert earphone placement can both produce an occlusion effect that falsely improves bone conduction thresholds. Finally, the audiologist should be wary of any measurement of a maximum conductive hearing loss that appears at only one test frequency but nowhere else on an audiogram.
In cases of bilateral conductive hearing loss of at least 35 dB or more, audiologists may be confronted with a masking dilemma. This is a testing situation in which a masked threshold cannot be reached and the level of the masker crosses over to the non-test ear. A common solution to the masking dilemma is the use of insert earphones rather than supra-aural headphones due to slightly higher interaural attenuation. However, to achieve maximum benefit, deep insertion of insert earphones 2–3 mm inside the ear canal may allow the audiologist to reduce the overall effective masking level and avoid crossover hearing of the masker to the test ear. It is this audiologist’s opinion that all air conduction testing should be performed using insert earphones unless supra-aural earphones are medically indicated.
10.2.2 The Otologist’s Perspective
Preoperatively, the audiogram can give valuable insight, not only with regard to the magnitude of hearing impairment, but also with regard to the type of pathology, mechanism of involvement of the middle ear mechanism, and prognosis for improvement. The surgeon should be able to recognize the degree of conductive hearing loss to be expected for different pathologic processes as well as the pattern of loss on the audiogram specific for the condition.
If the degree of hearing loss is more than expected for a condition, then the surgeon should expect more than one point of involvement of the acoustic mechanism. An example would be an up-sloping 40-dB conductive loss at 500 Hz with a small anterior perforation (▶ Fig. 10.5). Knowing that a perforation in and of itself will cause a maximum 30-dB loss, one would anticipate concomitant fixation or erosion of the chain. The patient should be advised that a staged surgery might be necessary, especially if the stapes is fixed with tympanosclerosis.
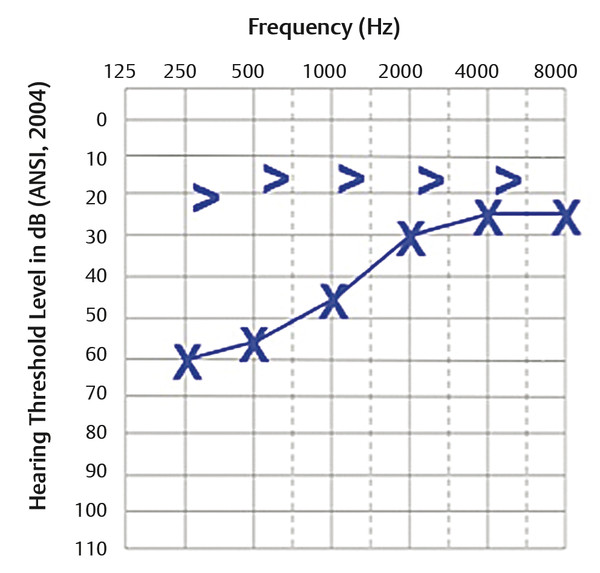
Fig. 10.5 Example of a hearing loss that would be considered out of proportion to a small anterior perforation.
Likewise, the hearing loss should be consistent with the pattern and degree of loss associated with a specific condition. For example, if an audiogram shows an ABG of 55 dB at 500 Hz but is closed at 2000 Hz, one would have to question the accuracy of the test (▶ Fig. 10.6). The gap of 55 dB would be suggestive of maximum conductive hearing loss associated with ossicular discontinuity, but if that were the case, there would almost certainly be a large gap at 2000 Hz. There is no condition that can result in both. In this situation, it is possible that the 500 Hz bone level was in part vibrotactile and not accurate. It is this otologist’s experience that 500 Hz is the least accurate of the tested bone levels due to this possibility, and that 1000 Hz and 2000 Hz are more reliable.
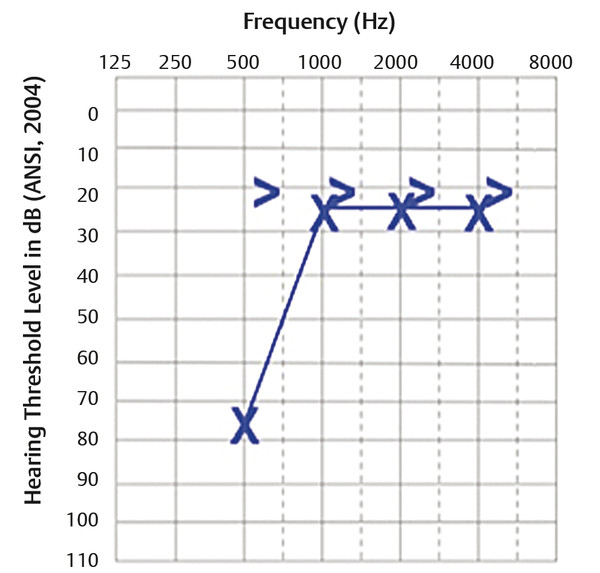
Fig. 10.6 Example of a wide ABG at a low frequency that is closed at 2000 Hz, suggesting vibrotactile feedback.
Stay updated, free articles. Join our Telegram channel

Full access? Get Clinical Tree


