FIGURE 2.1 Lateral view of left temporal bone surface shows squamous, tympanic, and mastoid portions. (From Francis HW, Niparko JK. Temporal Bone Dissection Guide. New York, NY: Thieme; 2011 and Flint PW, Haughey BH, Lund VJ, et al. Cumm ings Otolaryngology—Head and Neck Surgery. 6th ed. Philadelphia, PA: Saunders; 2015, fig. 127-1.)
Inferior View of the Left Temporal Bone (Fig. 2.4)
Key Points
• The styloid process is anteromedial to the stylomastoid foramen.
• Medial and superior to the mastoid tip is the digastric groove, which is the origin of the posterior belly of the digastric muscle. The anterior border of the digastric groove is the stylomastoid foramen.

FIGURE 2.2 Superior view of left temporal bone shows petrous and squamous portions forming the floor of the middle fossa and anterior limit of the posterior fossa. (From Francis HW, Niparko JK. Temporal Bone Dissection Guide. New York, NY: Thieme; 2011 and Flint PW, Haughey BH, Lund VJ, et al. Cummings Otolaryngology—Head and Neck Surgery. 6th ed. Philadelphia, PA: Saunders; 2015, fig. 127-2.)
• The cochlear aqueduct is inferior and parallel to the IAC.
The Auricle
Blood Supply
• External carotid artery
• Superficial temporal artery (anterior)
• Posterior auricular (posterior)
Ear Canal
• Lateral one-third is cartilaginous (has cerumen glands and hair follicles)
• Medial two-thirds are bony (no cerumen glands or hair follicles)
• Bony-cartilaginous junction is a route of disease spread
• Fissures of Santorini: natural fissures in anterior cartilaginous ear canal that allows the spread of disease to the superficial parotid
• Foramen of Huschke: anteroinferior bony defect that typically obliterates during development; patency allows the spread of disease to the deep parotid lobe/temporomandibular joint (TMJ)
Eardrum (Fig. 2.5)
1. Manubrium (handle of malleus)
2. Anterior malleolar fold
3. Posterior malleolar fold

FIGURE 2.3 The posterior surface features of the left temporal bone include the fundus of the IAC. Foramina for cranial nerve VIII: cochlear (a), inferior vestibular (b), and superior vestibular (c) divisions and cranial nerve VII (d) are shown. (From Francis HW, Niparko JK. Temporal Bone Dissection Guide. New York, NY: Thieme; 2011 and Flint PW, Haughey BH, Lund VJ, et al. Cummings Otolaryngology—Head and Neck Surgery. 6th ed. Philadelphia, PA: Saunders; 2015, fig. 127-3.)

FIGURE 2.4 Inferior View of the Left Temporal Bone.
Note the linear relationship between the stylomastoid foramen, digastric groove, and styloid process. (From Francis HW, Niparko JK. Temporal Bone Dissection Guide. New York, NY: Thieme; 2011 and Flint PW, Haughey BH, Lund VJ, et al. Cummings Otolaryngology—Head and Neck Surgery. 6th ed. Philadelphia, PA: Saunders; 2015, fig. 127-5.)
5. Long process of the incus
6. Promontory behind the eardrum
7. Fibrous tympanic annulus (not present along the pars flaccida)
8. Umbo
9. Lateral or short process of the malleus
10. Opening of the Eustachian tube
Middle Ear
1. Epitympanum (superior to the annulus)
a. Prussack’s space
b. Anterior epitympanum (Supratubal recess) – compartment anterior to the malleus head
c. Posterior epitympanum compartment posterior to the cog (communicates with the mastoid via the aditus ad antrum into the antrum)
2. Mesotympanum (at the level of the annulus, superiorly/inferiorly)
3. Hypotympanum (below the level of the annulus)
4. Eustachian tube (protympanum): connects and ventilates the anterior mesotympanic space to the nasopharynx
5. Above the Eustachian tube is the supratubal recess (STR)
a. The posterior boundary cochleariform process (inferiorly) and the cog (superiorly); the former is where the tensor tympani tendon takes a 90-degree turn from the medial wall of the middle ear and inserts onto the malleus
b. The medial wall will house the geniculate ganglion; it may be dehiscent by the cholesteatoma
6. Sinus tympani in the posterior mesotympanic space, medial to the descending facial nerve, posterior to the oval window (separated by the ponticulus) and round window niche (separated by the subiculum) and of variable posterior extension; cholesteatoma may hide here
7. Facial recess is lateral to the vertical facial nerve but medial to the chorda tympani nerve, which, in turn, is medial to the annulus

FIGURE 2.5 Surface features of the left TM include the manubrium of the malleus (mallear stria, 1); anterior mallear fold (2); posterior mallear fold (3); pars flaccida, or Shrapnell membrane (4); long process of incus (5); pars tensa, through which the promontory and round window are visible (6); tympanic annulus (7); umbo (8); lateral process (9); Eustachian tube opening (10); and anterior and posterior tympanic spines (asterisks). The anterior and posterior tympanic spines are the borders of the bony gateway to the epitympanum (notch of Rivinus). (From Flint PW, Haughey BH, Lund VJ, et al. Cummings Otolaryngology—Head and Neck Surgery. 6th ed. Philadelphia, PA: Saunders; 2015, fig. 127-8.)
8. The suspensory ligaments and mesenteries of the ossicles separate the aeration of the epitympanum and mesotympanum, and connect
a. Anterior to the stapes (isthmus tympani anticus)
b. Posterior to the stapes (isthmus tympani oticus)
9. The long process of the incus has a single blood supply without collaterals predisposing it to erosion

FIGURE 2.6 Anatomy of the Infratemporal Portion of the Facial Nerve and Associated Middle Ear Structures.
Shown are sites of vulnerability to injury (arrowheads). Perigeniculate region: Susceptibility of the genicular fossa to fracture also increases the risk of nerve injury via nerve compression and ischemia in the narrow meatal foramen and labyrinthine segment. The first genu of the facial nerve is tethered by the GSPN, which increases susceptibility to shearing injuries; vascular watershed area between branches of the external carotid artery and posterior circulation, the geniculate ganglion is susceptible to injury during surgical dissection in the STR of the anterior epitympanum. Tympanic segment: The nerve is most frequently dehiscent above the oval window and distal tympanic segment; the second genu is susceptible to injury in cholesteatoma surgery because of pathologic dehiscence or distorted anatomy and failure to identify important surgical landmarks. Mastoid segment: In the lower portion of its vertical course and just distal to the stylomastoid foramen, the nerve is positioned lateral to the tympanic annulus and is therefore susceptible to injury during surgery of the EAC. EP, Eminence pyramidale; I, incus; M, malleus; S, stapes. (From Francis HW. Facial nerve emergencies. In Eisele D, McQuone S, eds. Emergencies of the Head and Neck. St. Louis, MO: Mosby; 2000 and Flint PW, Haughey BH, Lund VJ, et al. Cummings Otolaryngology—Head and Neck Surgery. 6th ed. Philadelphia, PA: Saunders; 2015, fig. 127-9.)
11. Tensor tympani innervation by V3 and inserts into the neck of the malleus
Course of the Facial Nerve, Right-Ear Parasagittal View (Fig. 2.6)
Key Points
1. Exits the brainstem (cisternal or the cerebellopontine angle [CPA] portion) 14-17 mm
2. Enters the porus of the IAC and courses to the fundus (meatal portion, 8-10 mm)
3. Intratemporal facial nerve’s bony housing = fallopian canal
4. Labyrinthine segment, 3-5 mm, the narrowest portion, and completely enclosed in bone, leaving it most susceptible to compression from edema (Bell’s) and trauma (temporal bone fracture)
5. Geniculate ganglion at the first genu of the facial nerve
6. Facial nerve in the inner ear enters just posterior and superior to the cochleariform process
7. Courses over the superior border of the oval window (tympanic segment, 10-12 mm)
a. Dehiscent here up to 25-55% of the temporal bones, leaving it susceptible to injury/inflammatory mediators
8. Second or mastoid genu
9. Mastoid or descending facial nerve, 12-15 mm
10. Exits at the stylomastoid foramen
a. Exit is surrounded by the posterior belly of the digastric and skull-base periosteum
11. Facial nerve functions
a. Special visceral efferent (facial nucleus to the stapedius, posterior belly digastric, stylohyoid muscle, and muscles of facial expression)
b. General visceral efferents (superior salivatory nucleus in the nervus intermedius to the geniculate ganglion to the lacrimal gland, nasal mucosa, and submandibular and sublingual glands)

FIGURE 2.7 Schematic of the Middle Ear System.
(A) Motion of the ossicular chain along its axis of rotation is illustrated. (B) Area of the TM (ATM) divided by area of the footplate (AFP) represents the area ratio (ATM/AFP). The length of the manubrium (lm) divided by the length of the incus long process (li) is the lever ratio (lm/li). PEC, External canal sound pressure; PV, sound pressure of the vestibule. (From Merchant SN, Rosowski JJ. Auditory physiology. In Glasscock ME, Gulya AJ, eds. Glasscock-Shambaugh Surgery of the Ear. 5th ed. Hamilton, ON: Decker; 2003:64, fig. 129-2.)
c. Special sensory fibers (anterior two-thirds tongue taste to the solitary nucleus)
d. Somatic sensory fibers (posterior external auditory canal [EAC] and conchal skin of the auricle to the spinal trigeminal nucleus)
e. Visceral afferent fibers (nasal mucosa to solitary nucleus)
Mastoid and Petrous Apex
Regions of Temporal Bone Pneumatization
1. Mastoid
2. Petrous apex
3. Perilabyrinthine
4. Accessory (zygomatic, squamous, occipital, and styloid)
Air Cell Tracts
1. Posterosuperior (sinodural)
2. Posteromedial (retrofacial and retrolabyrinthine)
3. Subarcuate
4. Perilabyrinthine
5. Peritubal
Auditory Anatomy and Physiology
External Ear
1. Auricle resonance frequency 5300 Hz
2. Ear canal resonance frequency 3000 Hz
3. Allows localization via
a. Interaural time difference
b. Interaural intensity difference
Eardrum/Ossicular Chain (Fig. 2.7)
1. Eardrum: footplate ratio 20:1 (26 dB advantage)
2. Ossicular chain lever ratio 1.3:1 (2.3 dB advantage)
3. Theoretical gain of eardrum/ossicular chain: 28 dB
4. Actual gain or eardrum/ossicular chain: 20 dB
Cochlea (Fig. 2.8)

FIGURE 2.8 Schematic Showing Sound Propagation in the Cochlea.
As sound energy travels through the external and middle ears, it causes the stapes footplate to vibrate. The vibration of this footplate results in a compressional wave on the inner ear fluid. Because the pressure in the scala vestibuli is higher than that in the scala tympani, this sets up a pressure gradient that causes the cochlear partition to vibrate as a traveling wave. Because the basilar membrane varies in its stiffness and mass along its length, it is able to act as a series of filters that respond to specific sound frequencies at specific locations along its length. (From Geisler CD. From Sound to Synapse: Physiology of the Mammalian Ear. New York, NY: Oxford University Press; 1998:51 and Flint PW, Haughey BH, Lund VJ, et al. Cummings Otolaryngology—Head and Neck Surgery. 6th ed. Philadelphia, PA: Saunders; 2015, fig. 129-6.)

FIGURE 2.9 Cross section of the organ of Corti showing the major cellular structures. (From Flint PW, Haughey BH, Lund VJ, et al. Cummings Otolaryngology—Head and Neck Surgery. 6th ed. Philadelphia, PA: Saunders; 2015, fig. 128-2.)
2. Basilar membrane (Fig. 2.9) is
a. Tonotopic: high frequencies at basal region (stiffer)
b. Lower frequencies at apical region (more flexible)
c. Stiffness difference allows it to be a frequency filter
3. Vibratory wave → deflection of hair cell stereocilia → potassium influx → depolarization (resting potential in endolymph +60-100 mV relative to perilymph) → action potential at first level neurons of spiral ganglion (Fig. 2.10)
4. Potassium recirculated back through supporting cells and back into the perilymph via the stria vascularis
Central Auditory Pathways (Fig. 2.11)
1. Auditory nerve
2. Cochlear nuclei
a. Dorsal cochlear nucleus
b. Anterior ventral cochlear nucleus
c. Posterior ventral cochlear nucleus (the majority of auditory fibers cross the midline)
3. Superior olivary complex
4. Lateral lemniscus
5. Inferior colliculus
6. Medial geniculate body
7. Auditory cortex
Stapedius Reflex
1. Auditory nerve → cochlear nucleus → interneurons → bilateral facial motor nuclei → bilateral stapedius tendons
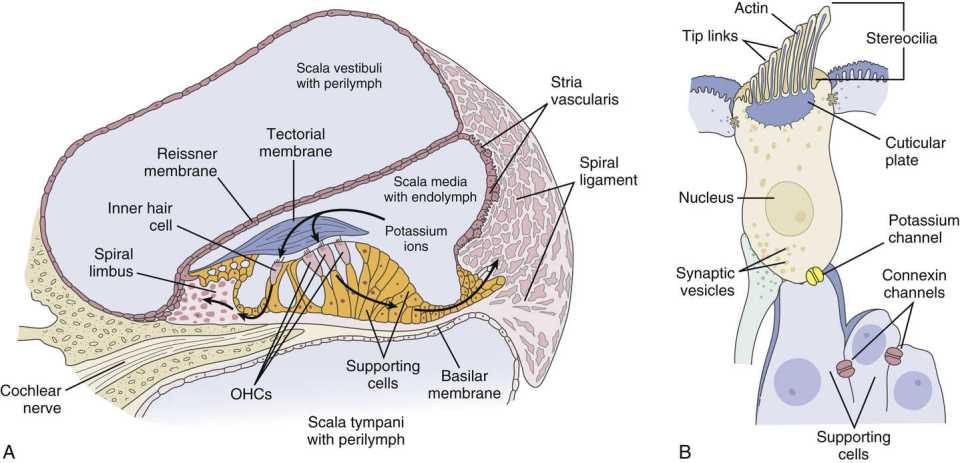
FIGURE 2.10 Mechanoelectrical transduction of the auditory signal depends on the recycling of potassium ions in the organ of Corti. (A) Schematic cross-sectional view of the human cochlea. The scala media (cochlear duct) is filled with endolymph, and the scala vestibuli and tympani are filled with perilymph. The endolymph of the scala media bathes the organ of Corti, located between the basilar and tectorial membranes and containing the inner and OHCs. A relatively high concentration of potassium in the endolymph of the scala media relative to the hair cell creates a cation gradient maintained by the activity of the epithelial supporting cells, spiral ligament, and stria vascularis. (B) Cells contain stereocilia along the apical surface and are connected by tip links. The potassium gradient is essential to enable depolarization of the hair cell following influx of potassium ions in response to mechanical vibration of the basilar membrane, deflection of stereocilia, displacement of tip links, and opening of gated potassium channels. Depolarization results in calcium influx through channels along the basolateral membrane of the hair cell, which causes degranulation of neurotransmitter vesicles into the synaptic terminal and propagates an action potential along the auditory nerve. Gap junction proteins between the hair cells (potassium channel, yellow) and epithelial supporting cells (connexin channels, red) allow for the flow of potassium ions back to the stria vascularis, where they are pumped back into the endolymph. (From Willems PJ. Genetic causes of hearing loss. N Engl J Med. 2000;342(15):1101-1109 and Flint PW, Haughey BH, Lund VJ, et al. Cummings Otolaryngology—Head and Neck Surgery. 6th ed. Philadelphia, PA: Saunders; 2015, fig. 129-4.)

FIGURE 2.11 Illustration of the major central ascending auditory pathways for sound entering via the right cochlea. Commissural pathways and descending feedback projections from higher centers are not depicted. DAS, Dorsal acoustic stria; IAS, intermediate acoustic stria; VAS, ventral acoustic stria. (From Flint PW, Haughey BH, Lund VJ, et al. Cummings Otolaryngology—Head and Neck Surgery. 6th ed. Philadelphia, PA: Saunders; 2015, fig. 128-6.)
Vestibular Anatomy and Physiology
Coplanar Semicircular Canals (Angular Accelerometers) (Fig. 2.12)
1. Horizontal canals
2. Left anterior (superior), right posterior
3. Right anterior (superior), left posterior
a. Basal firing rate from each ampulla
b. Excitatory with angular acceleration in the direction of the leading canal, and inhibitory in the coplanar, lagging canal; therefore,
i. Ampullopetal flow of the perilymph in the lateral canals is excitatory
ii. Ampullofugal flow of the perilymph in the superior and posterior canals is excitatory
Otolithic Organs (Linear Accelerometers)
1. Saccule: vertical acceleration
2. Utricle: horizontal acceleration, head tilt
Innervation
1. Superior vestibular nerve
a. Utricle
b. Superior semicircular canal
c. Lateral semicircular canal
2. Inferior vestibular nerve
a. Saccule
b. Posterior semicircular canal
Eustachian Tube
1. Two-thirds cartilaginous; one-third bony
2. Tensor veli palatini is the primary dilator
3. Aging leads to increased slope of the tube, as well as increased length, diameter, and efficiency of the opening
4. Ostmann fat pad: metabolically sensitive adipose in the lateral wall of the Eustachian tube distally (rapid weight loss can cause atrophy of the fat pad and results in patulous Eustachian tube syndrome)
Audiologic Testing
Audiogram (Fig. 2.13)
• O = right-ear air conduction
• X = left-ear air conduction
• Δ = right-ear air masked
• □ = left-ear air masked
• < = right unmasked bone

FIGURE 2.12 Orientation of Semicircular Canals.
(A) The horizontal canal is tilted 30 degrees upward from a horizontal plane at its anterior end. (B) Vertical canals are oriented at roughly 45 degrees from the midsagittal plane. AC, Anterior canal; LC, lateral canal; PC, posterior canal. (Modified from Barber HO, Stockwell CW. Manual of Electronystagmography. St. Louis, MO: Mosby-Year Book; 1976 and Flint PW, Haughey BH, Lund VJ, et al. Cummings Otolaryngology—Head and Neck Surgery. 6th ed. Philadelphia, PA: Saunders; 2015, fig. 130-2.)
• [= right masked bone
• ] = left masked bone
Crossover
1. Bone: 0-10 dB
2. Air (headphones): 35-50 dB
3. Air (insert headphones): 60-65 dB
Objective Measures up the Auditory Pathway
1. Otoacoustic emissions (OAEs) (spontaneous, transient evoked, distortion product: outer hair cell (OHC) function
2. Ecog: summating potential/action potential (SP/AP) ratio; AP = wave I auditory brainstem response (ABR); >0.35-0.5 abnormal (hydrops or inner ear third window)
3. ABR (five waves):
a. Distal eighth nerve
b. Proximal eighth nerve
c. Cochlear nuclei
d. Superior olivary complex
e. Lateral lemniscus
i. Tumor diagnosis:
(1) No wave V
(2) Prolongation I-III (interaural)
(3) Prolongation I-V (interaural)
(4) <1 cm tumor only 60% sensitive
ii. Auditory neuropathy/dyssynchrony
(1) No ABR
(2) Present OAEs
4. Vestibular evoked myogenic potential (VEMP): acoustic energy → saccule → inferior vestibular nerve → vestibular nuclei → ipsilateral spinal accessory nucleus → relaxation of sternocleidomastoid (SCM)
Imaging of the Skull Base and Temporal Bone Computed Tomography: The Study of Choice for Bony Anatomy
1. Atresia
2. Canal cholesteatoma

FIGURE 2.13 Audiogram Showing a Range of Hearing Loss.
ANSI, American National Standards Institute; dB HL, decibel hearing level. (From Flint PW, Haughey BH, Lund VJ, et al. Cummings Otolaryngology—Head and Neck Surgery. 6th ed. Philadelphia, PA: Saunders; 2015, fig. 133-1.)
3. Exostoses
4. Osteoma
5. Glomus tympanicum
6. Aberrant carotid artery
7. Cholesteatoma, uncomplicated
8. Uncomplicated chronic otitis media (OM)
9. Coalescent mastoiditis
10. Glomus tympanicum versus jugulare if visible lesion is below the annulus (examine the jugular plate)
11. Inner ear malformations
a. Lateral canal dysplasia
b. Enlarged vestibular aqueduct
c. Cochlear dysplasia
12. Labyrinthitis ossificans
13. Superior canal dehiscence/inner ear third windows
Magnetic Resonance Imaging is Better for Soft-Tissue Anatomy: The Study of Choice for Intracranial Pathology
1. CPA lesions
a. Vestibular schwannoma
b. Meningioma
c. Epidermoid
d. Eighth nerve deficiency (highly weighted T2 images: FIESTA or CISS sequences)
e. Early cochlear fibrosis (ie, early labyrinthitis ossificans before calcification)
When Magnetic Resonance Imaging and Computed Tomography are Complementary
1. Complicated OM/cholesteatoma
2. Glomus jugulare tumors
3. Endolymphatic sac tumors
4. Cholesterol granuloma
5. Facial nerve lesions (schwannoma/hemangioma)
Imaging Characteristics of Petrous Apex Lesions (Table 2.1)
The most common petrous apex lesions encountered are: asymmetric pneumatization, retained secretions, cholesterol granuloma, mucoceles and cholesteatomas. Please refer to Table 2.1 for the CT and MRI characteristics of ear entity.
Imaging Characteristics of Cerebellopontine Angle Lesions (Table 2.2)
The most common cerebellopontine angle lesions are acoustic neuromas, meningiomas, arachnoid cysts, epidermoids and lipomas. Please refer to Table 2.2 for the CT and MRI characteristics of each entity.
Otitis Externa
External Auditory Canal Defense
1. Acidic pH 6.0-6.5
2. Migratory nature of keratin debris (drum is centrifugally out)
Normal Flora
1. Staphylococcus auricularis
2. Staphylococcus epidermidis
3. Corynebacterium
4. Streptococcus
6. Rarely Pseudomonas
7. Rarely fungus
Acute Otitis Externa
1. 90% bacterial
a. Pseudomonas
b. S. epidermidis
c. Staphylococcus aureus
2. 2-10% fungus/other
a. Aspergillus
b. Candida
3. Treatment: always remove debris (“bacterial/fungal potato chips”)
a. Mild otitis externa (OE): acidify ½ white vinegar/distilled water ± rubbing alcohol
b. Moderate OE (with more edema and purulence): add antibiotic topical drop ± steroid; wick may be necessary if drum is not visible
c. Severe OE (extension to periauricular and auricular tissues): antibiotic topical drop ± steroid; wick may be necessary; add systemic antibiotic with pseudomonal coverage (quinolone likely)
d. Fungal OE: antibiotics may precipitate and steroids worsen; debride and antifungal (nystatin cream, ampho B powder/cream, and clotrimazole powder/cream)
4. Complications
a. Chondritis (Pseudomonas)
b. Perichondritis
c. Cellulitis
d. Malignant OE: Pseudomonas is the most common at 90%
5. Other acute otitis externa causes
a. Herpes zoster virus (HZV) (Ramsay Hunt)
b. Erysipelas (beta hemolytic strep)
c. Furuncle (S. aureus)
d. Bullous myringitis (viral vs. mycoplasma vs. Streptococcus)
i. Can have sensorineural hearing loss (SNHL) component 65%, resolution with infection resolution 60%
6. Malignant OE buzzwords
a. Diabetic, immunosuppressed
b. Pseudomonas #1; fungal less likely
c. Granulation at the bony-cartilaginous junction or tympanomastoid suture line
d. Biopsy needed: r/o malignancy
e. Imaging
i. Computed tomography (CT) scan: bony erosion
ii. Magnetic resonance imaging (MRI): soft-tissue involvement (likely study of choice)
iii. Technetium scan: can diagnose bony activity and will show long-term change, even after resolution
iv. Follow with gallium scan or indium scan with tagged white blood cells
f. Labs
i. Erythrocyte sedimentation rate: follow disease
Stay updated, free articles. Join our Telegram channel

Full access? Get Clinical Tree


