FIGURE 12.1 Mondini Malformation.
(A) Axial CT demonstrates incomplete partitioning of the mid and apical turn of the right cochlea with deficient modiolus (arrow). (B) Axial CT one slice superior demonstrates an enlarged vestibular aqueduct (arrow).
Imaging findings: A congenital malformation of the cochlea with a well-formed basal turn and incomplete partitioning of the mid and apical turns. In addition, modiolar deficiency is present with loss of the normal “Christmas tree” appearance of the modiolus and spiral lamina on the axial images. The normal 2½ turns are absent with >1½ turns of the cochlea present. There may also be enlargement of the vestibular aqueduct because of dilatation of the endolymphatic duct and sac.
Differential diagnosis: Cochlear dysplasia (<1½ turns of the cochlea) or branchial–oto-renal syndrome (elongation of the basal turn and small middle and apical turns of the cochlea).
Refer to Cummings chapter 192 for more details.
Case 2: Cholesterol Granuloma (Fig. 12.2)
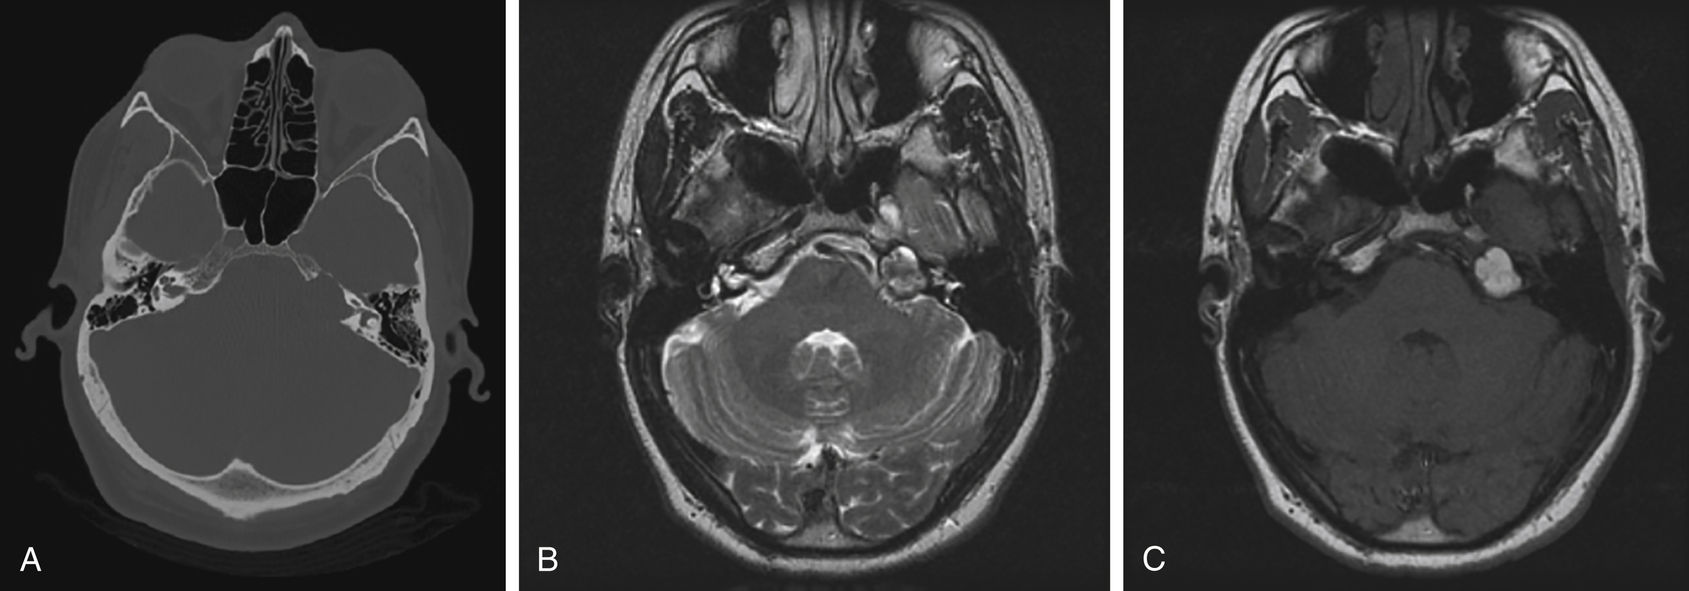
FIGURE 12.2 Cholesterol Granuloma.
(A) Axial noncontrast CT images demonstrate an expansile lucent lesion in the left petrous apex. (B) The lesion is increased in signal on T2-weighted imaging. (C) There is also T1-weighted hyperintensity characteristic of the cholesterol crystals and hemorrhagic material within a cholesterol granuloma.
Imaging findings: Expansile unilocular cystic lesion most commonly present in the petrous apex. These lesions may also occur in the mastoid portion of temporal bone and in the middle ear cavity.
Computed tomography (CT): Well-circumscribed unilocular expansile lesion with sclerotic smooth margin, sharp zone of transition, and most commonly posterior to the horizontal aspect of the petrous internal carotid artery.
Magnetic resonance imaging (MRI): Classically, these lesions are hyperintense on both T1- and T2-weighted images and do not demonstrate enhancement or diffusion abnormality.
Differential diagnosis: Petrous apex mucocele, petrous cephalocele, or congenital epidermoid.
Refer to Cummings chapter 177 for more details.
Case 3: Petrous Apex Mucocele (Fig. 12.3)
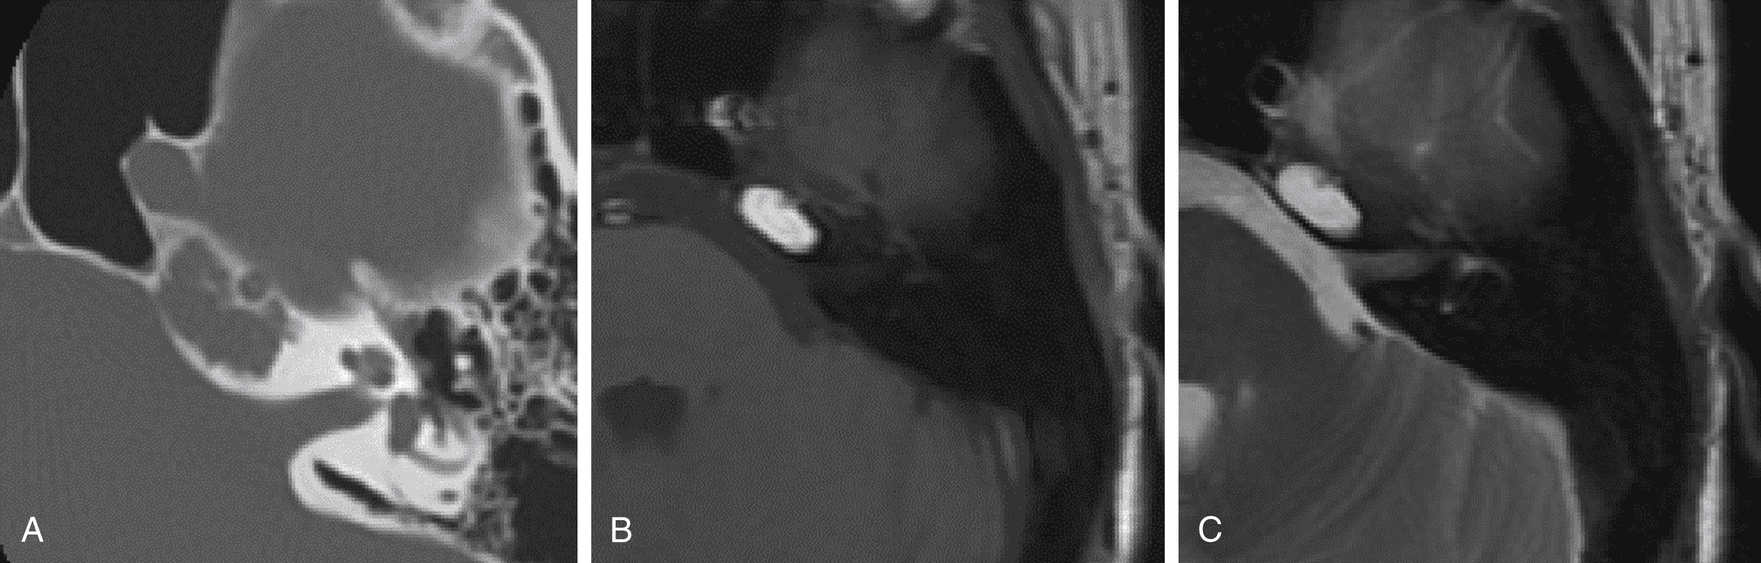
FIGURE 12.3 Petrous Apex Mucocele.
(A) Axial CT demonstrates an expansile fluid-filled air cell without septations at the left petrous apex with a sharp zone of transition along its periphery. (B) T1-weighted axial image demonstrates a unilocular homogeneously hyperintense lesion at the petrous apex. (C) T2-weighted image also demonstrates the lesion to be hyperintense in signal intensity. Differential diagnosis would include a petrous apex cholesterol granuloma. This was pathologically proven to be a mucocele.
Imaging findings: Expansile unilocular cystic lesion related to a pneumatized petrous apex. Smoothly marginated, well-circumscribed cystic lesion.
CT: Well-circumscribed unilocular expansile lesion with a sclerotic smooth margin with a sharp zone of transition. Typically, these are hypoattenuating lesions, but they may be higher than CSF attenuation because of the presence of proteinaceous material.
MRI: Variable signal intensity because of the presence of proteinaceous material on both T1- and T2-weighted images; typically demonstrating minimal rim enhancement because of mucosal enhancement.
Differential diagnosis: Cholesterol granuloma, petrous cephalocele, or congenital epidermoid.
Case 4: External Auditory Canal Atresia (Fig. 12.4)
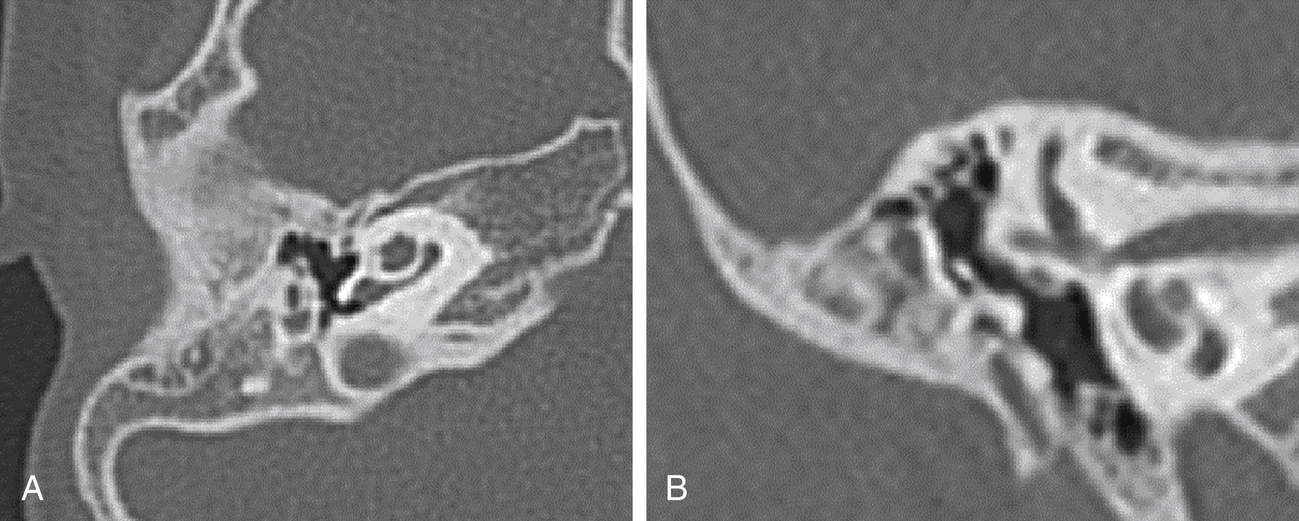
FIGURE 12.4 External Auditory Canal Atresia.
(A) Axial CT at the level of the right EAC demonstrates a bony plate replacing the EAC. Note that this is solid bone and without air cells. (B) Coronal CT in the same patient demonstrates the absence of the EAC and low tegmen. Note that the malleus is fused to the atresia plate.
Imaging findings: Hypoplastic or absent pinna and absence of the EAC. The EAC is located posterior and superior to the condylar fossa. The atresia plate may or may not be pneumatized. The middle ear cleft, measured from the medial aspect of the atresia plate to the cochlear plate, normally should measure >3 mm; <3 mm is not amenable to surgical repair. The position of the middle cranial fossa relative to the atresia plate may be of importance. A low-lying middle cranial fossa relative to the atresia plate should be noted. The ossicular chain is typically abnormal. The manubrium should be partially fused to the atresia plate. Malleoincudal or incudostapedial fusion may be present. Assess ossicles for their integrity. The stapes superstructure is perhaps the most important structure to identify. In addition, determine the presence of the oval and round windows. The facial nerve may take an anomalous course. The vertical/mastoid segment should be identified and is typically in an anterior location. The position of this segment relative to the oval window on coronal images should be determined. If at the level of the oval window on coronal images, the patient may not be amenable to surgery.
Differential diagnosis: None
Refer to Cummings chapter 194 for more details.
Case 5: Cholesteatoma (Fig. 12.5)
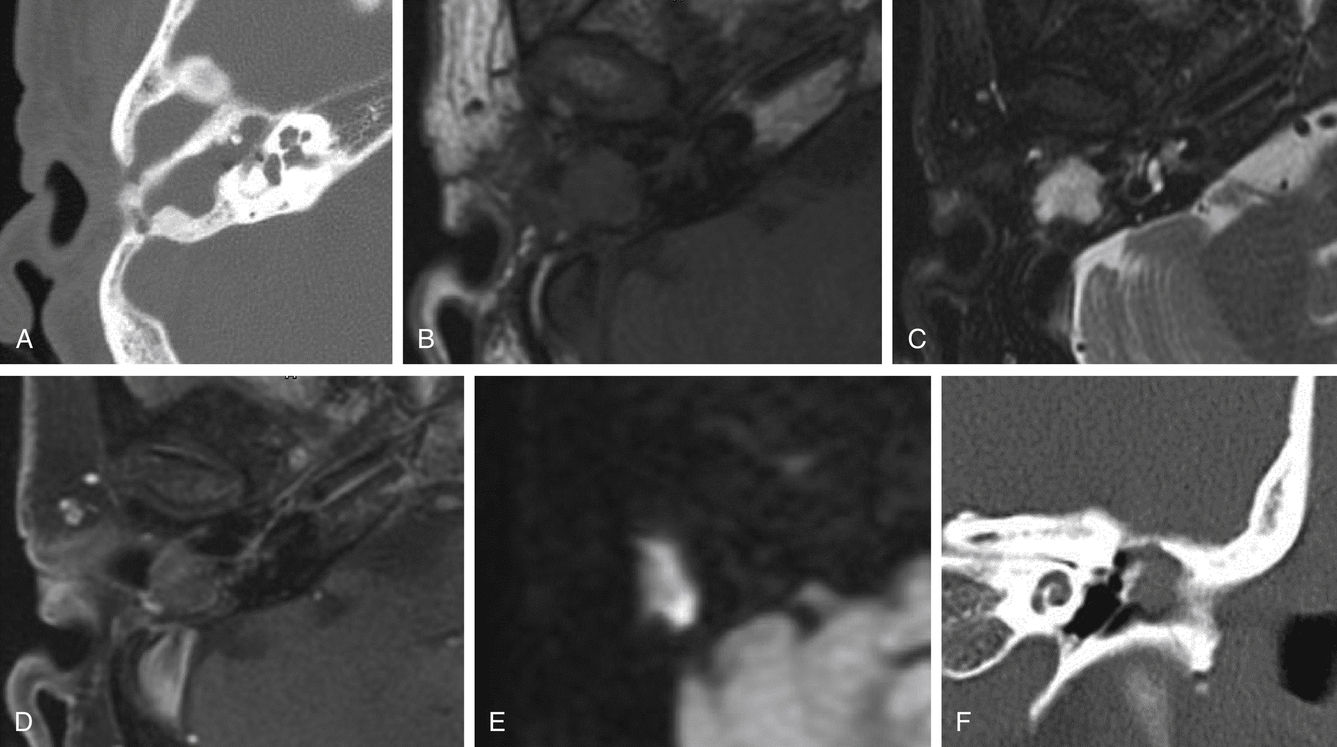
FIGURE 12.5 Cholesteatoma.
(A) Axial CT demonstrates opacification of the right middle ear cavity at the level of the epitympanum, as well as the aditus ad antrum and the mastoid antrum, which is also expanded. Note absence of the body and short process of the incus. (B) MRI, T1-weighted axial image demonstrates that the mastoid antrum, aditus ad antrum, and epitympanum are filled with hypointense material. (C) The corresponding area demonstrates hyperintense material on T2-weighted imaging. (D) Postcontrast axial image demonstrates enhancement within the middle ear cavity consistent with chronic otitis media. However, the material within the mastoid antrum demonstrates mucosal enhancement. (E) Trace diffusion image demonstrates restricted diffusion of the contents of the mastoid antrum consistent with cholesteatoma. (F) In another patient, coronal CT demonstrates a mass in the left Prussak space, with erosion of the scutum consistent with a pars flaccida–type cholesteatoma.
Imaging findings: Representing keratinized squamous epithelium forming mass-like tissue, these lesions are destructive in nature, causing ossicular/bony erosion, a hallmark of these lesions. Cholesteatomas may be congenital or acquired. The congenital type most commonly occurs at the petrous apex. The second most common location is in the attic of the epitympanum. Cholesteatomas in this location are often congenital in origin. The acquired cholesteatomas include the pars flaccida and pars tensa types. The pars flaccida type is located in the Prussak space, which is found between the head of the malleus and the scutum, and, classically, causes erosions of the scutum. The pars tensa type occurs in the middle ear cavity away from the Prussak space.
CT: Soft-tissue mass in the middle ear cavity causing bony or ossicular erosion. A small early cholesteatoma may not demonstrate bony/ossicular erosion. Soft-tissue mass in the Prussak space will cause blunting or erosion of the scutum. At the petrous apex, these lesions will cause bony erosion of the petrous apex.
MRI: All cholesteatomas demonstrate hypointense signal intensity on T1-weighted images, hyperintense signal intensity on T2-weighted images, and no enhancement. All cholesteatomas demonstrate restricted diffusion on the diffusion-weighted images.
Differential diagnosis: Middle ear cavity mass—glomus tympanicum tumor, schwannoma, or middle ear cavity adenoma/adenocarcinoma.
Petrous apex: Cholesterol granuloma, petrous apex mucocele, and petrous apex cephalocele.
Refer to Cummings chapter 139 for more details.
Case 6: Coalescent Mastoiditis (Fig. 12.6)
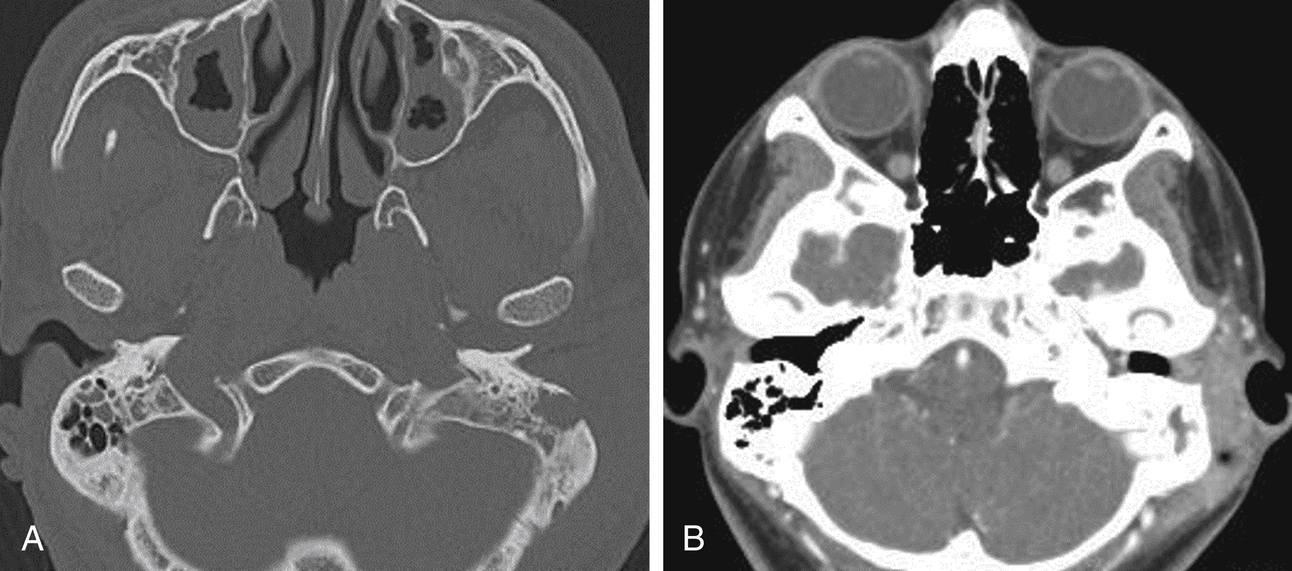
FIGURE 12.6 Coalescent Mastoiditis.
(A) Axial noncontrast CT, bone windows demonstrates opacification of the left mastoid air cells with expansion of an air cell with loss of normal mastoid architecture and erosion of the lateral mastoid cortex. (B) Soft-tissue windows demonstrate adjacent soft-tissue thickening in the preauricular region.
Imaging findings: Opacification of the mastoid air cells with loss of the normal lacy architecture of the mastoid air cells. Because of the infectious/inflammatory process, destructive changes of the walls of the mastoid air cells occur with coalescence of the mastoid air cells into larger opacified air cells. Deossification of the adjacent bone may occur with acute osteomyelitis, and sclerosis in chronic osteomyelitis.
CT: Opacification of the mastoid air cells with coalescence of the mastoid air cells to form larger opacified mastoid air cells with adjacent deossification or sclerosis.
MRI: Variable signal intensity of the mastoid air cell contents because of the presence of purulent material on both T1- and T2-weighted images with associated mucosal enhancement within the air cells. Diffusion abnormality may be present because of exudate.
Refer to Cummings chapter 139 for more details.
Case 7: Gradenigo Syndrome/Petrous Apicitis (Fig. 12.7)
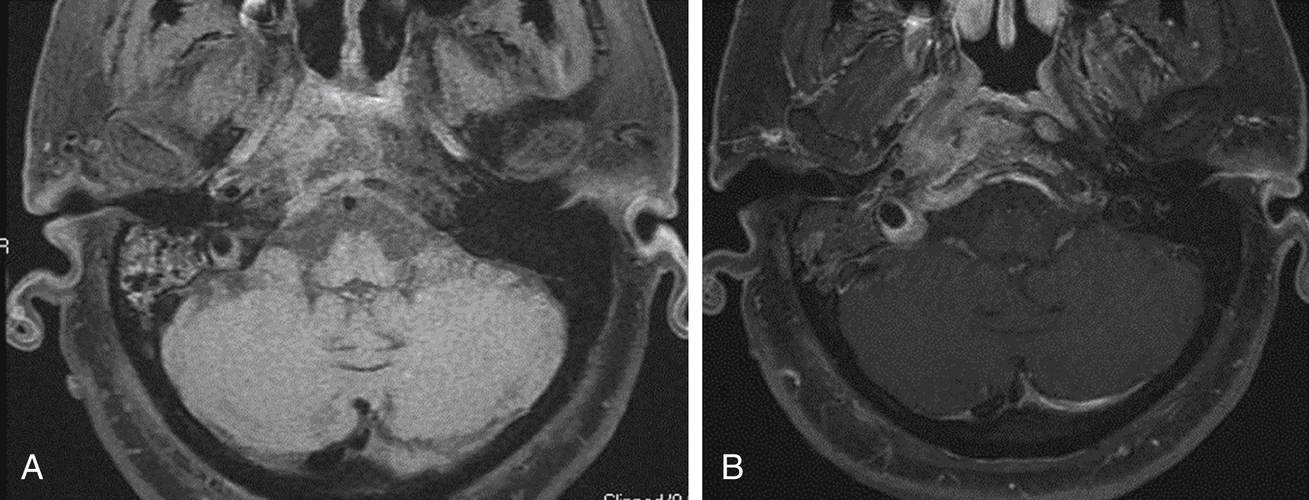
FIGURE 12.7 Gradenigo Syndrome/Petrous Apicitis.
(A) Axial precontrast T1-weighted image with fat saturation demonstrates abnormal intermediate signal intensity at the right petrous apex with thickening of the adjacent dura. Involvement of the prevertebral musculature below the skull base is also present. Mastoid airspace disease is also seen. (B) Postcontrast T1-axial image demonstrates enhancement of the right petrous apex, adjacent dura, and prevertebral musculature.
Imaging findings: Opacification of the petrous apex air cells with destructive change and enhancement of the petrous apex and adjacent dura.
CT: Opacification of the petrous apex air cells with erosion or permeative change of the adjacent bone. Gradenigo syndrome classically consists of the triad of otorrhea, periorbital pain (involvement of the trigeminal nerve), and diplopia (involvement of the abducens nerve).
MRI: Opacification of the petrous apex air cells, which may demonstrate variable signal intensity on T1- and T2-weighted images because of the presence of exudate/proteinaceous material. Postcontrast images demonstrate enhancement of the mucosa of the petrous air cells, as well as exuberant dural enhancement around the petrous apex. Adjacent cranial nerve enhancement may also be seen.
Differential diagnosis: Tumor of the petrous apex, such as metastatic disease.
Refer to Cummings chapter 139 for more details.
Case 8: Vascular Loop Compression (Fig. 12.8)
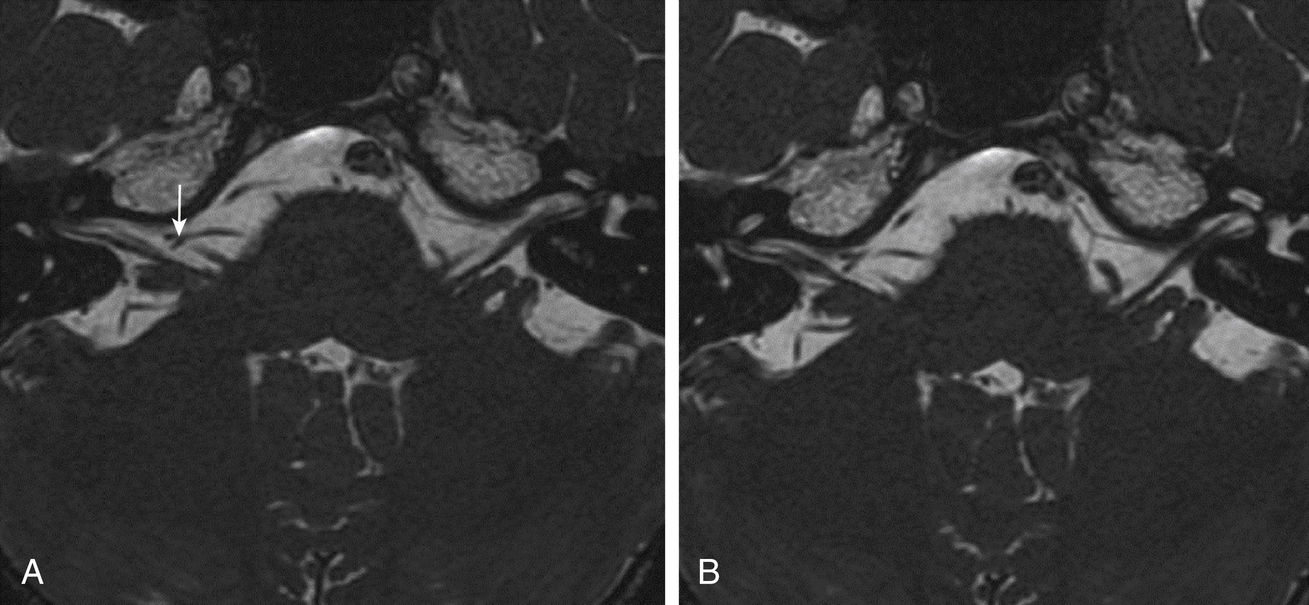
FIGURE 12.8 Vascular Loop Compression.
(A) Thin-section T2-weighted axial (FIESTA sequence) at the level of the right VII/VIIIth nerve complex demonstrates a vessel representing the AICA displacing the cisternal segment of the nerve complex posteriorly (arrow). (B) Adjacent axial slice again demonstrates posterior displacement of the nerve complex.
Imaging findings: Most common vessel is the anterior inferior cerebellar artery (AICA), although a high-riding posterior inferior cerebellar artery or vertebral artery may also be the cause. The vessel may impinge at the root entry zone of the seventh/eighth nerve complex at the level of the brainstem. The vessel may displace the cisternal segment of the nerve or it may extend into the internal auditory canal or IAC (in cases of AICA loop). If the AICA loop extends laterally past the midpoint of the IAC, vascular loop compression may be present because of the lack of space within the IAC. Though veins may also be a causative agent, the pulsatile motion of the artery is suspected as the more common cause of the symptoms.
MRI: Thin-section T2-weighted images are used to determine the relationship of the vascular loop to the nerve complex. Axial as well as reformatted images along the long and short axis of the nerve complex should be examined. The source images from a three-dimensional magnetic resonance angiography (MRA) of the vessels of the skull base may also be of utility to determine whether there is arterial or venous compression.
Case 9: Facial Neuritis (Fig. 12.9)
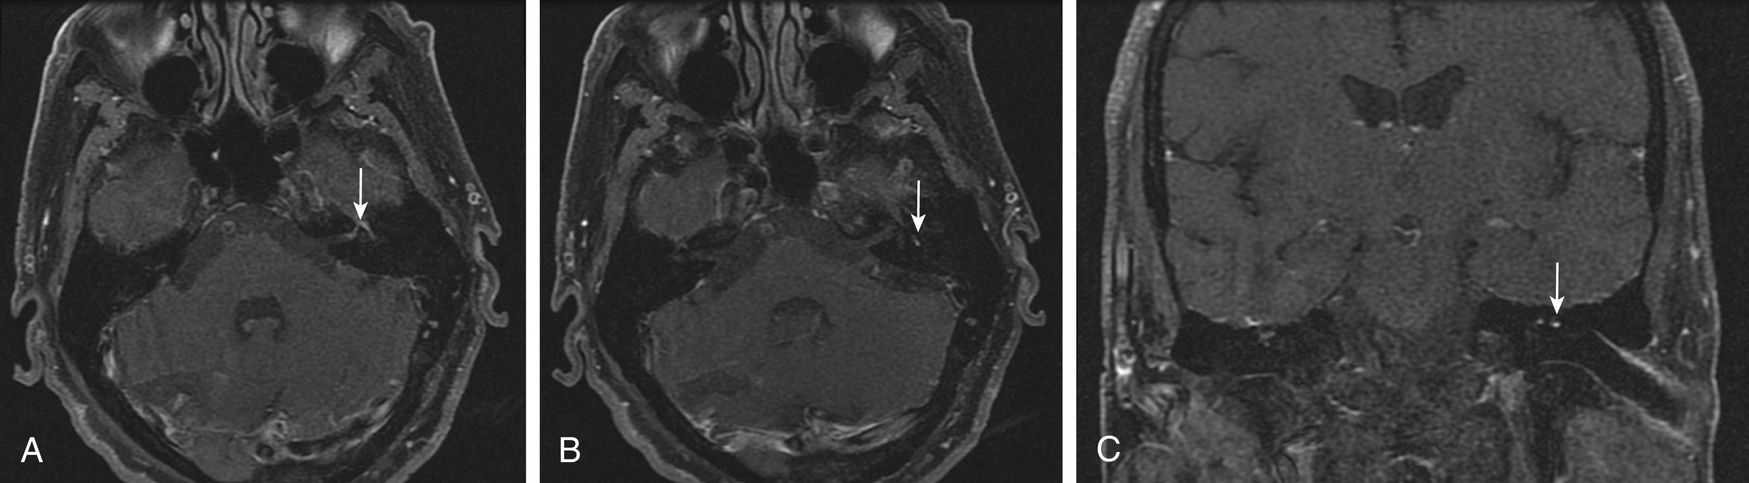
FIGURE 12.9 Facial Neuritis.
(A) On axial postcontrast T1-weighted imaging with fat suppression, there is abnormal enhancement of the left facial nerve from the labyrinthine segment to the geniculate ganglion to the tympanic segment (arrow). (B) Increased enhancement of the left facial nerve extends to the mastoid segment (arrow). (C) Coronal images show the asymmetric nature of the left facial nerve enhancement (arrow).
Imaging findings: In the normal facial nerve, any segment of the intratemporal facial nerve may have enhancement except the labyrinthine segment. The most common area of normal facial nerve enhancement is the geniculate fossa. The mastoid segment is the second most common area of potentially normal intratemporal enhancement. The canalicular segment of the facial nerve should not enhance. In facial neuritis, there is asymmetric and increased enhancement of the facial nerve compared with the normal opposite side. In Bell palsy, there is fusiform enhancement of all segments of the intratemporal facial nerve. Enhancement of the main trunk of the facial nerve below the skull base may also be seen.
CT: Typically negative.
MRI: Asymmetric and increased enhancement of the facial nerve on the affected side compared with the opposite asymptomatic side. In Bell palsy, there is fusiform enhancement and enlargement of the intratemporal facial nerve. Facial neuritis may also manifest as enhancement of the canalicular segment or enhancement of the fundal aspect of the IAC. IAC enhancement in neuritis tends to be indistinct or have a brush-like pattern on postcontrast images.
Differential diagnosis: Facial schwannoma, perineural spread of tumor, metastatic disease, tuberculosis, granulomatous disease, or Guillain-Barré syndrome.
Refer to Cummings chapter 170 for more details.
Case 10: Vestibular Schwannoma (Fig. 12.10)
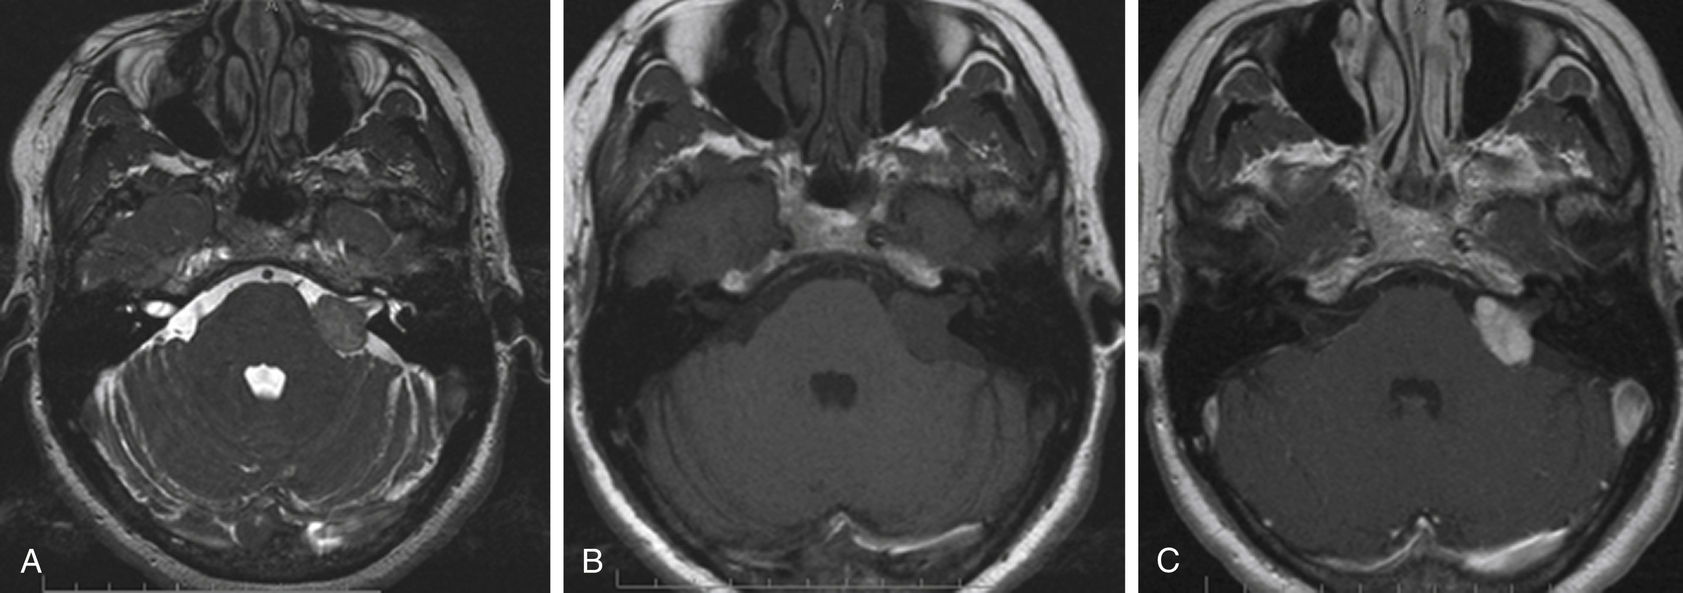
FIGURE 12.10 Vestibular Schwannoma.
(A) Axial thin-section heavily T2-weighted image shows an extra-axial mass in the left CPA. (B) T1-weighted imaging shows the lesion to be lower in signal intensity than normal brain parenchyma. (C) Postcontrast T1-weighted imaging shows avid enhancement of the lesion; note the ice cream cone–like appearance characteristic of vestibular schwannoma. There is no visible dural tail, a finding more typical for meningioma.
Imaging findings: These are the most common tumors to develop in the IAC/CPA cistern. Originating from the vestibular component of the vestibulocochlear nerve, these masses arise at the Schwann cell-glial cell interface. Small lesions are seen within the IAC. The relationship to the crista falciformis is somewhat important to determine before surgery. As these lesions grow, they extend concentrically outward and have a classic “ice cream cone” appearance in the IAC/CPA cistern. Points to determine are the relationship of the mass to the brainstem, as well as to the space remaining in the fundal area of the IAC. Schwannomas follow the nerve of origin, and if there is penetration into the otic capsule, this should be into the vestibule for vestibular schwannoma. Penetration of the cochlea indicates the presence of cochlear schwannoma. Extension into the facial canal indicates a facial schwannoma.
CT: Used to determine bony remodeling. CT may be negative for small lesions. Larger lesions may demonstrate expansion of the IAC, blunting of the porous acousticus, or remodeling of the otic capsule if penetration has occurred.
MRI: These masses are classically hypointense on T1-weighted images and iso- or heterogeneously hyperintense on T2-weighted images, and they demonstrate heterogeneous, moderate to avid enhancement on postcontrast images. Lesions usually do not restrict on diffusion-weighted images. Local mass effect is seen on the brainstem if large, but because of the slow growing nature of these lesions, there are no signal changes of the adjacent brain parenchyma.
Differential diagnosis: Other schwannomas (facial/cochlear), meningioma, metastatic disease, lymphoma, tuberculoma, or granulomatous disease.
Refer to Cummings chapter 177 for more details.
Case 11: Cerebellopontine Angle Meningioma (Fig. 12.11)
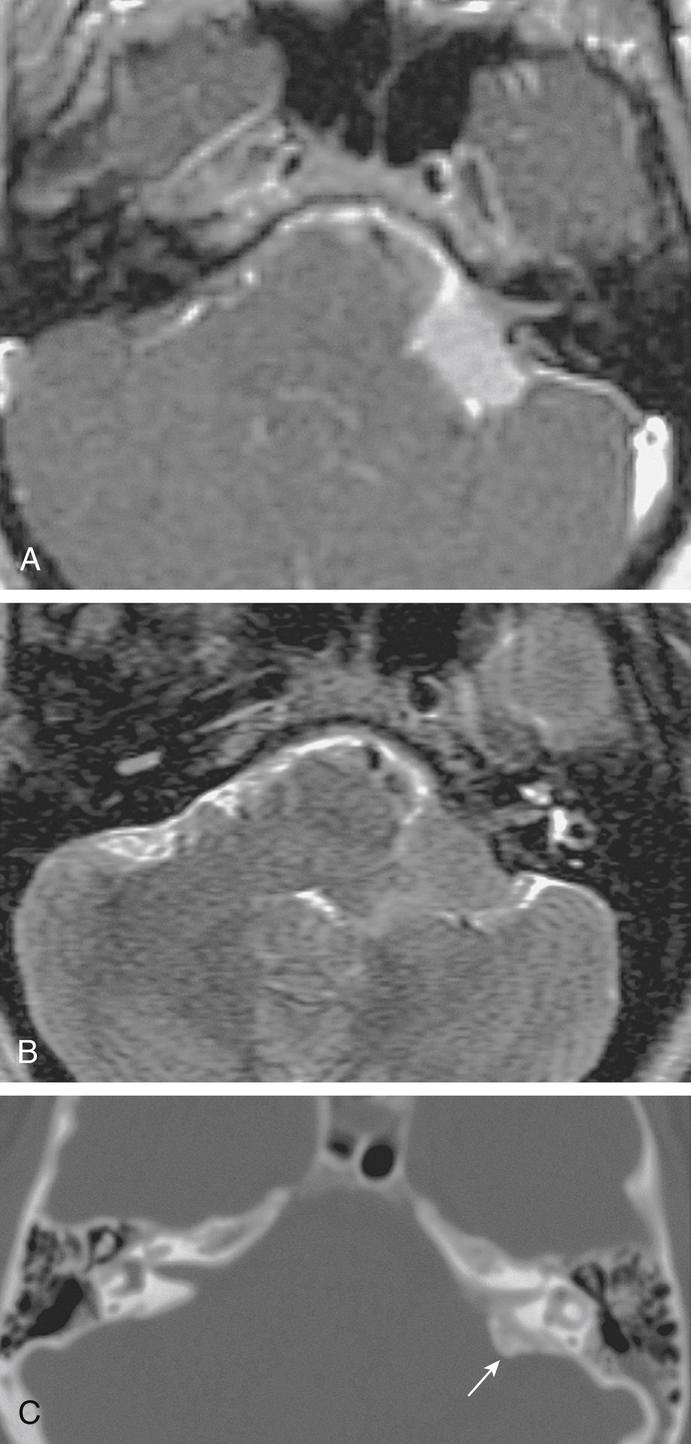
FIGURE 12.11 Cerebellopontine Angle Meningioma with Classic Features on MRI and CT.
(A) Post-gadolinium T1-weighted MRI: The tumor is eccentric to the IAC and broadly dura based with obtuse angles at the bone-tumor interface. This hemispherical tumor shows uniform enhancement. Note the lack of IAC involvement. (B) T2-weighted MRI. The tumor is homogeneously isointense to gray matter. (C) CT bone windows. The tumor shows extensive hyperostosis underlying the dural base (arrow). (From Flint PW, Haughey BH, Lund VJ, et al. Cummings Otolaryngology—Head and Neck Surgery. 6th ed. Philadelphia, PA: Saunders; 2015.)
Imaging findings: Magnetic resonance (MR) and CT are imaging modalities that allow for differentiation of these tumors from other CPA lesions, such as acoustic neuromas. These tumors represent 3% of tumors at this location. Unlike acoustic neuromas, 60% of CPA meningiomas extend to the middle fossa. Meningiomas are typically hemispheric because of the attachments to the posterior petrous wall. A dural tail is often visualized.
MRI: On MRI, meningiomas are variable on T2-weighted images and isointense or slightly hypointense on T1-weighted images. Surface-flow voids may be present, and calcifications and cystic foci cause heterogeneity on MRI images of meningiomas.
CT: Approximately two-thirds are hyperintense relative to the brain. Unlike acoustic neuromas, meningiomas are homogeneous and occasionally calcified. They show homogeneous enhancement to contrast. Hyperostosis of adjacent bone is infrequent but characteristic of meningiomas.
Differential diagnosis: Acoustic neuroma or epidermoid.
Refer to Cummings chapter 177 for more details.
Case 12: Facial Hemangioma (Fig. 12.12)
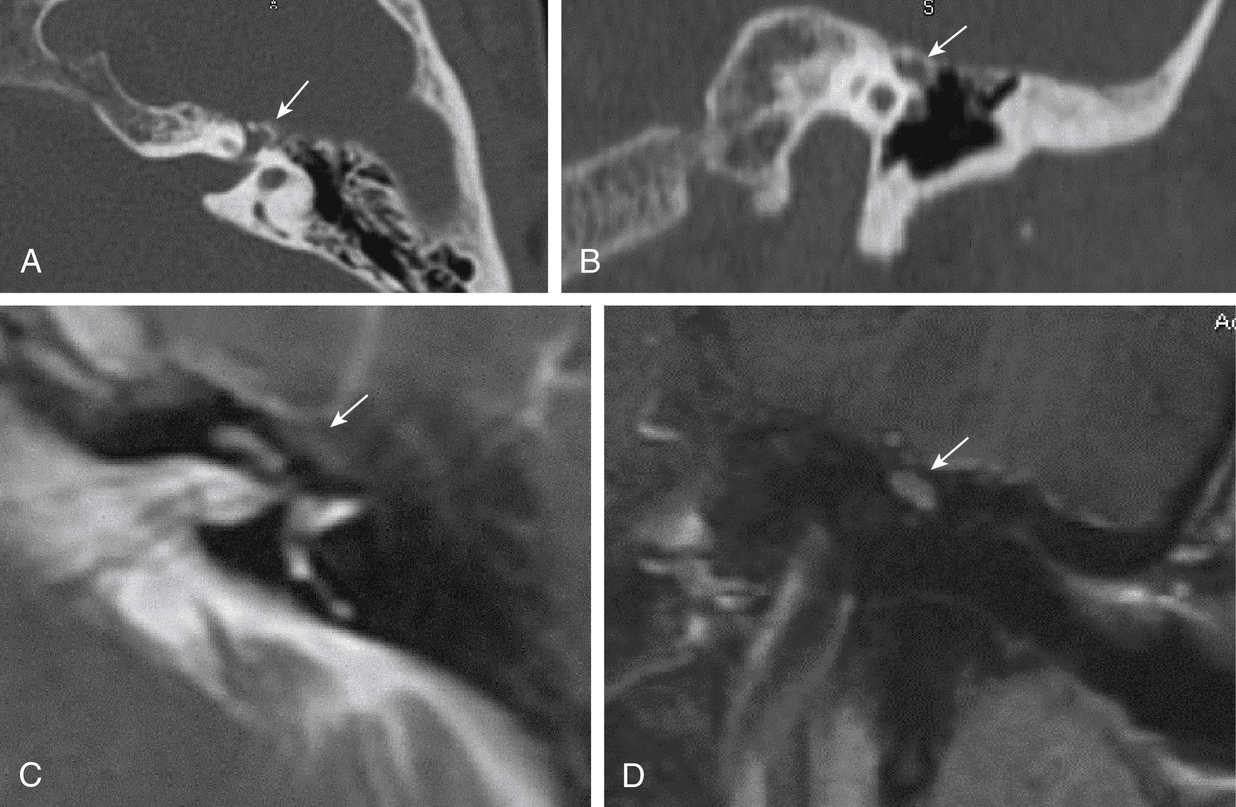
FIGURE 12.12 Facial Hemangioma.
(A) Axial CT at the level of the anterior genu of the left facial canal demonstrates a bony lesion involving the geniculate segment of the facial canal (arrow). (B) Coronal CT at the level of the geniculate segment of the facial canal demonstrates a bony lesion superior to and involving the facial canal (arrow). (C) Axial T2-weighted image demonstrates that this lesion is hypointense in signal intensity demonstrating the bony nature of this lesion (arrow). (D) Postcontrast coronal T1-weighted image demonstrates moderate enhancement of this mass (arrow).
Imaging findings: These lesions are not true tumors but represent venous vascular malformations. They are classically associated with the facial nerve and most commonly occur at the geniculate fossa. Another less common location is the internal auditory canal. Unlike facial schwannoma, patients develop facial nerve symptoms early in the course of the disease process, and early surgical intervention is often required.
CT: As these lesions arise from the adjacent bone, bony proliferation with spicules of bone is seen on CT, which is why these lesions are also named ossifying hemangiomas. The lesions may demonstrate the presence of phleboliths; therefore, calcifications in the IAC should suggest a venous vascular malformation.
MRI: These lesions are typically hypointense on T1-weighted images and markedly hyperintense on T2-weighted images. On the T2-weighted images, focal areas of signal drop-off may be seen, which may represent phleboliths. On postcontrast images, the lesions demonstrate variable patterns of enhancement, from minimal to avid enhancement.
Differential diagnosis: Facial schwannoma or perineural spread of tumor.
Case 13: Superior Semicircular Canal Dehiscence (Fig. 12.13)
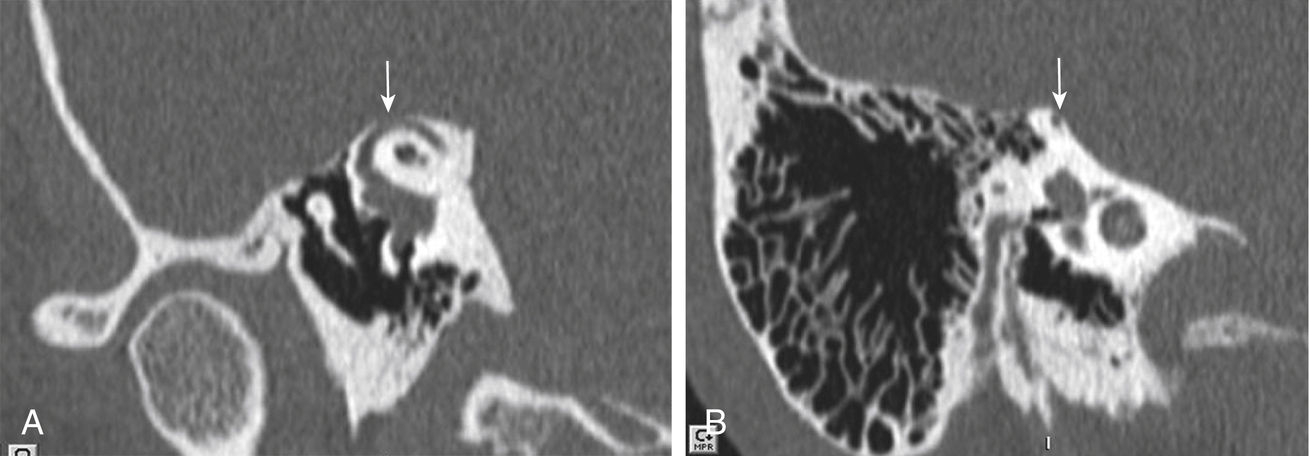
Imaging findings: Bony defect associated with the superior semicircular canal is best demonstrated on high-resolution CT. Patients with this abnormality present with Tullio phenomenon, which is vertigo in response to loud sounds. In addition, rotatory nystagmus, also called oscillopsia, may be present. These findings are the result of the “third window phenomenon” with abnormal processing of the aberrant fluid wave within the perilymph. High-resolution CT best demonstrates the defect of the superior semicircular canal on both sagittal and coronal images. Multiplanar reformatting of the temporal bone may also be performed in the Stenver and Poschl plane.
Differential diagnosis: Petrous apex mucocele, petrous cephalocele, or congenital epidermoid.
Refer to Cummings chapter 135 for more details.
Skull Base
Case 14: Jugular Foramen Meningioma (Fig. 12.14)
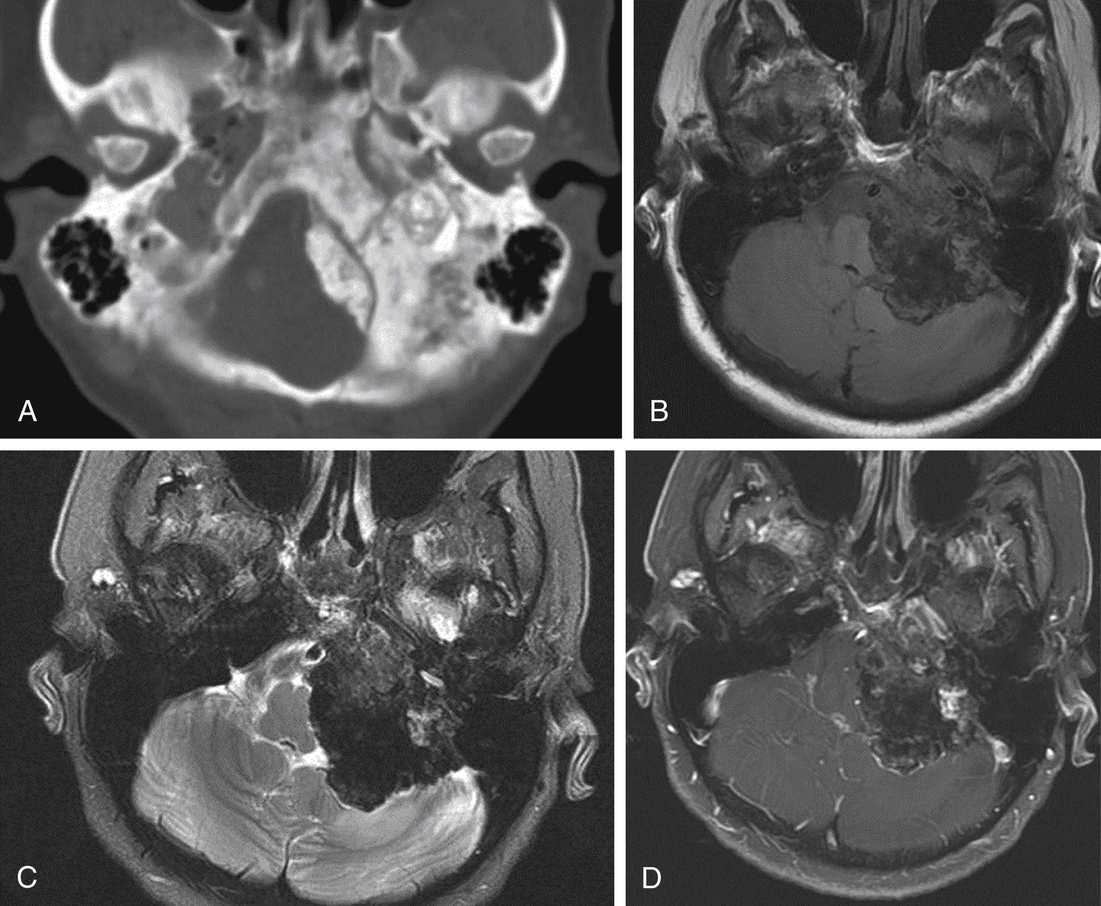
FIGURE 12.14 Jugular Foramen Meningioma.
(A) Axial CT at the level of the jugular foramen demonstrates extensive bony proliferation of the left lateral skull base with effacement of the jugular foramen. (B) Axial T1-weighted image demonstrates bony expansion of the lateral skull base and areas of isointense signal centered at the lateral skull base. (C) Axial T2-weighted image demonstrates the hypointense signal of the expanded lateral skull base with areas of intermediate signal intensity on the T1-weighted image. (D) Postcontrast T1-weighted axial image demonstrates mild enhancement of this lesion. The extensive periosteal reaction is typical for meningiomas in this location.
Imaging findings: Arising from meningothelial rests within the dura, these masses induce a markedly proliferative hyperostosis of bone. There may be expansion of the jugular foramen, and additional foramina of the skull base may be involved. Both intracranial and extracranial extension of the meningioma above and below the skull base may be present.
CT: Soft tissue mass at the level of the jugular foramen with the presence of bony hyperostosis around the jugular foramen.
MRI: Typically isointense to the gray matter cortex on both T1- and T2-weighted images. These masses demonstrate homogeneous avid enhancement on postcontrast images. A dural tail is typically associated with these masses. One-third of the lesions demonstrate diffusion restriction on diffusion-weighted images.
Differential diagnosis: Jugular foramen schwannoma, glomus jugulare tumor, metastatic disease, lymphoma, or plasmacytoma.
Case 15: Glomus Jugulare Tumor (Fig. 12.15)
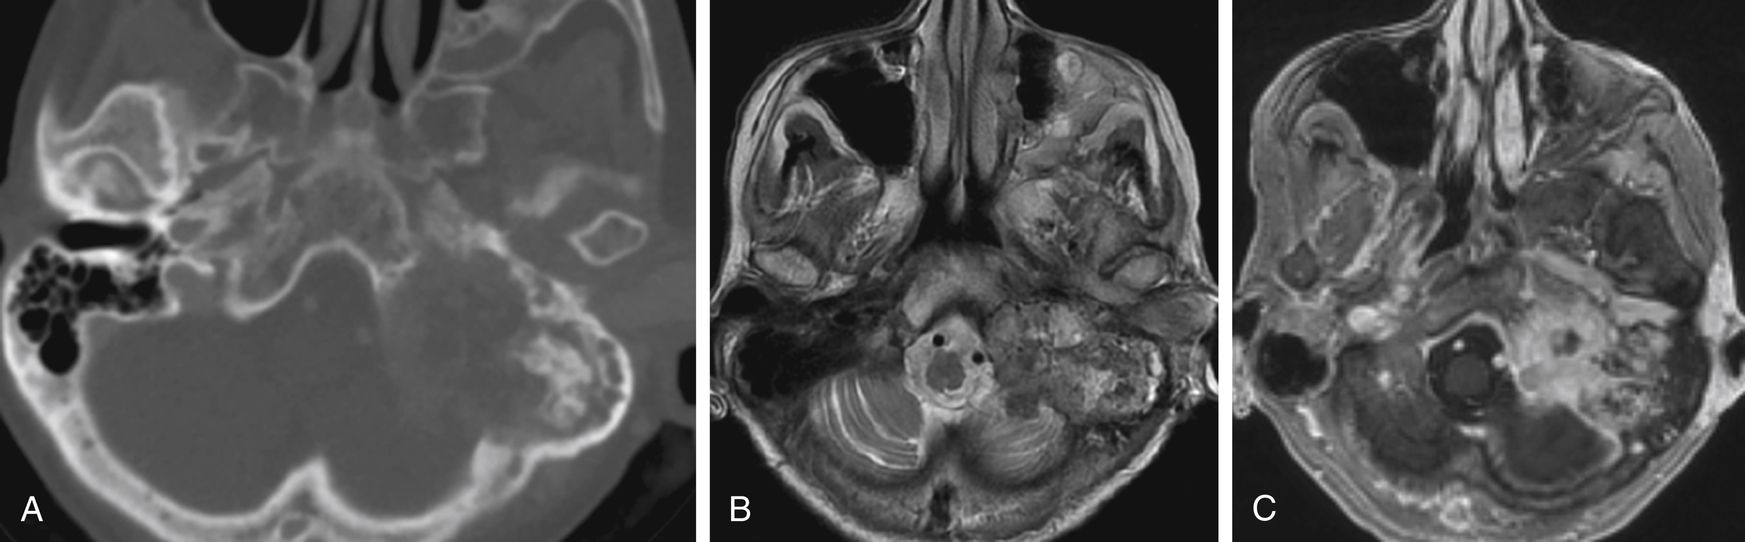
FIGURE 12.15 Glomus Jugulare.
(A) CT imaging shows a destructive left temporal bone mass that involves the left jugular foramen. (B) The mass is primarily hyperintense on axial T2-weighted imaging with smaller areas of hypointensity. (C) The mass shows primarily avid enhancement on the postcontrast T1-weighted imaging.
Imaging findings: Arising from the glomus bodies at the dome of the jugular foramen, these masses are lesions with permeative change and destruction of the adjacent bone.
CT: Soft tissue mass that demonstrates avid enhancement with associated destruction and permeative change of the adjacent bone. Superior extension of this mass may destroy the jugular plate with extension of the mass into the middle ear cavity.
MRI: “Salt-and-pepper” appearance on both T1- and T2-weighted images. On T1-weighted images, these lesions are hypointense with focal areas of hyperintense signal, which may represent hemorrhage. On T2-weighted images, these lesions are hyperintense with focal areas of signal drop-off representing the presence of arterial vessels within the lesion. On postcontrast images, these lesions demonstrate avid heterogeneous enhancement.
Nuclear medicine: These masses show radiotracer uptake on an octreotide scan.
Differential diagnosis: Jugular foramen schwannoma, meningioma, lymphoma, plasmacytoma, or metastatic disease.
Refer to Cummings chapter 177 for more details.
Case 16: Jugular Foramen Schwannoma (Fig. 12.16)
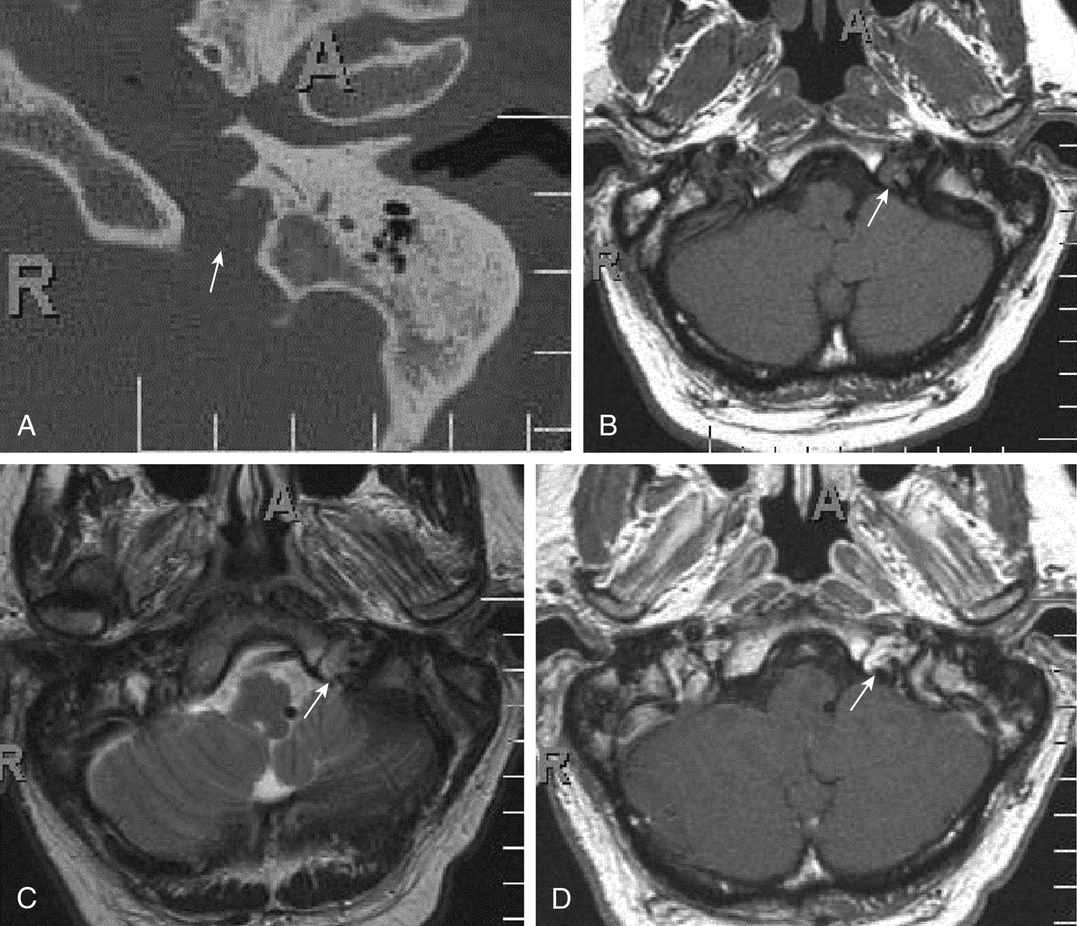
FIGURE 12.16 Jugular Foramen Schwannoma.
(A) CT axial image of the lateral skull base demonstrates subtle erosion of the jugular spine on the left. The walls of the jugular foramen are smooth and sclerotic in appearance (arrow). (B) T1-weighted axial image demonstrates intermediate signal intensity within the left jugular foramen (arrow). (C) T2-weighted axial image demonstrates heterogeneously hyperintense signal intensity (arrow). (D) Postcontrast T1-weighted axial image demonstrates heterogeneous moderate to avid enhancement (arrow). This was a pathologically proven schwannoma.
Imaging findings: These masses arise from cranial nerves IX-XI, most commonly the vagus nerve (X). The lesions present as a soft-tissue mass with expansion and smooth remodeling of the jugular foramen.
CT: Soft-tissue mass, which demonstrates moderate to avid heterogeneous enhancement. There is smooth remodeling of the jugular foramen with sclerotic margins and a sharp zone of transition.
MRI: Typically hypointense on T1-weighted images, heterogeneously hyperintense on T2-weighted images, and demonstrating heterogeneous moderate to avid enhancement on postcontrast images.
Differential diagnosis: Jugular foramen meningioma, glomus jugulare tumor, metastatic disease, lymphoma, or plasmacytoma.
Refer to Cummings chapter 177 for more details.
Case 17: Chondrosarcoma (Fig. 12.17)
Stay updated, free articles. Join our Telegram channel

Full access? Get Clinical Tree


