Optical Coherence Tomography
Andre J. Witkin
Michael Ip
Jay S. Duker
Introduced in 1991, optical coherence tomography (OCT) is a new technique for the high-resolution cross-sectional imaging of various ocular structures. With an axial resolution of 10 microns, it provides the best visualization of retinal architecture of any imaging technique currently available.1,2 In contrast to OCT, conventional ultrasound has a spatial resolution of 150 microns. The recently introduced ultrasound biomicroscopy has a spatial resolution of 20 microns but is limited to imaging of the anterior segment by its penetration depth of 4 mm.3 Two other instruments, the retinal thickness analyzer (RTA, Talia Technology, Tampa, FL) and the Heidelberg retinal tomograph (HRT, Heidelberg Engineering, Heidelberg, Germany) have also recently been introduced. Like OCT, the RTA and HRT are capable of accurately measuring retinal thickness and topography, respectively. However neither instrument provides the detailed cross-sectional images provided by OCT. The high resolution of OCT allows precise measurement of retinal thickness as well visualization of intraretinal layers, particularly the retinal nerve fiber layer (Fig. 107.1).
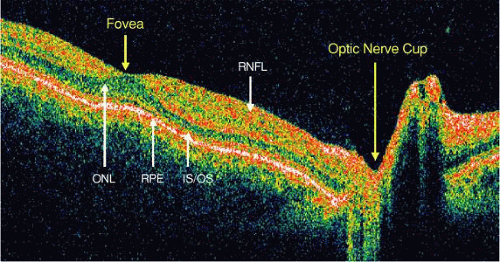 Figure 107.1. OCT from normal eye, showing foveal and optic nerve head contour. Retinal layers are labeled: Retinal nerve fiber layer (RNFL), Outer nuclear layer (ONL), Photoreceptor inner/outer segment junction (IS/OS), Retinal pigment epithelium (RPE). |
The advantages of OCT go beyond its extremely high resolution. Information may be stored on computer disks and easily accessed for future retrieval. Additionally, the use of a computer-controlled fixation light in the imaged eye provides a reproducible means of acquiring OCT images of the same retinal cross-section on follow-up studies. Thus, comparisons of the same retinal area can be made over subsequent visits. When multiple images are taken at different angles through the fixation spot, a general assessment of the imaged area can be performed. Computer software then can be utilized to create a two-dimensional thickness map of the retina (Fig. 107.2). These features make OCT particularly useful in the diagnosis and treatment of macular disease.
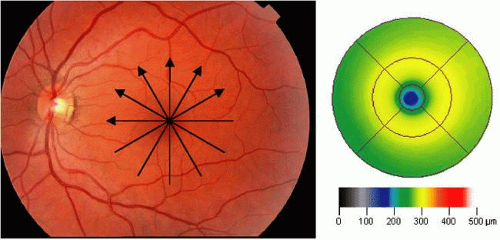 Figure 107.2. Example of a macular map of a normal eye created from six radial OCT images and calculated with standard OCT software. Arrows show direction of six OCT scans. |
Quantitative measurements of nerve fiber layer thickness also can be obtained with OCT, making this a useful test in the management and diagnosis of glaucoma. Scans around the optic disc can be performed to quickly assess the nerve fiber layer thickness, and these scans have become a widely used method to diagnose and follow patients with glaucoma (Fig. 107.3). Other techniques such as stereoscopic videographic imaging, nerve fiber layer photography, scanning laser tomography, or measuring the polarization rotation of reflected light also have been used in the assessment of glaucomatous changes. However, these modalities do not provide direct measurements of nerve fiber layer thickness.
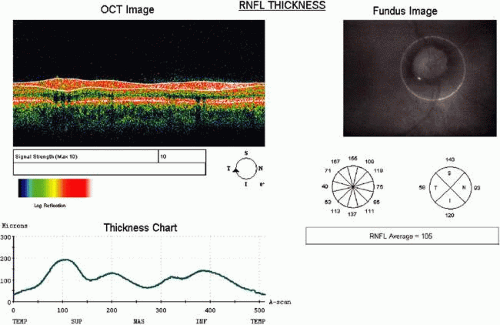 Figure 107.3. Example of a circumpapillary scan. Thickness of the RNFL is calculated and charted. |
The limitations of OCT include the inability to obtain high-quality images through media opacities such as dense cataract or vitreous hemorrhage. The use of OCT also is limited to cooperative patients who are able to maintain fixation for the full acquisition time of 1.3 seconds per section. Computer image-processing techniques can eliminate some eye movements but cannot eliminate image degradation from patients with excessive movement. Use of computer algorithms to measure macular or nerve fiber layer thickness introduces segmentation error in cases where the retinal layers are misidentified by computer software, therefore careful assessment of each thickness measurement is necessary. Because of the complexity of OCT equipment, a high level of operator training also is necessary to obtain quality images. Despite these limitations, OCT has been shown to be highly accurate and reproducible by trained technicians.4,5
Principles of Operation
The operation of OCT is based on the principle of low-coherence interferometry. In this technique, the distances and sizes of different structures in the eye are determined by measuring the “echo” time it takes for light to be backscattered from different structures at various axial distances. This is analogous to A-mode ultrasound, in which the axial length of the eye is measured using sound rather than light.1,2
The OCT hardware can be assembled as an adjunct to a standard slit-lamp or incorporated into a specially designed fundus camera. It allows for structures to be imaged without direct contact with the ocular surface. A fiberoptically integrated light source consisting of a superluminescent diode projects a partially coherent, continuous, near-infrared light at a wavelength of 810 nm. The power of the light source is well below the limits set by the American National Standards Institute (ANSI) for retinal radiation.
In OCT, the axial and transverse image resolution are uncoupled. The axial resolution of the OCT system is determined by the bandwidth of the light spectrum. In commercial systems, superluminescent diodes with bandwidths of ∼25 nm have been employed, allowing ∼10 μm axial resolution in the human retina. Systems using light sources with wider bandwidths also have been used in the research setting; these systems are termed ultrahigh resolution OCT and have demonstrated axial resolutions of ∼3 μm or less.6,7 Transverse resolution is independent of the bandwidth of the light, and is dependent on the optical focusing of light on the retina. Transverse resolution is limited to 10 to 15 μm by natural aberrations in the human eye.6
For slit-lamp use, the light is focused with a standard mounted +78 diopter condensing lens and computer-operated scanning mirrors onto the area of interest. The optical beam from the light source is directed onto a partially reflective mirror (optical beam splitter). This mirror splits the light into two beams. One beam is directed into the patient’s eye and is reflected from intraocular structures at various distances. This reflected beam consists of multiple echoes and provides information about the distance and thickness of various intraocular tissues. The second beam is reflected from a reference mirror at a known spatial location. This beam travels back to the beam splitter, where it combines with the optical beam reflected from the patient’s eye. When the two light beams coincide, they produce a phenomenon known as interference, which is measured by a photodetector.
The beam of light reflected from the reference mirror coincides with the beam of light reflected from a given structure in a patient’s eye only if both pulses arrive at the same time. This occurs when the distance that light travels to and from the reference mirror equals the distance that light travels when it is reflected from a given intraocular structure. The position of the reference mirror can be adjusted so that the time delay of the reference light beam matches the time delay of light echoes from various intraocular structures. Thus, the interferometer can precisely measure the echo delay of intraocular structures.8,9
By measuring the echo delay of various intraocular structures, a translated axial image similar to A-mode ultrasonography is produced. When successive axial measurements at different transverse points are combined, a tomographic or cross-sectional image of tissue is obtained. OCT images are displayed in false-color to enhance differentiation of structures. Bright colors (red to white) correspond to tissues with high relative optical reflectivity, whereas darker colors (blue to black) correspond to areas of minimal or no optical reflectivity. Cursors may be placed on the image to give exact measurements to the nearest micron. The image produced is enlarged by a factor of two in the vertical direction for better image readability; this may in some cases distort the image (e.g., exaggerate the depth of the nerve cup).
The instrumentation for OCT operates analogously to a video fundus camera. The transverse position of the OCT beam is controlled by a mechanical scanning mirror. When the beam is scanned, it produces a pattern on the retina visible to both the patient and the operator. Thus, the exact location of the topographic image on the fundus can be determined. The field of view at lowest magnification is 30 degrees. The live fundus image may be viewed either directly through the ocular or via a video camera.
The first commercial OCT system became available in 1996. Commercial systems have since undergone numerous revisions. A third generation OCT instrument, the StratusOCT, or OCT3, was introduced in 2002 (Carl Zeiss Meditec, Inc., Dublin, CA). The StratusOCT achieves a fivefold increase in imaging speed from previous systems, enabling higher pixel density images and allowing better visualization of intraretinal layers. The StratusOCT takes 512 axial scans per OCT image, compared with 100 axial scans in the original commercial OCT system.
Using the latest OCT software, a number of imaging protocols are available. For retinal applications, the most widely accepted and useful scanning modes are the retinal thickness mapping and fast retinal thickness mapping modes (Fig. 107.2). These scanning modes acquire six linear images centered at the point of fixation, spaced 30 degrees apart and typically 6 mm in length. The retinal thickness mapping protocol obtains six high pixel–density images acquired individually. Each image in this mode can be examined separately to assess macular anatomy, or the images can be combined and measured using the standard computer software to obtain a topographic thickness map of the macula. A second protocol, the fast retinal thickness mapping mode, acquires six lower pixel–density OCT images at once, and is usually used to create a topographic map only. Individual images as well as topographic thickness maps have been shown to be useful in a variety of retinal diseases.
For glaucoma, the most widely applied imaging protocol has been a circular scan around the optic disc, 3.4 mm in diameter (Fig. 107.3). OCT software determines the retinal nerve fiber layer thickness by measuring a change in signal from the highly backscattering nerve fiber layer to the less backscattering ganglion cell layer. Thickness measurements then are compared to a standard database of normal retinal nerve fiber layer thicknesses from normal eyes. Another protocol used in glaucoma is the optic nerve head scan, which involves imaging six radial line scans through the optic nerve head, spaced 30 degrees apart (Fig. 107.4). Data from the images then are analyzed to determine a number of clinically useful measurements.
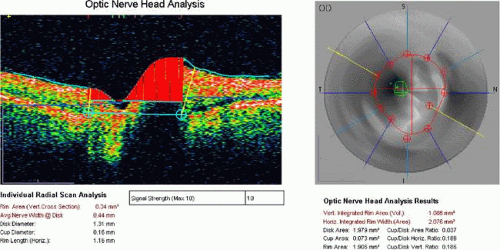 Figure 107.4. Example of an optic nerve head scan. Six radial OCT images are combined to create a topographic map. The cup and disc are measured, and various useful values are calculated. |
Clinicopathologic Correlation: Normal Eyes
Initial studies using postmortem eyes showed good correlation between OCT images and histologic sections. Subsequent in vivo analysis demonstrated the ability of OCT to image the substructure of the retina. Figure 107.1 shows an OCT image of a normal fovea and optic disc taken along the papillomacular axis. Anatomic features, such as the fovea, optic disc, and retinal profile are evident. The vitreoretinal interface is noted by the contrast between the nonreflective vitreous and the reflective surface of the retina. The foveal center demonstrates normal retinal thinning and has a characteristic depression in its contour. The optic disc demonstrates normal nerve head contour and cupping. The retinal nerve fiber layer, inner plexiform layer, outer plexiform layer, photoreceptor layer, retinal pigment epithelium (RPE), and choroid all are well delineated.
The outer aspect of the neurosensory retina is bounded in the OCT images by a highly reflective red layer about 70 microns thick that was originally thought to represent choriocapillaris and RPE. However, with the aid of newer commercial OCT systems, capable of improved visualization of retinal layers, as well as comparison to ultrahigh-resolution OCT images, the outer reflective layer can be separated into two closely spaced reflective layers. The inner of these two layers represents part of the photoreceptors, likely the junction between the inner and outer segments, and the outermost reflective layer represents the RPE or RPE–choriocapillaris (Fig. 107.1).7,10,11 The region just anterior to the photoreceptor outer segment–RPE layer is typically weakly reflective and corresponds to the outer nuclear layer, or photoreceptor cell bodies. The high contrast between the outer reflective layers and the outer nuclear layer in OCT images provides a clear boundary in the computation of retinal thicknesses using computer segmentation algorithms.
Retinal blood vessels are evident in OCT images by their shadowing of deeper retinal structures. In some cases, the posterior hyaloid is visible as a thin, moderately reflective line anterior to the retina. The highly reflective red layer at the inner margin of the retina corresponds to the nerve fiber layer. In the OCT image taken along the papillomacular axis, the thickness of the nerve fiber layer increases from the fovea to the optic disc (Fig. 107.1). Circular tomographs taken around the disc demonstrate modulations in thickness consistent with the superotemporal and inferotemporal bundling of the nerve fibers. Because retinal detail is so exquisitely imaged by OCT, this imaging modality can be applied to a large number of clinical entities.
Applications
Retina
Angiographic imaging techniques using injectable dyes have been used for decades and have been fundamental in the diagnosis and understanding of retinal diseases. OCT allows retinal imaging without dye injection and enables the visualization of cross-sectional anatomic details and quantifiable measurements not possible with traditional retinal imaging methods. OCT has been shown to be a useful adjunct to angiography in diagnosing and managing a wide variety of retinal diseases.
Macular Edema
OCT offers an objective test for the serial, quantitative evaluations of retinal thickness.12 Increases in retinal thickness usually are caused by an accumulation of intraretinal fluid, which widens the distance between the well-delineated anterior and posterior boundaries of the neurosensory retina. Because of the high axial resolution of OCT, retinal thickness can be measured to within 10 microns and followed serially. OCT has been shown to be a more sensitive method of detection of macular edema than is dilated fundus examination using a 78-diopter lens,13 and has been shown to be equally effective as fluorescein angiography (FA) in detecting macular edema.14
Many retinal diseases, including diabetic retinopathy, age-related macular degeneration, uveitis, vascular occlusion, vitreomacular traction, and epiretinal membrane cause secondary retinal edema. In patients with macular edema, OCT can visualize one or more of three findings: diffuse retinal thickening, subretinal fluid, or cystoid macular edema. Cystoid macular edema is characterized by fluid accumulation in intraretinal cystic spaces (Fig. 107.5). OCT images demonstrate cystic areas of decreased reflectivity within the neurosensory retina consistent with the known histopathology of this entity. Again, the ability to quantify the extent of thickening is useful not only in the diagnosis of this disease but also in assessing the response to treatment (topical medications, periocular and intraocular steroids, vitrectomy, etc.).
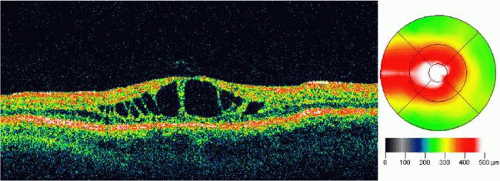 Figure 107.5. OCT image through the fovea of a patient with cystoid macular edema. Note the increase in thickness demonstrated as a change in color on the macular map. |
Using OCT, macular edema can be quantified easily with the retinal mapping or fast retinal mapping protocols. Using these techniques, a topographic map of retinal thickness can be obtained at each patient visit, allowing close tracking of retinal thickness over time. The most useful measurement is the foveal thickness at the center of the macular thickness map. Foveal thickness is calculated as a mean of central axial lines from each of the six radial OCT images.
Diabetic Retinopathy
Macular edema is the leading cause of decreased vision in patients with diabetic retinopathy. Although “clinically significant macular edema” continues to be a clinical diagnosis, OCT can provide the clinician with additional useful information. OCT images can measure the amount of retinal thickening present; the amount of thickening has been shown to correlate with visual acuity.15 Additionally, OCT can be used to follow the clinical response to focal laser treatment for clinically significant macular edema, and successful resolution of macular edema after laser treatment may be observed. Recently, intravitreal corticosteroid injection also has been used in the treatment of diabetic macular edema. OCT has been shown to be a sensitive method to measure changes in macular thickness following intravitreal triamcinolone treatment, and it may be useful in directing retreatment with intravitreal corticosteroids.16
Age-Related Macular Degeneration
In the imaging of macular pathology from age-related macular degeneration (AMD), OCT has clinical utility in several areas. OCT can help distinguish central serous retinopathy from exudative age-related macular degeneration in older patients. Retinal edema from choroidal neovascularization, particularly when it involves the fovea, can have a profound effect on visual function. Because of its ability to measure retinal thickness accurately, OCT is useful in assessing the response to treatment for choroidal neovascularization.
OCT also can differentiate among serous, hemorrhagic, and fibrovascular RPE detachments.17 Serous RPE detachments present as focal elevations of the reflective RPE band over an optically clear space (Fig. 107.6). The angle of the edge of the detachment is typically acute, probably because of tight adherence of RPE cells to the Bruch membrane at the edge of the detachment. Hemorrhagic RPE detachments are distinguished by a moderately reflective layer directly beneath the detached RPE, corresponding to the sub-RPE blood (Fig. 107.7). Fibrovascular RPE detachments, in contrast, demonstrate moderate reflectivity throughout the entire sub-RPE space (Fig. 107.8). This is probably the result of the lower scattering coefficient of the fibrovascular proliferation as compared to blood.
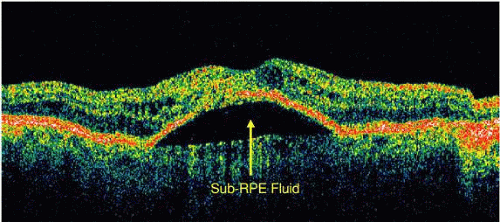 Figure 107.6. OCT image through the fovea of a patient with a serous RPE detachment secondary to age-related macular degeneration. Note the sharp contrast between the posterior border of the detached RPE band and the underlying serous fluid. |
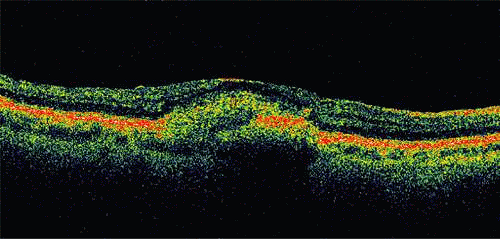 Figure 107.7. OCT image through the fovea of a patient with a hemorrhagic RPE detachment secondary to age-related macular degeneration. Note the reflective layer directly beneath the detached RPE, which corresponds to sub-RPE blood. Significant shadowing of deeper layers is present because of the attenuation of the OCT probe beam by the hemorrhage. |
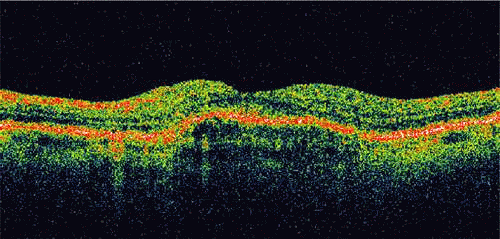 Figure 107.8. OCT image through the fovea of a patient with a fibrovascular RPE detachment secondary to age-related macular degeneration. Note the moderately reflective layer throughout the sub-RPE space, which corresponds to fibrovascular tissue.
Stay updated, free articles. Join our Telegram channel
Full access? Get Clinical Tree
 Get Clinical Tree app for offline access

|