1 Ocular Examination
VISUAL ACUITY
Table 1.1 shows the pathological and physiological factors that can limit visual acuity. This process can be influenced by physiological and pathological factors anywhere along this pathway.
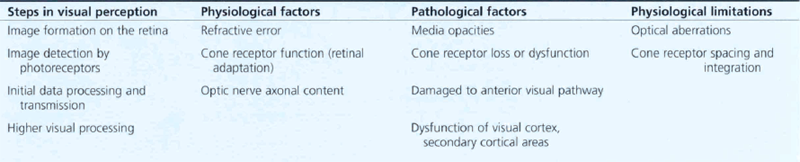
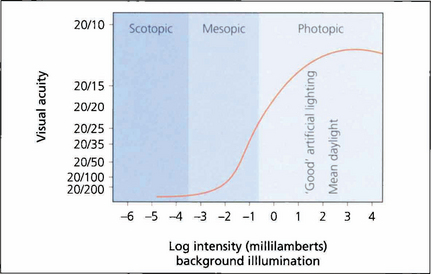
Fig. 1.1 As high-resolution central vision depends on cone receptors any reduction in cone function will greatly compromise acuity. This graph shows visual acuity plotted against background illumination. The best acuity in the scotopic (rod-sensitive) region of the curve is 20/200 (6/60), whereas under photopic (cone-sensitive) conditions acuity can increase to approximately 20/15 (6/5). The curve flattens once optimal conditions are reached and then reduces owing to the effect of dazzle.
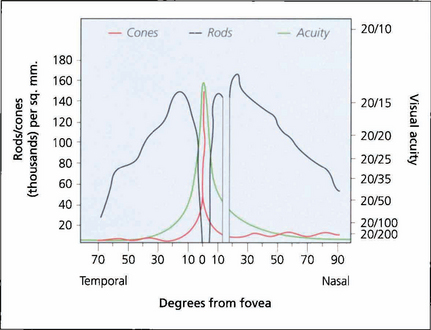
Fig. 1.2 Visual acuity and cone and rod density plotted against degrees from the foveal centre. There are no blue cones at the fovea.
MEASUREMENT OF VISUAL ACUITY
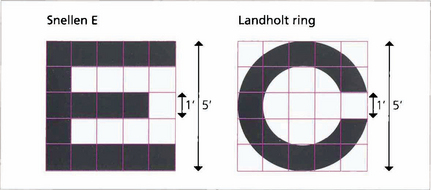
Fig. 1.3 Each individual component of a letter or shape must be resolved to be identified. A letter ‘E’ viewed at the limit of resolution (20/20, 6/6) subtends 5 min of arc, each individual component subtending 1 min. The same principle is used in the construction of the Landholt rings.
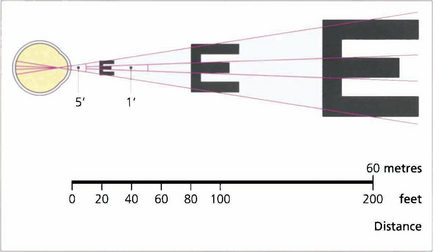
Fig. 1.4 Acuity charts are constructed with rows of letters of different sizes. Letters are constructed so that they subtend the same visual angle at a specified distance of up to 200 feet. Thus the largest letter should be resolvable by a normal eye from 200 feet (60 metres) away and the smallest at 20 feet (6 metres). If the chart is read at 20 feet a normal eye will read all the letters. Any loss of resolution will result in the eye being able to read only larger letters. The test distance is then divided by this line and is expressed as:
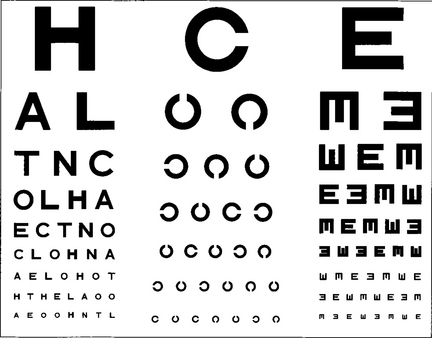
Fig. 1.5 Professor Snellen developed his chart in Utrecht in 1863. The Snellen chart is accepted as the standard chart for clinical practice but it has some problems. Some letters are more legible than others; for example, ‘L’ is easier to read than ‘E’. Patients must also be literate. Modifications to avoid this include Landholt rings where the patient must identify the orientation of a gap or illiterate charts where a cutout letter ‘E’ is matched with the same letter in different orientations.
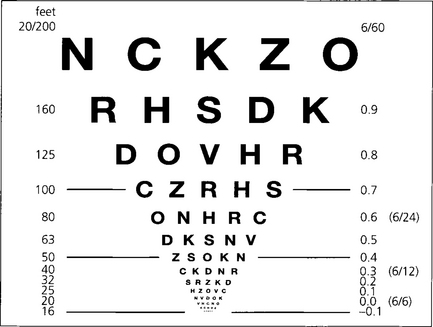
Fig. 1.6 Snellen charts also have the defect of different numbers of letters on each line causing crowding phenomena and nonproportional spacing between letters and lines. Furthermore, the measured range does not extend far enough into low visual acuity ranges. The Bailey–Lovie, Early Treatment Diabetic Retinopathy Study (ETDRS) or LogMAR (log of minimum angle of resolution) chart overcomes these problems. It gives a progressive linear assessment of acuity and has become the standard for clinical research. Each row has five letters with a doubling of the visual angle every three lines. It is read at 4 m and covers Snellen equivalents from 20/200 to 20/10. Each letter read is scored as –0.02 and each row as –0.1 (5×-0.02). Visual acuity is given as the log value of the last complete row read plus –0.02 for each letter read on the row beneath. An acuity of 1.0 equates to 20/200, 0.3 to 20/40, and 0.0 to 20/20. This contrasts with Snellen charts in that the lower the value for visual acuity, the better the vision.

Fig. 1.7 Traditionally near vision testing is done using the appropriate reading correction with a chart of different font sizes. This has, however, no physiological basis and a more scientific method is to use a reduced LogMAR chart such as the MN Read card at a standardized distance and illumination. The text in this chart conforms to LogMAR principles; in addition each paragraph is standardized for length of words, sentences and grammatical complexity. It also allows for reading speed to be measured. Patients need to read at 80 words a minute or better to have functional near vision at that size of print.
©1994, Regents of the University of Minnesota, USA. MNREAD™ 3.1–1/3600.
TESTING ACUITY IN CHILDREN
Visual acuity assessment in children presents particular problems. Good results can be achieved only with time and patience and by selecting the right test for the age of the child. These include qualitative tests such as the child turning to fixate a face or light, suppression of optokinetic nystagmus following rotation or objecting to occlusion of one eye. While semiquantitative measurements are available, for instance picking up ‘hundreds and thousands’ sweets or following small balls quantitative tests are most informative. For infants forced-choice preferential looking or visual evoked potentials (VEPs) can be used; both give different results. Older verbal children can use picture cards (Cardiff cards, Kay’s pictures) and from the age of three may manage matching letter tests (e.g. the Sheridan–Gardiner test; see Ch. 18). Caution is necessary when using Snellen charts with single letters because of the phenomenon of ‘crowding’ – being able to see single letters more easily than rows of letters – which can overestimate true acuity.
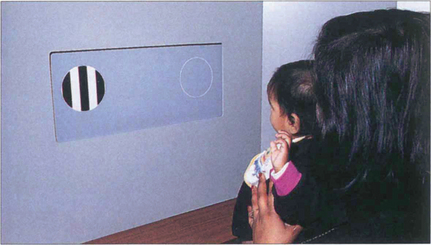
Fig. 1.8 With preferential viewing techniques the child is shown two cards: one has a grating, the other has the same uniform overall luminance. If the child can distinguish the grating, he or she looks at this ‘preferentially’ – presumably because it is more interesting.
By courtesy of Professor A Fielder.
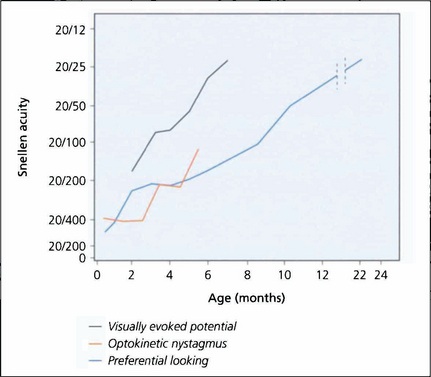
Fig. 1.9 What is known of the development of visual acuity with age depends to some extent on which method of testing was used in studies as VEPs, optokinetic reflexes or preferential looking techniques all give different results. The latter is the most commonly used technique; it shows that infants do not reach adult levels of acuity until 2–3 years of age.
By courtesy of the Editor, Survey of Ophthalmology 1981; 25: 325–332.
PHYSIOLOGICAL LIMITATION OF ACUITY
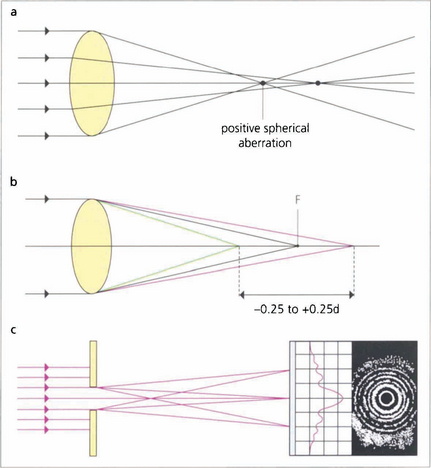
Fig. 1.10 (Top) Spherical aberration. The refractive surfaces of the eye have more effective power at the periphery than at the central paraxial zones. This causes the edge of an image to be blurred by the resulting ‘line spread’. Spherical aberration increases with pupillary dilatation. The eye normally has a positive spherical aberration (see Ch. 11).
WAVEFRONT ANALYSIS
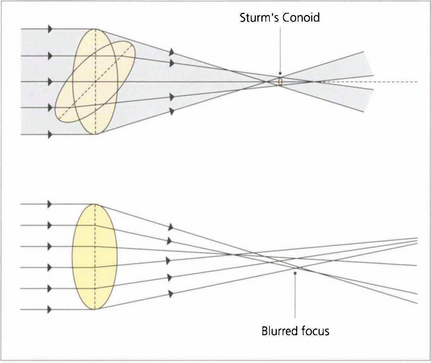
Fig. 1.11 With regular astigmatism, light is brought to focus at two points. Sturm’s conoid is the circle of least confusion that can be brought to focus by a sphero–cylinder combination. With the imperfect optics of the eye light is bought to focus in an irregular manner. This caused by higher-order aberrations which can be demonstrated by wavefront analysis and described mathematically by Zernicke polynomial curve fitting equations.
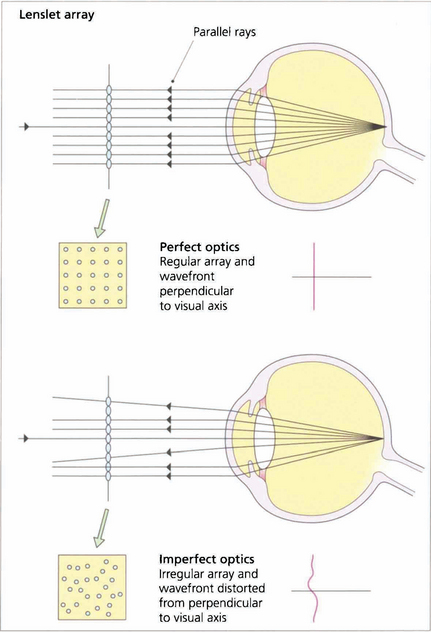
Fig. 1.12 In a perfect optical system rays of light exiting the eye from a spot projected on the fovea should exit the eye parallel to the visual axis with a wavefront perpendicular to the visual axis.
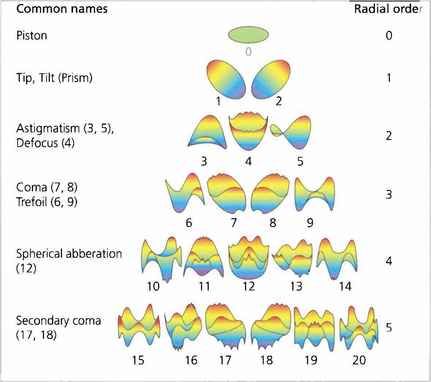
Fig. 1.13 The wavefront deformation from a plane perpendicular to the visual axis can be expressed in terms of a mathematical equation consisting of a series of polynomials. These Zernicke polynomials describe an increasing cascade of aberrations. Low-order aberrations (first and second order: sphere and cylinder) account for more than 90 per cent of refractive error in a normal eye. Third order is coma and fourth order is spherical aberration. Spherical aberration is the clinically most important after sphere and cylinder. Higher orders account for less and less of the aberration. The system becomes extremely complicated as some aberrations can cancel out others; treating one aberration in the absence of all can therefore actually make vision worse.
CONTRAST SENSITIVITY

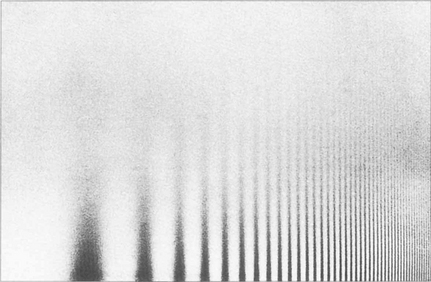
Fig. 1.14 Sine wave gratings can be used to assess contrast sensitivity and spatial frequency simultaneously. The patterns can be generated electronically on a television screen or graphically on a test card or chart. The spatial frequency of the stripes increases along the horizontal axis from left to right (that is, the stripes get thinner and closer together) and the contrast decreases on moving up the vertical axis. As the frequency of the stripes increases to the minimum resolvable acuity (30–40 cycles per second or 1–0.5 min of arc), there is insufficient contrast to distinguish the stripes from the background. As a result the highest resolvable frequencies can be seen only at high contrast (this equates to standard visual acuity tests). Beyond this point the grating appears as uniform greyness. As the spatial frequency decreases there is insufficient contrast to distinguish the stripes from the background illumination.
By courtesy of Mr J W Howe.
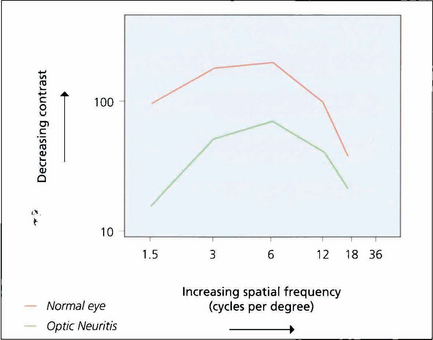
Fig. 1.15 If grating visibility is plotted on a graph, the axes being contrast and spatial frequency, a bell-shaped curve known as a contrast sensitivity curve is formed. At the apex of the curve the subject reaches their highest level of sensitivity at low contrast levels and changes in contrast of 1 per cent or better can be detected. The graph shows the curves of a normal eye compared to the fellow eye with optic neuritis. Although the affected eye has good acuity it will have poorer performance in low-contrast conditions such as poor lighting.
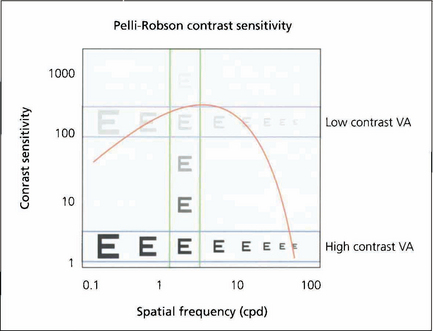
Fig. 1.16 This shows how the different measurements of visual acuity and contrast acuity interrelate. High- and low-contrast visual acuity charts measure a change in spatial frequency at a fixed contrast (horizontal) and the Pelli–Robson chart measures contrast sensitivity at a fixed spatial frequency (vertical).
Fig. 1.17 The Pelli–Robson chart is a commonly used method of measuring contrast sensitivity at a set spatial frequency of 6 six cycles per degree. This corresponds both to the spatial frequencies most important in daily life and to the maximum contrast sensitivity of the eye. The chart is viewed at 1 metre under standardized illumination.
COLOUR VISION
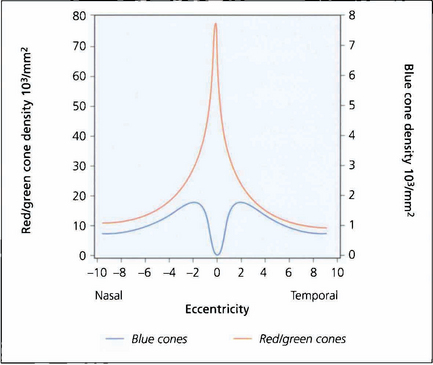
Fig. 1.18 Colour perception is maximal in the centre of the retina but extends out to 25–30° of the visual field. Beyond this, red–green perception disappears and then, in the periphery, all colour perception is absent. There are no blue cones in the fovea and they are less numerous than red–green cones elsewhere in the macula.
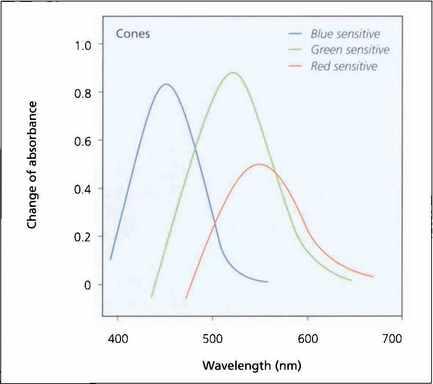
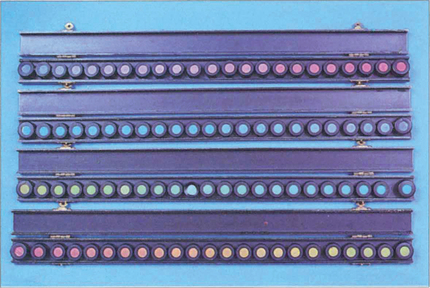
Fig. 1.19 Investigation of the spectral sensitivity curves of the human retina shows peaks at about 440 nm (blue), 540 nm (green) and 570 nm (red). This diagram illustrates the way in which the ranges of wavelength sensitivities of cones overlap; the curves have a gentle slope on the short wavelength side and a rapid fall on the side of long wavelength, that is, towards red.
Adapted from Pyman GA, Sanders L, Goldberg B. Principles and Practice of Ophthalmology. ©1979 Elsevier.
ABNORMAL COLOUR VISION
Abnormal colour vision can either be congenital or acquired; acquired causes include macular and optic nerve damage. Kollner’s rule states that optic nerve disease tends to affect the red–green axis whereas macular damage affects the blue–yellow axis. There are many exceptions to this rule, such as glaucoma and autosomal dominant optic atrophy, which affect the blue–yellow axis; and Stargardt’s disease, which primarily affects the red–green axis. Patients who have abnormal cone populations are not able to match some colours visible to a patient with normal anatomy but have a normal ability within other spectral areas. The most common type of colour deficiency is anomalous trichromacy in which the person has three cone populations but is deficient in one of them. Thus with protanomaly the person is deficient in red cones and needs excess red to match yellow; deuteranomaly requires more green. Dichromats have only two cone systems and thus cannot distinguish certain colours. Protanopes have absence of red cones, deuteranopes green cones. These anomalies are transmitted on the X chromosome and affect about 7 per cent of Caucasian males. Tritanomaly is very rare. These patients have difficulty in distinguishing turquoise blues and greens or yellows and pinks from one another. Achromatopsia is the complete absence of cones. These patients can distinguish colour only in terms of brightness; they have photophobia and poor vision. All patients with congenital colour defects have normal fundi.
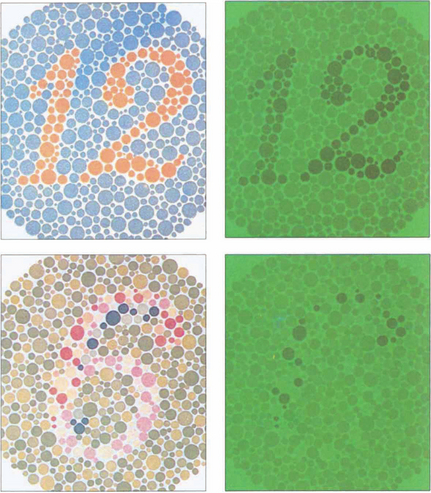
Fig. 1.20 Ishihara plates were originally designed for assessing congenital red–green confusion but are often used clinically to assess colour loss secondary to optic nerve damage. The test consists of plates with a matrix of dots arranged to make either a number or a line that can be traced out. The dots making up the numbers are visible to people with normal red–green colour vision, but are confused with adjacent colours by those who are red–green deficient. The coloured dots are designed to be isochromatic so that the dots making up the letters cannot be perceived by contrast difference alone. A test plate containing the number 12 composed of high-contrast dots is shown at the start to ensure that the subject has sufficient visual acuity to read the numbers. The test plate (a,b) and a trial plate (c,d) are illustrated, with and without a green filter. With the green filter, the test number almost disappears, but the trial plate number is still easily visible as the plate can be perceived by contrast rather than colour discrimination.