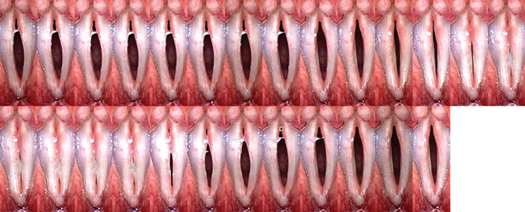
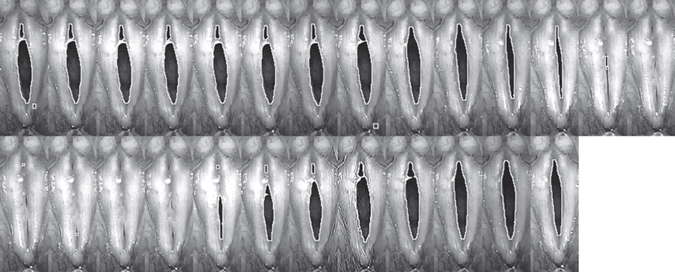
7 Objective Measures of Laryngeal Imaging and Laryngeal Electromyography The principle of using flashing lights for examination of rapidly moving but periodic oscillation using stroboscopy is well known for over a century. Today, videostroboscopy is one of the standard methods used to examine moving vocal folds. Laryngeal videostroboscopy is used extensively for the analysis of vocal folds and in the clinical practice for diagnosing voice disorders. Since the initial book on videostroboscopy by Schönharl,1 the technique and interpretation of laryngeal videostroboscopy have been well formalized. Stroboscopic signs are associated with benign mucosal lesions and can also be systematically rated and characterized.2 Laryngeal videostroboscopy is able to reveal several abnormalities, including abnormalities of laryngeal structure, absence of vibration, and vibratory asymmetry. The pliability of the vocal fold after surgical intervention can be assessed qualitatively by observation of vibratory characteristics using stroboscopy.3 Objective measurement of the vocal fold vibration pattern dates back to the initial high-speed cinematography recordings of vocal fold vibration from the works of Timcke, von Leden, and Moore.4–7 Although the concept of objective measurements of vocal fold vibration is attractive, the actual clinical application of objective measurements has not been realized. This is because of multiple factors related to the complex vocal fold vibratory image. With the availability of digital image processing, there are now possibilities for automated image extraction and quantification. High-speed imaging (HSI) of vocal fold vibration and clinical applications is now readily available within the time and cost constraints of a clinical practice.8,9 Today, digital kymography from high-speed video images can be routinely captured and analyzed and compared. Such rapid capture and analysis of the vibratory capability of vocal fold vibration was a dream only a decade ago. Such tools today represent the ability for easy quantification of the vocal fold vibration image for the study of normal function and physiology of normal and pathologic laryngeal states and for the objective measure of surgical and therapeutic techniques. The use of laryngeal electromyography (LEMG) has also become more popular for the investigation of mobile vocal fold and for central neurological disorders affecting voice. Much controversy continues to exist in the interpretation of the LEMG literature.10 Much of this is due to the qualitative nature of the LEMG and interpretation. Because interpretation of the LEMG requires many years of practice, the experience necessary for good EMG interpretation is not easily acquired by the average laryngologist. The possibility of quantitative methods to reduce interpreter bias has been introduced in other EMG literature.11 Quantitative and qualitative methods for LEMG interpretation and measurement have the potential of advancing electrodiagnosis of laryngeal movement disorders, improving prognostic indication for patients with vocal fold paralysis, and differentiation between myopathy and neuropathy. The goal of this chapter is to summarize the objective measures that one can measure from stroboscopy and high-speed video. We will introduce the concept of the glottal area waveform (GAW). From digital kymographic tracing, we will introduce the concept of kymographic waveform analysis. We will also summarize the concept of quantitative LEMG. Videostroboscopy is a well-established technique in clinical applications for the evaluation of dysphonic patients. In the voice clinic, it is most useful for the identification of small lesions and mass lesions and for the verification of stiffness.12 Laryngeal asymmetry during vocal fold oscillation is one of the most obvious abnormalities that one can identify during sustained phonation and points to asymmetric rheological changes in the vocal fold cover. Often, these asymmetrical changes are the indicators for recommendation for surgical intervention.13 After surgical intervention, videostroboscopy examination often shows improvement in the vocal fold edge, configuration, phase closure, and return of amplitude and mucosal wave.14 Objective measures of vibratory capability based on videostroboscopy examination are more challenging. The single-flash-timing laryngeal videostroboscopy is difficult to standardize from examination to examination. Control of the patient’s phonatory volume, frequency, and the size of the laryngeal image must be standardized if one were to compare the vibratory pattern before and after treatment.15 Some authors have recommended overlaying images from the prior examination over the current examination using a transparency tracing to standardize the distance of the endoscope from the vocal folds and to standardize the size of the laryngeal image.16 Such an approach is practically reserved for the research laboratory where specific information is to be obtained. Not all stroboscopy examinations can be useful for imaging analysis. This is because the stroboscopic image is a montage of many glottal cycles. By accepting the stroboscopy images as representative of the pattern of vocal fold oscillation, one is assuming that the multiple frames that are analyzed from the video captured is produced at the same fundamental frequency and the same loudness. Using the standard stroboscopic flash rate of 1.5 Hz above the fundamental frequency, a video frame rate of 30 frames per second will result in a complete glottal cycle in 20 video frames. If the patient can hold the steady phonation for 2 full seconds at this same fundamental frequency and loudness, then a montage of video frames can be acquired that is representative of the sustained phonation for that token. The stroboscopic images from the assembled three glottal cycles are a montage of the vibratory pattern for the vocal folds for those 2 seconds assembled from all the glottal cycles during the 2 seconds. For males, this would be approximately 250 glottal cycles, while for females, this would be approximately 500 glottal cycles. Provided the waveforms are quasiperiodic and repeatable from cycle to cycle on the visual inspection of the stroboscopy video, this sequence can be subject to analysis. Fig. 7.1 is a montage of glottal cycles obtained by capturing every frame of the video cycle and limiting the frame of interest to the vibratory margin. This is assembled as a single image made up of many video frames with the area of interest. The vibratory pattern is regular and the completion of a glottal cycle shows the characteristic pattern of open and closed phase with the phase difference between the upper and lower lips of the vocal fold. If one compares this with other glottal cycles from the same stroboscopy token and it looks similar, then one can assume that the stroboscopic montage is representative of the actual glottal cycle. If the glottal cycle is not evenly illuminated, frame dropout will occur. This will result in a glottal cycle that is not suitable for automated image extraction. An inherent limitation of videostroboscopy is that not all patients can have the entire vocal fold margin visualized during video endoscopy. This is because some patients will have tilting of the epiglottis that obscures the anterior commissure. Some patients will have arytenoid hooding that prevents the posterior vocal fold from being visualized. In patients with mass lesions of the vocal folds, the vibratory pattern may not be delineated due to mass effect or due to ventricular hyperfunction. For patients with severe dysphonia who cannot sustain phonation for more than 2 seconds at a steady fundamental frequency, it is best not to attempt objective analysis using videostroboscopy methodology. Although objective evaluation is difficult due to the montage nature of video recordings, some authors have tried to use the strobe image for quantification.17 The mucosal wave propagation across the superior surface of the vocal fold can be identified for tracking and some information regarding mucosal pliability can be estimated. In a comparison of 162 patients examined by videostroboscopy versus HSI, significant variation between subjective ratings was noted between both stroboscopy and HSI. This variation between subjective raters is one rational for need of objective imaging of vibratory movements.18 Developments in modern image processing techniques have led to the quantification of various aspects of vocal fold vibration. Stroboscopic images of the vocal fold were digitized and, subsequently, the glottal gap area, amplitude, and degree of bowing were analyzed quantitatively in relation to phonatory function. Measurement of the glottal gap probably represents the easiest and most reliable quantitative measure. Because it is assumed that the vocal fold at its most closed phase should have no glottal gap during sustained phonation in modal voice, estimate of the glottal gap before and after surgical intervention has been obtained.19 These studies do not require videostroboscopic analysis and are primarily based on digitized image of the vocal fold at its most closed phase. By measuring the glottal length and several pixels that are dark within the glottal gap, one can get a ratio of pixels to vocal fold length. This can then be compared with before and after surgical treatment. This normalized glottal gap estimate has been used in clinical studies to estimate the risk of aspiration in patients with vocal cord paralysis.20 Figure 7.1 The glottal cycle can be assembled as a montage of video frames by clipping the area of interest and assembled as a series of glottal images. Typically, a minimum of 10 video frames is used to represent one glottal cycle. The montage image is ready for automated analysis. One way to obtain an estimate of the vibratory function is the plot of GAW. The GAW is a measure of the glottal area function throughout the glottal cycle. The normal GAW has features that can be measured. These include the open and closed phase of vocal fold oscillation. The maximum glottal area and the minimum glottal area can also be measured. The rate of vocal fold opening and closing during all vocal fold oscillations can be calculated by measuring the slope of the GAW. The ability to rapidly change the configuration of the vocal fold or the opening and closing speed index is an indication of the vocal fold pliability and has been shown to change before and after phonosurgery.14 Quantification of the stroboscopic image comes from the initial manual measurements of the glottal cycle from high-speed cinematography.21 With some regularity, one can trace the edge of the vocal fold visually to obtain the elliptical shape of the vocal fold margin. By dividing the area measured by the length of the vocal folds, one can get a normalized measure of the glottal area of function. When the glottal area of function is assembled over the glottal cycle, the GAW can be plotted versus time. The GAW can then be compared between subjects and between variations in amplitude and frequency. In a study of normal subjects, the GAW showed significant differences between the sexes in GAW, peak glottal area, closed period, closing slope, and size and incidence of the posterior glottal gap. Intensity and frequency changes significantly affected GAW. Intensity variations affected the steepness of the closing phase and the duration of the closed period. Frequency changes affected the open period and the relative duration of opening versus closing.22 In the initial study of normal phonation, approximately 35% of the images were not suitable for objective quantification. To reduce the subjective bias in tracing out the GAW from videostroboscopy images, several digital image analysis routines may be applied to the videostroboscopy image. The videostroboscopy image in modal phonation is complicated by having an upper and a lower lip that alternates in contact. Tracing of the vocal fold edge always alternates between tracing the upper lip and the lower lip. This can cause some confusion for the technician who is asked to trace out the vocal fold margin in a purely manual manner. Such difficulties may result in subjective bias and uneven results. One approach to reduce subjective selection of the vocal fold margin is by routine use of digital image enhancement. Digital image analysis has become practical in biological sciences and has been used extensively. Some of the image analysis routines include contrast enhancement, edge detection, and image gradient analysis. Histogram equalization followed by maximum histogram gradient shift was found to be most effective in edge detection in a semiquantitative method for the detection of vocal fold vibratory pattern and reduces the subjective bias and identification of the GAW. Such an algorithm was used for the study referred to above.22 Since that time, a variety of clinically available software have become available for the analysis of the videostroboscopy image. One of the common software packages is the KSIP software available with the digital stroboscopy unit (Kay-Pentax, Montvale, New Jersey, United States). We will demonstrate the application of GAW extraction and analysis from a videostroboscopy image. To verify that the stroboscopic image is suitable for image analysis, it is best to review the stroboscopy videotape to verify that the frequency recorded is stable and that the amplitude is sustained throughout the phonation of at least 2 seconds at steady frequency and amplitude. Once this is verified, this sequence of video image frames is suitable for image capture and analysis. Typically, modal phonation at comfortable pitch and loudness is used for analysis. For males, the centering fundamental frequency is 110 to 120 Hz at 75 dB microphone output recorded at 6 inches from the mouth. For females, it is 200 to 250 Hz at 75 dB microphone output recorded at 6 inches from the mouth. The video frames are converted into Audio Video Interleave format for automated image extraction. Once the image is selected, the frame that represents the vocal fold in its most closed phase is used for defining the beginning of the glottal cycle sequence. The image cursor is used to define the area of interest for automated image extraction. By limiting the cursor to the area of vocal folds, the image analysis routine can be best utilized to analyze the changes in the GAW function. Typically, 10 frames of video image representing one glottal cycle are used for analysis. A minimum of two glottal cycles is used to verify the repeatability of glottal cycle measures. Fig. 7.1 is an example of a glottal cycle that has been captured and assembled in a photomontage for image analysis. Once the color image montage has been assembled, it is usually necessary to enhance the image before automated edge detection and area of detection. Fig. 7.2 shows the image after it has been changed to a black and white image and subject to image brightening and contrast enhancement. Once the image has been treated, the image edge detection algorithm is applied to automatically trace the glottal edge based on maximum histogram gradient shift. Fig. 7.3 shows the automated edge tracing that has been applied. During image analysis, the operator can visually check the area specified for image analysis and position the curser on the glottal area to be analyzed. This is shown in Fig. 7.4. The edge tracing of the glottal area is then assembled as a GAW with the frame number in the x-axis. In addition to the GAW path, right versus left vocal fold movement relative to the defined midline can also be plotted. This is shown in Fig. 7.5. Figure 7.2 The image has been brightened and contrast enhanced and changed to a black and white image. Now the glottal area is quite sharp and ready for automated edge detection and area extraction. From the GAW, one can obtain numeric values in peak glottal area, middle glottal area, opening and closing speed ratio, and the open and closed phase. For abnormal vocal fold function, the relative displacement abnormality in patients with reduced amplitude can be demonstrated. Differences in amplitude can be displayed graphically and phase differences can be measured in degrees of phase shift. Measurement of this type can give the investigator data on the degree of phase shift between the two vocal folds as well as their relative amplitude difference between the two vocal folds. This has clinical implications as to relative stiffness of the vocal folds. Despite the clinical availability of objective image analysis for clinical application, only limited literature support its routine use. One of the difficulties in using edge analysis alone is the lack of in-depth information about the vocal folds. Three-dimensional videostroboscopy can be obtained but its quantification would be difficult. Development of new automated image analysis routine is ongoing. Analysis of vertical contact should be taken into account when surgical intervention to improve hoarseness resulting from unilateral vocal fold immobility is performed. The future of standardized analysis of videostroboscopy and laryngeal image analysis are prerequisites to achieve objective measures of phonatory function before and after surgery.23 Stroboscopy will continue to be an easy clinical tool useful for the evaluation of the patient with dysphonia. As long as the clinician can recognize the deficiencies of stroboscopy, the use of a brief flashing light to freeze motion will see continued application in the clinic. With the new generation of high-definition videos and stroboscopy combined with special image filters such as narrowband imaging and florescence imaging, the role of imaging of the vocal fold is continuing to expand in the clinical diagnosis arena. As researchers come to some agreement as to which of the parameters from the stroboscopy image are most relevant in the evaluation of the vocal vibratory function, there is now a robust set of tools that could be applied. What will be needed for routine image measurements to be applicable to the clinician will be a set of automated software tools that can access the stroboscopy video, do preliminary analysis of the quality, and extract key parameters without extensive user input. Figure 7.3 The glottal area has been traced out using the automated edge detection algorithm and the glottal area has been outlined for extraction. Note that the tracing is imperfect as mucous on the edge has been erroneously excluded from the vocal fold edge and will not be included in the area. These areas may need operator intervention to correct the deficiencies.
Measurements from Stroboscopy Video
Stay updated, free articles. Join our Telegram channel

Full access? Get Clinical Tree


