Purpose
To assess the crystalline lens opacity level by measuring ocular light scattering with a double-pass system.
Design
Prospective, single-center, cross-sectional study.
Methods
Two hundred fifty-three eyes of 135 patients referred for cataract evaluation were enrolled. Patients with corneal or retinal anomalies potentially impairing ocular transparency were excluded. Lens opacification was assessed by the Lens opacities classification system III. Optical Quality Analysis System (Visiometrics SL) measurements provided ocular Modulation Transfer Function cutoff frequency and Objective Scatter Index. Best-corrected visual acuity and Quality of Vision questionnaire scores (Rasch-scaled) were recorded. We analyzed correlations between visual acuity, type and severity of cataract, Optical Quality Analysis System measurements, and discomfort level in each group.
Results
In patients with best-corrected visual acuity better than 20/32, we found correlations between Objective Scatter Index, Modulation Transfer Function, and visual acuity ( r = 0.4, P < .0001). The Objective Scatter Index, Modulation Transfer Function, and visual acuity were correlated with each type of cataract. In patients with good visual acuity and moderate functional symptoms, the Objective Scatter Index values also were correlated to the severity of posterior subcapsular cataract ( r = 0.4, P = .0006).
Conclusions
Patients with incipient cataract may report visual discomfort, despite minor lens opacity on slit-lamp examination, minor loss of best-corrected visual acuity, or both. The measurement of ocular scattering with the Optical Quality Analysis System device may be a useful tool in the preoperative evaluation of patients with early cataract.
To satisfy the increasing quest for better postoperative results and to reduce postoperative spectacle dependency, there have been significant developments in phacoemulsification, intraocular lens (IOL) designs, and IOL power formulae over the past decade. Hence, cataract surgery is performed at earlier and earlier stages in the disease progression in eyes with clearer crystalline lenses and relatively preserved visual acuity.
The Optical Quality Analysis System (Visiometrics SL, Terrassa, Spain) is the only currently clinically available device that quantifies the combined effect of optical aberrations and light scatter resulting from the loss of ocular transparency in the human eye. This double-pass system performs these measurements by recording the retinal image of a point source of light obtained after focalization of an infrared signal. The retinal image corresponds to the double-pass point spread function, which enables the determination of the modulation transfer function and the maximum theoretical visual acuity. The determination of the Modulation Transfer Function by a double-pass method has been used previously to investigate retinal images as a function of age, contact lens use, or implantation of IOLs.
In this study, we evaluated, in a population of patients with cataract of varying levels of severity, the correlation between the clinical cataract classification via slit-lamp examination (Lens Opacities Classification System III), the subjective quality of vision assessed by a questionnaire (Quality of Vision questionnaire), the best-corrected visual acuity (BCVA), and the objective loss of ocular transparency as measured by the Optical Quality Analysis System device.
Methods
Study Population
The data for this prospective single-center cross-sectional study were collected between January 2010 and December 2011 at the Rothschild Foundation, Paris, France. The study and data accumulation were carried out with approval from the Rothschild Foundation Institutional Review Board. Informed consent was obtained from each participant after receiving an explanation of the nature and intent of the study. Eligible subjects were approached prospectively during cataract evaluation visits; those giving consent were enrolled consecutively.
Inclusion criteria were a diagnosis of cataract (early to mature) and the ability to speak, read, and comprehend French fluently. Patients having anomalies impairing ocular transparency, such as corneal dystrophies, corneal scars, retinal anomalies (age-related macular degeneration, retinal detachment, macular dystrophies, and so forth), were excluded. All patients with ocular, medical, or surgical history other than lens opacities, cataract suspicion, or both also were excluded.
All patients underwent a complete ocular examination including BCVA, a detailed slit-lamp biomicroscopy examination to eliminate causes of ocular transparency loss other than cataract, and a dilated fundus examination. The type and the grade of cataract were assessed by the same experienced ophthalmologist (D.G.) according to the Lens Opacities Classification System III grading system. All cataracts were classified and graded in 4 groups: nuclear opacity, nuclear color, cortical opacity, and posterior subcapsular opacity. The severity of each item was graded from 1 (early cataract) to 6 (mature cataract) for the nuclear color and opacity and from 1 to 5 for the cortical and posterior subcapsular opacities.
During the preoperative evaluation, patients completed the Quality of Vision questionnaire (self-administered). This questionnaire was developed by McAlinden and associates and consists of 10 items (questions) describing 10 visual symptoms. For the first 7 symptoms, an accompanying image of the specific visual symptom is displayed to aid patient understanding. Four response categories are used for each item to provide the opportunity to discriminate levels of symptoms with a low possibility of redundancy. The raw questionnaire responses were Rasch scaled to provide 3 scores of frequency, severity, and bothersome of visual symptoms. Higher scores relate to poorer quality of vision.
A different ophthalmologist (F.C.) from the one who determined the grade of cataract during the slit-lamp examination performed the Optical Quality Analysis System measurements and collected the Objective Scatter Index and Modulation Transfer Function values for each eye. To analyze the correlations between the variables, eyes were divided into different groups that were based on visual acuity, cataract type, and visual symptoms. Eyes were separated into 2 visual acuity groups (in the first group, the visual acuity was worse than 20/40 and in the second group, the visual acuity was 20/32 or better). Three cataract groups also were constituted (the nuclear cataract group, the cortical cataract group, and the posterior subcapsular cataract group). Eyes also were separated in 3 groups depending on the Quality of Vision questionnaire score: in the first group, the level of visual symptoms was low: the frequency, severity, and bothersome quality of visual symptoms were lower than 30; in the second group, visual symptoms were moderate (scores of more than 30 but less than 60); and in the third group, visual symptoms were high, with scores of more than 60.
Double-Pass System
In this study, we used the clinical double-pass Optical Quality Analysis System instrument, which measures the combined effect of higher-order aberrations and scattered light, thus providing complete information of the optical quality of the patient’s eye. A point source image is formed on the patient’s retina using a 780-nm laser diode. We acquired double-pass images of every eye at best focus, corrected internally by an optometer that ranges from −8 to 6 diopters (D). The astigmatism also was corrected by using the appropriate cylindrical lens placed in front of the eye. Then, the light beam was focused on the retina. The reflected light passed through the diameter of the exit pupil, which was settled at 4 mm. A charge-coupled device camera recorded the double-pass images after the light was reflected on the retina and beam splitter. Pupil alignment was controlled with an additional camera. A personal computer was used to process the retinal images and to collect the data.
The double-pass instrument provides several measurements, including the Objective Scatter Index, the Modulation Transfer Function, and the maximum visual acuity predicted for objects with 100%, 50%, and 9% contrast. The Point Spread Function recorded by the double-pass system represents the image projected onto the retina from a point light source. The Point Spread Function was calculated as the mean of 6 individual acquisitions. In the absence of optical aberrations or light scattering, the Point Spread Function is quasipoint and the image perceived is unaltered (if the diffraction eventually caused by a large pupil diameter is moderate). The Modulation Transfer Function curve, directly computed from the Point Spread Function, represents the attenuation percentage of the contrast of the retinal image at various resolutions (spatial frequencies), including the combined effects of scatter and high-degree optical aberrations. The Modulation Transfer Function value is highest when the contrast in the image is the same as the contrast in the object. The value considered in this study was the cutoff point of the Modulation Transfer Function curve on the x-axis. The cutoff point represents the point at which the spatial frequency is at a maximum. The results are given in cycles per degree. For a perfect optical system without any optical aberrations, the Modulation Transfer Function curve is a straight line. The Objective Scatter Index is an objective evaluation of the scattering degree caused by the loss of transparency of one or more of the ocular structures, such as corneal opacities or cataract. This index is defined as the ratio between the integrated light in the periphery and in the surroundings of the central peak of the double-pass image. The higher the Objective Scatter Index value, the higher the level of intraocular scattering. The Objective Scatter Index values range from 0 (no scatter) to a maximum of 25 (highly scattered system). The Objective Scatter Index parameter can be affected by uncorrected refractive errors (defocus and astigmatism). Hence, all patients had a refractive examination and all measurements were performed with best-corrected sphere and cylinder to avoid these artifacts.
Statistical Analysis
Statistical analysis was performed using Stata version 10.0 for Macintosh (Apple, Cupertino, California, USA). Statistical significance was set at P < .05. The Quality of Vision questionnaire raw data were Rasch-scaled to provide a linear measure of quality of vision for the 3 subscales of the questionnaire. The relationship between variables was analyzed using the Spearman rank nonparametric correlation coefficient.
Results
Baseline Characteristics of Visual Acuity, Cataract, and Visual Symptoms Groups
One hundred thirty-five patients were recruited and 253 eyes were included in the study. The mean age of the patients was 68.1 ± 11.1 years (range, 33 to 90 years). The mean BCVA was 0.2 ± 0.2 logarithm of the minimal angle of resolution units (range, 0 to 1.3 logarithm of the minimal angle of resolution units). The mean preoperative spherical equivalent was 0.9 ± 3.3 D (range, −10 to 6 D). The mean Objective Scatter Index value was 4.1 ± 3.5 (range 0.1 to 15.7). The mean Modulation Transfer Function cutoff value was 16.5 ± 11.5 cpd (range, 1.5 to 54.8 cpd). The descriptive statistics of all the subgroups are summarized in the Table .
Correlations Between Crystalline Lens Opacity Level Assessed by A Double-Pass System and Subjective Measurements
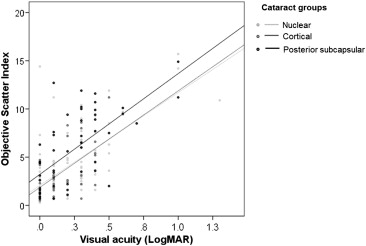
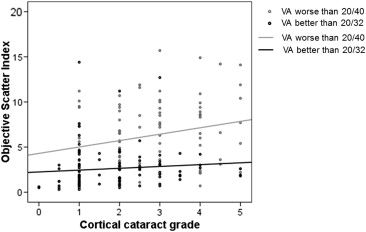
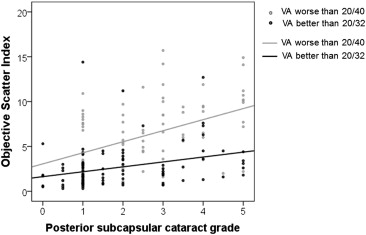
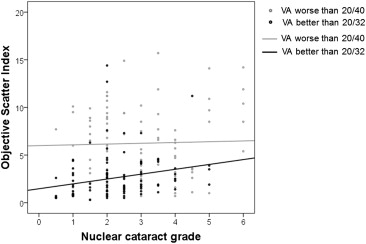
In the group with a visual acuity of 20/32 or better (n = 132), we found a correlation between the Objective Scatter Index value and the visual acuity ( r = 0.4, P < .0001) and between the Modulation Transfer Function value and the visual acuity ( r = −0.4, P = .0001). The Objective Scatter Index, Modulation Transfer Function, and visual acuity were correlated with the grade of cataract in every type of cataract considered ( Figures 1, 2 , and 3 ). The Modulation Transfer Function cutoff value, but not the Objective Scatter Index value, was correlated to the frequency, severity, and bothersome quality of visual symptoms ( r = 0.4 and P = .007, r = 0.4 and P = .007, and r = 0.4 and P = .007, respectively).
In the group with a visual acuity worse than 20/40 (n = 121), we found correlations between Objective Scatter Index values and visual acuity ( r = 0.5, P = .0001), frequency ( r = −0.4, P = .03), severity ( r = −0.4, P = .03), and bothersome quality ( r = −0.4, P = .03) of visual symptoms. The visual acuity and Objective Scatter Index were correlated with the severity of subcapsular posterior cataract ( r = 0.5 and P = .04, and r = 0.5 and P = .0001), but not with the severity of cataract in the other cataract groups.
In the nuclear cataract group (n = 106), we found correlations between objective Scatter Index and visual acuity ( r = 0.7; P < .0001) and between Modulation Transfer Function and visual acuity ( r = −0.5; P < .0001). The severity of nuclear cataract was correlated with Objective Scatter Index, Modulation Transfer Function cutoff value, and visual acuity ( r = 0.5, r = −0.5, and r = 0.6, respectively; P < .0001). No correlations were found between visual symptoms and Optical Quality Analysis System measurements.
In the cortical cataract group (n = 40), the visual acuity was correlated with the Objective Scatter Index ( r = 0.5, P = .001), Modulation Transfer Function ( r = −0.6, P = .0003), the grade of cortical cataract ( r = 0.6, P = .0001), and the frequency, severity, and bothersome quality of the visual symptoms ( r = 0.4 for each item and P = .007, P = .009, and P = .009, respectively). No correlations were found between the Optical Quality Analysis System measurements and the visual symptoms.
In the posterior subcapsular cataract group (n = 53), Objective Scatter Index was correlated with visual acuity ( r = 0.6, P < .0001) and the severity of posterior subcapsular cataract ( r = 0.3, P = .01). The Modulation Transfer Function was correlated with visual acuity ( r = −0.5, P = .0001). No correlations were found with visual symptoms.
The correlations between Objective Scatter Index and visual acuity in each cataract group are displayed graphically in Figure 4 . In the groups with low and moderate levels of visual symptoms, the Objective Scatter Index values were correlated with visual acuity ( r = 0.5, P = .0006) and with the severity of posterior subcapsular cataract ( r = 0.6, P = .0001). Visual acuity was correlated with the severity of nuclear cataract ( r = 0.4, P = .02) and cortical cataract ( r = 0.4, P = .03). In the group with high level of visual symptoms, no correlations were found.