Chapter 4 Normal and abnormal visual development
Introduction
Development of visual function accompanies development of the eye and brain. The eye grows and the retinal ganglion cell axons find their way out of the eye and, via the optic nerve and neural visual pathways, reach visual cortex targets. As the eye grows, optical properties of the eye change and, normally, emmetropization occurs.1 Retinal cells move to pave the expanding peripheral retina and to create a fovea that matures to mediate exquisite visual resolution.2–4 Myelination of the optic nerve fibers continues until approximately age 2 years.5 Also, after birth, brain myelination continues, brain volume increases, and brain organization matures.6,7 Concurrently, as the infant develops, visual capabilities increase and become more adult-like.
Rigorous, non-invasive psychophysical and electrophysiological tests, originally used to study normal visual development in infants, have been modified for clinical application. For measurement of vision, stimuli must be specified in precise physical terms. There must be a reliable relationship of the stimulus to the child’s response. Comparison to normal values for age is crucial for valid interpretation of vision test results. Measurement provides critical information that complements clinical history and observation. Interpretation of the numeric results of an individual patient’s vision test includes comparison to normal values for age, such as the mean and prediction interval for normal.8 Data obtained in serial measurements can be compared to the patient’s own prior results to chart the patient’s course.
We limit our discussion to those visual functions that are regularly measured clinically, such as visual acuity and visual fields, and those that have been used to investigate strabismus and amblyopia and retinal dystrophies of early onset. The visual functions that are informative in these conditions, in addition to visual acuity and visual fields, are contrast sensitivity, vernier acuity, stereoacuity, and dark adapted visual threshold. For each visual function, we present quantitative information about normal development and comment on the structural and neurophysiological bases for these sensory functions. Some visual functions are mediated by the central retina (grating and letter acuity; contrast sensitivity; vernier acuity; stereoacuity) and others by the peripheral retina (dark adapted, rod mediated visual threshold; visual field). The most commonly measured visual function, visual acuity, evaluates the function of the entire visual pathway. Some visual functions are tested mainly to evaluate the function of the retina (dark adapted visual threshold). Vernier acuity and stereoacuity are non-invasive assessments of processes in the brain. Human retinal and visual development is covered in a more comprehensive fashion elsewhere.9–11
Visual acuity
Visual acuity is defined as the finest detail (minimum angle of resolution, MAR) that is detectable.12–14 Letters of overall size 5 minutes of arc and stroke width 1 minute of arc are designated according to different conventions as 20/20 or 6/6 Snellen, 1.0 decimal, or 0.0 logMAR. 20/200 symbols are 10 times larger. Letter acuity of 20/200 is one of the main criteria for legal blindness in many countries and thus a determinant of eligibility for vision support services where they exist.
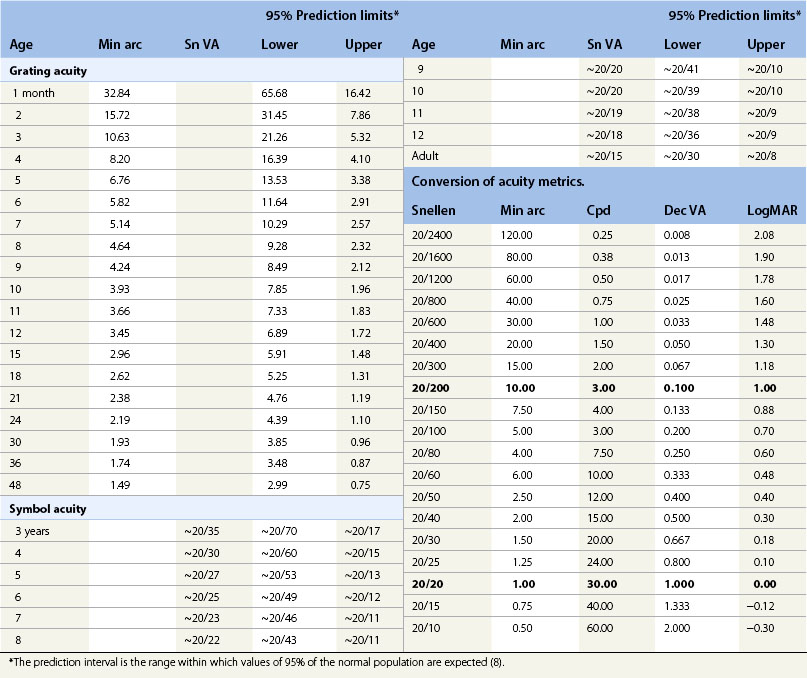
In infants and young children who do not read letters or follow instructions for matching, acuity is tested using procedures that keep the child’s response under stimulus control during preferential looking (PL), psychophysical (Fig. 4.1) or visual evoked potential (VEP) electrophysiological procedures. The stimuli are repetitive patterns, usually gratings (stripes) specified in minutes of arc (min arc) or cycles per degree (cpd). The development of normal acuity is summarized in Figure 4.2 and Table 4.1. Acuity increases systematically with age (see Fig. 4.2) despite the use of different stimuli (gratings, symbols) and procedures (preferential looking, matching, recognition). At age 2.5 to 3 years developmentally normal children can be tested using symbols and a matching task. Before that age, acuity measurements are accomplished using PL or VEP procedures. For convenience, mean values of normal acuity along with the prediction interval for normal (8) at selected ages are listed in Table 4.1.
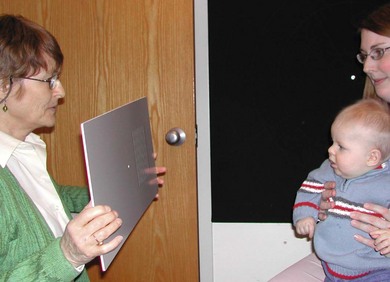
Fig. 4.1 Preferential looking test of acuity using the Teller Acuity Cards (TAC). The 10-month-old is seated on his mother’s lap. The examiner shows a series of cards with black and white stripes (gratings) on the left (or the right), starting with wide stripes. The examiner, who is unaware of the right-left position of the stripes, must judge the stripe location based on the infant’s head and eye movement response.19 Acuity is taken as the narrowest stripes to which the infant responds.
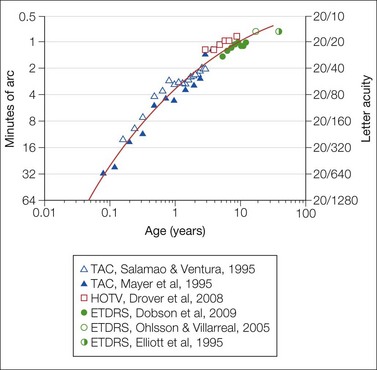
Fig. 4.2 Development of acuity in normal subjects. The mean monocular acuity is shown as a function of age. Grating acuity (triangles) from age 1 month to 4 years was obtained using the Teller Acuity Card (TAC) preferential looking procedure.19,20 HOTV letters (squares) were used to measure acuity from age 3 to 9 years.124 ETDRS letters (circles) were used for children from 5 to 12 years,125 17- and 18-year-olds,126 and adults.127 The smooth curve drawn by eye describes average acuity as a function of age.
During infancy, acuity measured using VEP15–18 is higher than that obtained using PL.19,20 In a healthy infant at age 6 months, average PL acuity is 6 min arc and average VEP acuity is approximately 2 min arc.21,22 The elements of a 20/120 letter subtend 6 min arc, and those of a 20/40 letter subtend 2 min arc. VEP acuity is constrained by processes in the eye, the pathway from the eye to the visual cortex, and the visual cortex.17 The same processes also constrain PL acuity, but, additionally, PL acuity requires processing in higher neural areas, attention,23 and eye–head movement. Differences in stimuli, analysis techniques, and response measures also contribute to the VEP–PL difference.
During development, acuity is limited in part by immaturities of the fovea. The fetal fovea becomes identifiable as a ~1665 µm diameter rod free retinal region at about 22 weeks’ gestation.4 By term, the diameter of this immature central retinal region containing exclusively cones has decreased to ~1100 µm; the diameter continues to decrease and reaches the adult diameter (~700 µm) by 15 months.4 The fovea continues to mature until approximately age 3 years.2,24,25 The cones first develop inner segments, which are wider than those in adults, and then outer segments. As the diameter of the rod free zone diminishes, the cone center-to-center spacing decreases, and the inner segments become more slender as the foveal pit develops.2,26 These features of the foveal cones partially account for low acuity in young infants; there are also post-receptor immaturities which have been documented using the multifocal electroretinogram.27 Furthermore, immaturities of visual processes in the brain are recognized.7,28–30
Assessments of acuity contribute to diagnosis and to assessment of severity and course of disease (Fig. 4.3). PL acuity tests have been used widely for assessment of infant and childhood ophthalmic disorders.31–35 PL and VEP tests also can measure acuity in patients with cognitive impairment; PL tests have been more widely used. On average, about an octave deficit (a halving of spatial frequency) in acuity was found in patients with cognitive impairment even if the eyes were normal.36,37
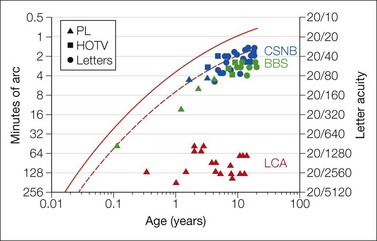
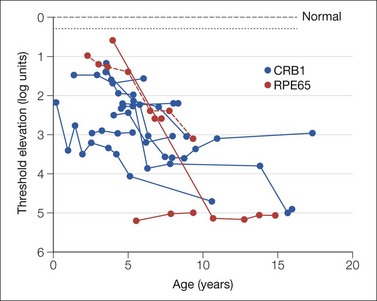
Fig. 4.3 Acuity in patients. Data are from a patient with Bardet-Biedl syndrome (BBS, BBS7; green symbols), X-linked congenital stationary night blindness (CSNB, blue symbols), and Leber’s congenital amaurosis (LCA, CRB1; red symbols). The solid red line, re-plotted from Fig. 4.2, describes average acuity as a function of age and the dashed line the lower 95% prediction limit of normal;8 see also Table 4.1. Age appropriate tests were used for the patient with BBS and CSNB. In the patients with BBS, acuity remains near the lower limits of normal for age and shows a developmental increase; over the same interval, his dark adapted visual threshold worsened. In the patient with CSNB, visual acuity remained stable as did his dark adapted visual threshold. Acuity in the patient with LCA, who had marked macular atrophy, was measured using the gratings of the preferential looking test. This patient’s dark adapted visual threshold worsened significantly during childhood (youngest patient in Fig. 4.6). An octave variability in repeated measures of acuity may be expected in children.
In diverse ophthalmic disorders the deficit in letter acuity often exceeds that in grating acuity. This was demonstrated in mature subjects with amblyopia who could perform both letter and grating acuity tests. Letter acuity for the amblyopic eye was on average 1.5 times worse than grating acuity.38 Compared to the simple repetitive pattern of gratings, letters have complex spatial content. For those patients for whom, due to age or ability, grating acuity by PL or VEP provides the feasible test, interpretation of the grating acuity rests on a foundation of knowledge about the relationship of grating and letter acuity in patients. If grating acuities are reported to educators and agencies without explanation, children may be unnecessarily declared ineligible for services.39,40
Contrast sensitivity
In the real world, objects of widely varying contrast are encountered. Visual acuity is typically tested using high contrast stimuli and, therefore, fails to capture important information about vision. For detection at lower contrast, stimulus elements must be larger than at high contrast (Fig. 4.4). PL41–44 and VEP45–47 procedures have been modified to study development of normal contrast sensitivity and clinical conditions. Contrast sensitivity is tested in older children using commercially available charts with gratings or letters.48,49
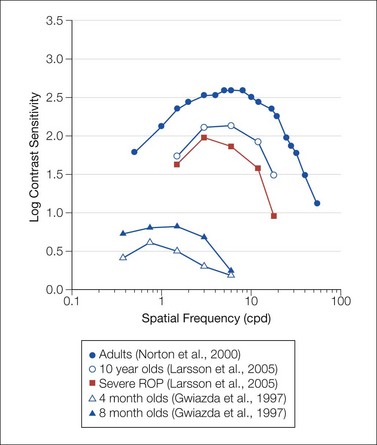
Fig. 4.4 Contrast sensitivity functions. Date are for healthy adult,128 child,129 and infant subjects44 and for pediatric patients with a history of treated retinopathy of prematurity.129 Data are re-plotted from the cited references. All data were obtained using psychophysical procedures.
Vernier acuity and stereoacuity
Vernier acuity
Vernier acuity is the ability to detect discontinuity in a line.13,14,50 This is critical to pattern perception. In healthy adults, vernier acuity is approximately an order of magnitude better than letter acuity.51 Development of normal vernier acuity has been studied using PL52–56 and VEP57 procedures. Vernier acuity and grating acuity develop at different rates (Fig. 4.5); vernier acuity surpasses grating acuity during infancy52,54 and childhood.55,56 Adult levels are reached later for vernier than for grating acuity.55,57
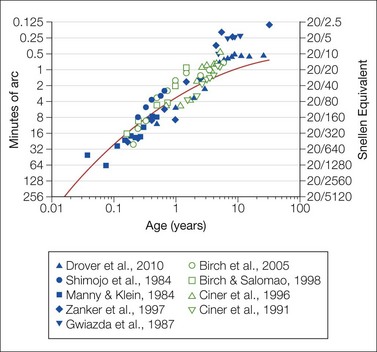
Fig. 4.5 Vernier acuity (filled symbols) and stereoacuity (open symbols) as a function of age in healthy subjects. Data are re-plotted from the cited studies.52–56,65,67,68,130 The smooth red curve, which shows average acuity as a function of age, is re-plotted from Fig. 4.2.
Vernier acuity is relatively tolerant to defocus, motion, and, in some conditions, luminance.58–60 Tests of vernier acuity are, therefore, potentially robust for clinical application. The advantages, however, are offset by susceptibility of vernier acuity to practice effects and attention.61,62 Although vernier is better than letter acuity in healthy adults (see Fig. 4.5), in amblyopia, deficits in vernier and letter acuity are similar.38 In children with cerebral visual impairment, deficits in vernier acuity are greater than deficits in grating acuity.63 The wider use of vernier acuity tests to detect and monitor pediatric ophthalmic disorders warrants consideration.
Stereoacuity
Development of normal stereoacuity has been well studied.64–68 Infants may demonstrate stereopsis as early as 2 to 3 months, but most show onset at 3 to 5 months of age. The course of stereoacuity development is more rapid than that of grating acuity (see Fig. 4.5). Thresholds are 3 to 5 min arc by age 6 months; in adults, stereoacuity is 1 min arc or better. The onset of infantile esotropia occurs when stereoacuity is normally undergoing rapid development.69 Stereoacuity tests may detect strabismus and amblyopia,67,70 and stereoacuity is used to assess outcomes of treatment for esotropia.71,72
Dark adapted visual threshold
The ability to detect dim spots of light in the dark develops in early infancy. The test spot must be brighter for detection by a young infant than by an adult. At age 4 weeks, threshold is on average 1.4 log unit above that in adults.10,73,74 By age 6 months, the threshold has become equivalent to that in adults.10
Threshold is measured following a period of dark adaptation using a modified PL procedure. The stimuli must be carefully specified and controlled.10 Stimuli are chosen to favor detection by the rod system. Spectral sensitivity functions confirm that dark adapted thresholds are rod mediated in infants as young as age 4 weeks.73,75,76 The threshold is constrained by catch of photons by rods. By term, the infant’s retina has an adult complement of rods. The infant’s rod outer segments are shorter and contain less rhodopsin than adults.77 Therefore, more light must fall on the infant’s retina to produce the same response as in an adult.10,73,77–79 Normally, there is a delay in developmental elongation of the 10° eccentric rod outer segments compared to those in more peripheral (30°) retina; this is accompanied by a delay in development of the 10° eccentric dark adapted threshold. Studies of rod mediated spatial summation show that infants’ receptive fields are larger than in the mature retina;80,81 immaturities of infantile temporal summation are attributed to the rod photoreceptor.82
The dark adapted visual threshold mediated by rod photoreceptors in the peripheral retina has been studied in children with retinal disease;83–86 it can be used to follow retinal disease even when the electroretinogram is markedly attenuated.86,87 Figure 4.6 shows representative results from patients with Leber’s congenital amaurosis (LCA). A 1 log unit worsening of threshold indicates significant progression of disease.86 Near peripheral (10°) threshold development in infants with a history of retinopathy of prematurity (ROP) is delayed relative to that in term-born infants.83 The ROP subjects with near peripheral threshold elevation have altered function of the rods in that retinal region.88 Deficits in peripheral rod thresholds are associated with deficits in post-receptor retinal sensitivity.89