Chapter 8 Visual electrophysiology
how it can help you and your patient
Introduction
There are international guidelines and standards for performing visual electrophysiologic tests (e.g. ISCEV, the International Society for Clinical Electrophysiology of Vision, available at http://www.iscev.org, or International Federation of Clinical Neurophysiology at http://www.ifcn.info). We apply, and extend, ISCEV adult protocols in able children, i.e. children who can sit still and follow instructions for 30 minutes or more. With younger, or less compliant, children we use adapted protocols that are robust enough to provide comparable information without restraint, sedation, or anesthesia.
The tests
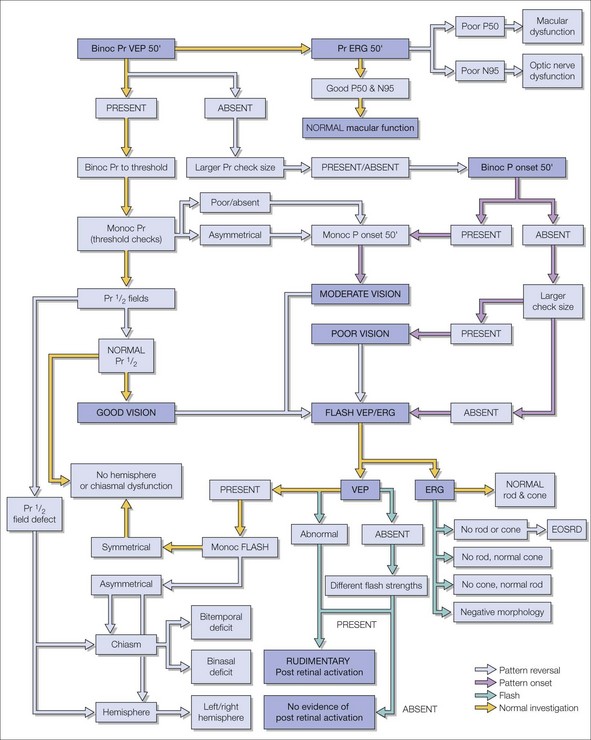
To illustrate this we have applied our GOSH (Great Ormond Street Hospital) protocol to two common questions arising at different ages. The flow chart outlines the diagnostic algorithm and hierarchy of testing (Fig. 8.1). We have added short notes on the technical aspects of the methodology at the end of the chapter. Artefacts can mimic physiologic responses and must be excluded before findings from complementary tests may be interpreted as consistent (see Fig. 8.1).
1. Babies: unstable eye movements, is this congenital motor nystagmus? Looking for an anterior visual pathway problem:
2. Teenagers: questioning whether there is a functional element to measured subnormal vision:
What do the responses tell us? An aide memoire for a busy clinician
The electro-oculogram
The EOG is used to investigate if a maculopathy is due to retinal pigment epitheliopathy. The standing potential of the eye due to voltage across apical and basal surfaces of the RPE is around 6 millivolts, with maximal positivity detected at the corneal apex. Electrodes placed on the medial and lateral canthi measure a large potential change during a saccade: the electrode closest to the cornea becomes positive relative to the electrode furthest from the cornea. This is the EOG and it is displayed as a voltage/time plot. Eye movements, including nystagmus, can be characterized graphically. The EOG potential increases in light and decreases in the dark.1 With reproducible eye movements, e.g. saccades of known size, this variation can be measured and expressed as the Arden ratio (light rise/dark trough) and values below 1.6–1.8 are abnormal. The voltage change with light is a consequence of the phagocytosis of outer segment discs and transport of retinal binding proteins at the apical end of the RPE. If the photoreceptors are sick, both the ERG and the EOG are affected. The EOG is diagnostically potent when the Arden ratio is abnormal and the rod ERG is normal as this discriminates a primary retinal condition from an epitheliopathy, e.g. bestrophin mutations (see Chapter 45).2
The electroretinogram
The ERG is used to distinguish cone and rod dysfunction and photoreceptor from inner retinal dysfunction. The ERG is measured in microvolts and its size and shape depend upon the relative proportion and extent of rods and cones that are excited and the size of the retinal area stimulated.3 Rods and cones can be preferentially stimulated by flashes of different colors, strength, and duration presented under different states of dark and light adaptation. The gradual evolution of the ERG waveform with increasing flash strength is shown in Fig. 8.2A scotopically and Fig. 8.2B photopically.
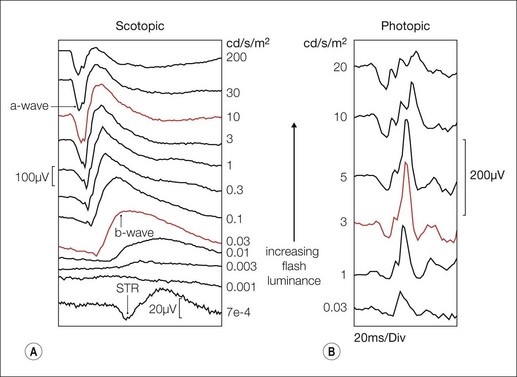
To very dim lights, a small scotopic threshold response (STR) has been described but clinically this is difficult to achieve and is used rarely. As flash strength increases a late (60 ms), round, positive b-wave emerges. This is the rod driven b-wave, which reflects inner retinal activity associated mainly with depolarizing on-bipolar cells. The change of b-wave amplitude with flash strength can be described by a Naka-Rushton function, derived from the Michaelis-Menton equation, but the derived parameters will vary according to the method of curve fitting. In clinical circumstances these need to be interpreted with care.4
As the flash strength further increases an early negative a-wave precedes the b-wave. The a-wave becomes larger and faster with increasing flash strength reflecting photoreceptor hyperpolarization. To the brightest flashes the leading edge of the scotopic a-wave models rod phototransduction.5
1. Oscillatory potentials – a series of wavelets between the a- and b-waves, vulnerable to disturbances of retinal circulation.6
2. The photopic negative response – reflecting proximal retinal activity, vulnerable in glaucoma and in potassium channelopathies.7
3. The c-wave – related to the EOG, due to a depletion of potassium ions in the space between RPE.
4. The d-wave – an off pathway response. Rods use the on pathway through the inner retina; cones use both on and off pathways. The d-wave is associated with decreases in light under photopic conditions, and is best seen in response to prolonged on–off flashes (on > 90 ms). This is an important extra stimulus for investigating “negative,” no b-wave ERGs, e.g. subtyping CSNB (see Chapter 44).8 Usually b- and d-waves are superimposed in the ERGs to short duration (< 10 ms) flashes.
Stay updated, free articles. Join our Telegram channel

Full access? Get Clinical Tree


