Chapter 49 Advances in neuroimaging have revolutionized the field of neuro-ophthalmology over the past three decades. Available techniques provide the clinical anatomic correlation that facilitates determining the specific differential diagnosis. In directing this diagnostic evaluation, it behooves the ophthalmologist to be aware of the modalities available, their strengths and limitations, and their suitability for the clinical situation at hand. This chapter first describes the neuro-imaging techniques available, and then demonstrates their application to the major neuro-ophthalmologic disorders discussed in this book. Ultrasonography, duplex carotid imaging, computed tomography, magnetic resonance imaging, magnetic resonance and computed tomographic angiography, and conventional angiography are the neuro-imaging modalities to be discussed. Each modality is described separately, but in the ensuing discussion of neuroophthalmologic disorders it will become apparent that in many instances the modalities are complementary, providing different types of valuable information. Reflection of ultrasound waves (8–20 MHz) at acoustic interfaces is the basis of ultrasound imaging. Ultrasonography provides real-time display of tissues studied. It is of optimal value in examination of the globe, particularly the posterior segment if opaque media are present. One neuro-ophthalmologic application of ultrasonography is differentiation of papilledema from pseudopapilledema (pseudoedema) due to optic disc drusen, which produce a strong acoustic interface when calcified (Fig. 49–1). Although ultrasonography has also proven valuable in examination of the anterior orbit, attenuation and refraction of ultrasound waves yield relatively poor visualization of the orbital apex. Ultrasonography does not require ionizing radiation or intravenous contrast agents, and it is available in an office setting. It is a quick and relatively inexpensive procedure but requires expertise and experience to both perform and interpret the study correctly. Doppler ultrasound techniques may elucidate the cause and guide the treatment of many ocular and cerebrovascular syndromes. Carotid, vertebral, transcranial, and orbital Doppler imaging have been used to investigate vessel patency, blood flow, and pulsation. The Doppler principle is based on the shift in frequency that occurs when ultrasound waves are reflected off flowing blood cells. This frequency change can be expressed as a flow velocity. With duplex scanning Doppler flow information is combined with conventional B-mode ultrasonography to both image the vessel anatomically and evaluate blood flow characteristics. The major neuro-ophthalmologic application of duplex imaging is examination of the carotid bifurcation in patients with amaurosis fugax. With continued refinements in technique, the examination is an accurate and valuable screening method to detect significant vascular stenosis (Fig. 49–2). It is widely available, involves no ionizing radiation, and provides real-time information regarding vascular anatomy and blood flow. Computed tomography (CT) is based on the principle that as an x-ray beam is transmitted through a substance, the beam energy is attenuated as a function of the tissue’s electron density. Using mathematical algorithms, the attenuation in each volume of a particular plane (voxel) can be reconstructed. Attenuation coefficients are assigned to each data point with an arbitrary value called a Hounsfield unit that ranges from (−1,000 H for air, 0 H for water, and +1,000 H for dense bone. To display the value of each data point on film, gray scales are chosen to reflect the range of attenuation coefficients. Advances in CT technology have resulted in better spatial resolution, thin sections (as small as 0.5 mm thick), faster scanning, decreased motion artifact, and reconstruction algorithms that enable reformations in any plane. Radiation exposure has been reduced to a typical dose of <3 cGy (<3 rad), which is comparable to standard radiograph dosage. FIGURE 49–1 Optic disc drusen. Left: Optic discs appear hyperemic in the right eye (RE) and pale on the left (LE). Right: B-scan at reduced sensitivity reveals strong echographic interface of buried disc drusen (arrow). Intravenous iodinated contrast discloses enhancement in areas of increased vascularity such as tumors, inflammation, and vascular malformations as well as in areas where there is breakdown of the blood brain barrier. CT is particularly advantageous in detection of acute intracranial hemorrhage, bone abnormalities including erosion, remodeling, hyperostosis, and fractures, as well as orbital and intracranial calcification (Fig. 49–3). Disadvantages include the use of ionizing radiation, and beam-hardening artifact from bone, and metallic clips and fillings. Benefits of use of intra-venous iodinated contrast must be weighed against its risks, including nephrotoxicity and severe allergic reactions. In general, contrast is required in all cases except trauma or when evaluating for a foreign body. Magnetic resonance imaging (MRI) is based on the principle that charged particles composing the atom, protons and electrons, rotate about their axes and as a result generate a magnetic field with north and south poles. As they revolve, they have a magnetic moment, a vector that describes the direction and strength of the magnetic field. Atoms with an odd number of atomic particles possess a larger magnetic moment than those that do not. One such example is hydrogen, because of its single proton nucleus. This property, plus its abundance in human tissue, makes hydrogen an ideal element to measure with MRI. Because the protons of each hydrogen atom spin in a random fashion, the net magnetic field of all mobile hydrogen protons in the body is zero. When body tissue is placed in a strong magnetic field (up to 25,000 times that of the earth’s magnetic force), mobile hydrogen protons align parallel or antiparallel to the magnetic field. The protons are then exposed to a brief radiofrequency (RF) pulse at a specific resonant (Larmor) frequency. This causes the protons to tip out of alignment with the main magnetic field, and precess (twirl like a top) around the magnetic lines of force. When the RF pulse is turned off, the absorbed energy is emitted over time via a process called relaxation, as protons try to return to their original orientation. This energy induces a current in a nearby receiver coil that can be measured. Protons in various tissues relax at different rates, giving a different RF signal or “echo.” This allows for differentiation of one tissue from another. FIGURE 49–2 Duplex carotid imaging. Left: Color ultrasound of internal carotid artery shows high-grade stenosis (arrow). Right: Doppler recording demonstrates intracranial peak systolic (white arrow) and diastolic (yellow arrow) velocities, and spectral broadening (asterisk) due to turbulent flow distal to the stenosis. FIGURE 49–3 Fibrous dysplasia. Computed tomography (CT) reveals thickening of the lesser wing of the sphenoid bone, and lateral wall of the orbit (white arrows), and expansion of the planum sphenoidale (asterisk). The left optic canal is narrowed (black arrow). The most commonly used pulse sequence in MR is spin-echo. This consists of a 90-degree RF pulse, which displaces nuclei into the transverse plane, where they soon start to relax. This is followed by a 180-degree pulse, which rephases nuclei and creates an “echo.” The time between the 90-degree pulses is called the repetition time (TR). The time between a 90-degree pulse and the application of the 180-degree pulse equals TE/2. TE is the time at which the activated receiver coil receives the peak signal from the refocused spins. By altering TR and TE values, several MR images are obtained: T1-weighted, T2-weighted, and proton or spin density (Table 49–1). Various tissues have different signal intensities on each pulse sequence (Table 49–2). Gray matter is decreased in signal intensity compared with white matter on T1-weighted images, whereas it is increased in signal intensity relative to white matter on T2-weighted images. This is caused by the higher water content of gray matter, which prolongs relaxation times. Cortical bone is decreased in signal intensity on both T1- and T2-weighted images. The paucity of mobile protons results in the low signal intensity observed in cortical bone. Rapid blood flow is decreased on T1- and T2-weighted scans. A tissue must be exposed to both 90- and 180-degree pulses of spin-echo sequences to emit a signal. If the velocity of blood is high enough that it passes through a tissue volume without being exposed to both pulses, no signal is emitted. Thus, blood appears as decreased signal intensity on both types of scans. This is referred to as a “flow void” phenomenon.
NEUROIMAGING
TECHNIQUES
ULTRASONOGRAPHY
DUPLEX CAROTID IMAGING
COMPUTED TOMOGRAPHY
MAGNETIC RESONANCE IMAGING
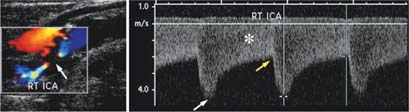
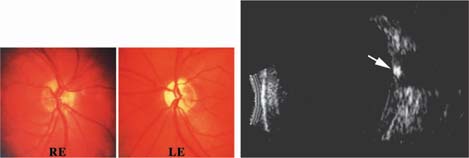
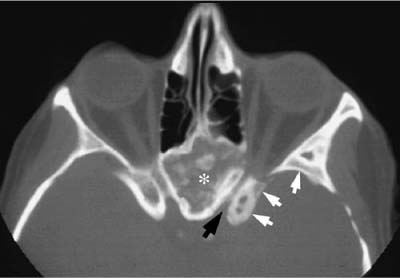
Image | TR | TE |
|---|---|---|
T1-weighted | short | short |
Proton density | long | short |
T2-weighted | long | long |
TR (msec): short: 200–1,000; long: 2,000–2,500.
TE (msec): short: 20–30; long: 50–1,000.
Gadolinium-diethylenetriamine pentaacetic acid (Gd-DTPA) is a paramagnetic contrast material developed for use in MR. Gadolinium is similar to iodinated contrast utilized in CT, in that it crosses a defect in the blood brain barrier. Gadolinium has seven unpaired electrons. The large magnetic moment of the electrons produces inhomogeneities in the local magnetic field that increases T1 and T2 relaxation rates. The increase in relaxation rates results in increased signal intensity, particularly on T1-weighted images.
| T1-weighted | T2-weighted |
|---|---|---|
Brain |
|
|
White matter | bright | darker |
Gray matter | darker | brighter |
CSF*/water | dark | bright |
Vitreous/aqueous | dark | bright |
Fat | bright | dark |
Rapidly flowing blood | black** | black** |
Cortical bone | black | black |
Air | black | black |
Calcification | black | black |
* CSF0/cerebrospinal fluid.
** Exquisitely dependent on pulse sequence and time parameters used.
Gadolinium has an excellent safety record. The only relative contraindication is hemolytic or sickle cell anemia. Rare allergic reactions (hives, bronchospasm) have been reported as well as headache, hypotension, and a transient rise in serum iron and bilirubin.
SPECIFIC MRI SCANNING SEQUENCES
Gradient Recalled Echo Imaging
In this technique smaller than 90-degree flip angles are followed by magnetic field gradient refocusing instead of a 180-degree radiofrequency refocusing pulse. In the absence of the 180-degree refocusing pulse, the protons encounter larger magnetic inhomogeneities and dephase faster. The signal intensity acquired represents what is called T2* effect. T2* reflects a combination of true T2 relaxation and the effects of local magnetic field inhomogeneities. Larger flip angles give T1 weighting and longer TEs produce T2* weighting. Advantages of this sequence include faster scanning times, improved sensitivity for detecting paramagnetic blood products, and acquiring three-dimensional data before planning for surgery. Disadvantages include increased magnetic susceptibility and chemical shift artifacts. Susceptibility artifacts can obscure anatomy at bone air or soft tissue air interfaces. Chemical shift artifact creates a parallel stripe effect at the interface of posterior globe retrobulbar fat due to signal misregistration in the frequency encoding direction.
Diffusion Weighted Imaging
Water molecules in the tissue continuously undergo random Brownian motion on a microscopic scale, termed diffusion and which is quantified as apparent diffusion coefficient (ADC). In ischemia, there is shift of extracellular water into the intracellular compartment, which results in decreased ADC. In diffusion weighted scanning a pair of strong pulsed magnetic field gradients is used to increase signal loss in fast-moving molecules, whereas protons that are stationary produce signal. Acute brain infarction is the most widely used clinical application of this technique (Fig. 49–4).
FLAIR Imaging
FLAIR stands for fluid-attenuated inversion recovery. It is a heavily T2-weighted sequence, albeit without any signal from the cerebrospinal fluid (CSF). It is particularly useful in areas of the brain where there is partial volume effect from CSF such as in the periventricular region or cortical surfaces. In this technique, signal from the CSF is suppressed with an initial 180-degree pulse, followed by a long time to inversion (TI) timed to allow water to relax into the XY plane before the tissue is exposed to 90- and 180-degree pulses. This sequence is very useful for parenchymal abnormalities, particularly multiple sclerosis, tumors, and ischemic lesions (Fig. 49–5).
Fat-Suppression Techniques
Because the orbit is largely filled with fat, MR techniques that utilize fat suppression are indispensable in detecting pathology. Suppression of fat signal improves the tissue contrast, increases detection of many lesions, eliminates chemical shift artifacts, and decreases motion related ghost artifacts (Fig. 49–6
Stay updated, free articles. Join our Telegram channel

Full access? Get Clinical Tree


