Neuro-Ophthalmologic Examination: The Visual Sensory System
Barry Skarf
Joel S. Glaser
Gary L. Trick
We have instruments of precision in increasing numbers with which we and our hospital assistants at untold expense make tests and take observation, the vast majority of which are but supplementary to the careful study of the patient by a keen observer using his eyes and ears, and fingers and a few simple aids.
Harvey Cushing
The goal of the neuro-ophthalmologic examination of the visual sensory system is to discover and diagnose abnormalities of the neural projections from the retina to the visual centers in the brain, and of disturbances of higher visual integration. In order to succeed at this task, we must take into account the physical properties of light and, more importantly, the anatomic and physiologic properties of the retina and the eye’s optical system. Consequently, a review of relevant anatomy and physiology is essential.
ANATOMY AND PHYSIOLOGY OF THE SENSORY VISUAL PATHWAYS
Normal human vision is not a single unitary faculty, but rather a synthesis of multiple semiautonomous functional subsystems, segregated into sets of separate pathways or “channels” between the eye and brain.1,2 This functional division into multiple channels is evident for both subcortical visual processes and in the primary visual cortex. Although there is extensive interaction, these visual channels transmit particular classes of visual information.1,2,3,4 Visual deficits that arise from diverse disease processes can selectively disturb these subsystems at various levels, giving rise to localizing subjective and objective signs.
RETINA
There are an average of 57.4 million rods and 3.3 million cones in the human retina.5 The cones each contain one of three photopigments with a maximum absorption at about 440 nm (S, short wave length sensitive; blue) 535 nm (M, medium; green), and 577 nm (L, long; red), respectively. The fovea centralis contains approximately 200,000 cones/mm2. Outside the fovea, the average density of cones is about 5,000/mm2, but the distribution of cones is not uniform. Cone density declines rapidly with distance from the fovea. In contrast, the density of rods is nil at the foveola, increasing rapidly with eccentricity to peak at 3 mm (20°) from the fovea, where there are 150,000 rods/mm2. The concentration of rods then decreases more gradually than does cone density, to about 35,000 rods/mm2 at the periphery of the retina.
The photoreceptor cells of the retina connect to the ganglion cells via bipolar cells that respond either to increments (“on-type”) or decrements (“off-type”) in light. Rods connect only to on-type bipolar cells, whereas cones connect with both on and off types.6 One on-type and one off-type bipolar cell innervate each ganglion cell, with the on bipolar exciting an on ganglion cell or inhibiting an off ganglion cell and vice versa. Bipolar cells also provide lateral connections to horizontal, amacrine, and interplexiform cells.7
The distribution of retinal ganglion cells is even more uneven than that of rods and cones. In the foveola, approximately 150,000 cones are connected to twice as many ganglion cells, because each cone connects via bipolar cells to two ganglion cells, one on and one off type.8 With increasing eccentricity from the fovea, gradually more photoreceptors converge onto single bipolar and retinal ganglion cells, which decrease markedly in density toward the periphery.8,9 In the far retinal periphery, there may be as many as 10,000 rods connected in clusters to a single ganglion cell, with considerable overlapping of clusters so that a point stimulus of light can trigger responses from several ganglion cells at once.
Patterns of neural interactions among various cell types in the retina have been studied and described. Rods and cones differ substantially in the patterns of their respective connections. These different patterns result in low spatial frequency (large size) contrast sensitivity for rod (scotopic) vision and high spatial frequency (fine detail) sensitivity for cone (photopic) vision.10
Receptive Fields
As a result of this architecture, it is possible to define the receptive field as the unit area of retinal function. The receptive field of a neuron is the retinal area for which a visual stimulus causes a change in the activity of that neuron. Receptive field sizes are smallest at the fovea and enlarge with retinal eccentricity as a consequence of the increase in the ratio of photoreceptors to ganglion cells.11 Under photopic conditions, the size of the on-type receptive field center is 4.5′ to 9′ at the fovea, increasing to 60′ to 90′ at 10° to 15° beyond the fovea and to 120′ to 200′ at 60° to 70° from the fovea. Similar to the inverse relationship between receptive field size and ganglion cell density, the number of overlapping receptive field centers at a given retinal point also decreases toward the periphery, from 32 centers at 10° of eccentricity to 13 at 70° of eccentricity.12 As a result, visual sensitivity decreases gradually with distance from the fovea.13 The retinal ganglion cell population, like the number of photoreceptors, decreases with aging,14 along with neuronal loss in the visual cortex of the brain. These phenomena are reflected in the decrease in overall visual sensitivity that occurs with aging.
Ganglion Cells and On/Off Dichotomy
One million retinal ganglion cells can be subdivided into at least 11 different classes. An average of 85% of these cells have concentrically organized center-surround receptive fields with two antagonistic regions. There are two types: on-center cells have a center that is activated by light, with an inhibitory surround, whereas off-center cells are excited by decrements in light falling inside their center and are inhibited by light decrements in their surround zone.15 The remaining 15% of the ganglion cells have no antagonistic surround mechanism, and the receptive field is nonconcentric. Generally, the diameter of the ganglion cell excitatory receptive field center is equal to the field size of its dendritic distribution within the retina.16
Studies have shown that the surround area of a receptive field is formed by interactions among horizontal and amacrine cells and not by convergence of input from on and off ganglion cells.17 Furthermore, the on and off retino-geniculo-striate pathways remain segregated up to the visual cortex, where they first converge onto single cortical neurons. The organization of cortical receptive fields is likely the product of intracortical circuitry, and not the result of convergence of the on and off pathways.6,17
Retino-Cortical Visual Pathway
Visual information originating from the retinal ganglion cells is transmitted via the optic nerve, which is formed at the optic disc by the retinal nerve fiber layer. The retinal nerve fiber layer can be divided into three topographic sectors: (a) the papillomacular bundle, which serves the macula and hence the central field of vision; (b) the relatively thick superior and inferior arcuate bundles, which roughly parallel their respective vascular arcades; and (c) the nasal radial bundles, which expand outward from the nasal aspect of the disc (see Chapter 4, Fig. 2). Lesions affecting each of these topographic sectors of the retina or optic disc produce characteristic patterns of visual field loss. Disruption in the papillomacular bundle results in a central or centro-cecal scotoma. Lesions of the arcuate bundles cause nasal depressions that form a “step” border at the horizontal meridian and arcuate scotomas in the superior and inferior hemifields (see Chapter 5, Figs. 4 and 7). Lesions of the nasal bundles produce wedge-shaped, sectorial defects radiating from the temporal aspect of the blind spot.
The optic nerve leaves the eye at the lamina cribrosa of the optic disc and meets the fellow optic nerve intracranially at the optic chiasm, where the optic nerve fibers coming from the nasal hemiretina cross to join the temporal hemiretinal fibers from the fellow eye. Lesions of the optic chiasm characteristically lead to complete or incomplete bitemporal hemianopias that are morphologically limited, at least in part, by the vertical meridian of the visual field (see Chapter 6).
Behind the optic chiasm, the retinal ganglion cell axons form the optic tract and travel to synapse in the lateral geniculate nucleus (LGN) of the posterior thalamus. The LGN is a compact structure made up of six layers in which the projections from each eye remain segregated. Layers 1, 4, and 6 receive inputs exclusively from the contralateral eye, and layers 2, 3, and 5 are innervated only by the ipsilateral eye (see Chapter 4). LGN postsynaptic neurons project to the visual cortex via the optic radiations. Lesions affecting the optic tract, LGN, optic radiations, and visual cortex produce hemifield defects (hemianopia) that are homonymous (i.e., occupy the same side of the visual field in both eyes, respecting the vertical meridian) (see Chapter 7).
Parallel Visual Pathways
Visual stimuli are processed via multiple neural channels, or parallel pathways (see Chapter 4, Fig. 12), which are specialized to transmit specific visual information.1,2,4 These neural channels become differentiated in the retina, where complex interactions and processing begin. They project from the retinal ganglion cells to the cortex, which is ultimately responsible for subjective visual perception.
MAGNOCELLULAR AND PARVOCELLULAR PARALLEL PATHWAYS.
Based on their morphology and response characteristics, retinal ganglion cells have been classified as P type, for those projecting to the parvocellular layers (layers 3 to 6) of the LGN; and M type, for those projecting to the magnocellular layers (layers 1 and 2) of the LGN.18 Parvocellular (P) retinal ganglion cells have small receptive field diameters, and small somal and axonal caliber, whereas magnocellular (M) retinal ganglion cells have large receptive fields (nearly six times larger than P cells), large cell bodies and axons.18 In accordance with their smaller receptive fields, P cells have higher spatial resolution.19 The conduction velocity of the visual signal is higher in M cells, as expected from their large axons, but M-type ganglion cells are 3 to 10 times less numerous than the P-type.20 The center-surround mechanism of M cells is more sensitive to achromatic luminance contrast as opposed to the dominant feature of color opponens in 80% of P-type cells. The sensitivity of M cells to achromatic contrast becomes most pronounced at short stimulus exposure durations, as they respond to visual stimuli transiently, at lower stimulus contrasts (below 15% contrast),20 and at lower levels of adapting background luminance.21
Most cones providing input to the center and surround of M cells are red and green types, and only some M cells appear to receive input from blue cones. The signals from blue (short wavelength sensitive) cones are transmitted via P cells and almost exclusively via the on pathway.22
In monkey eyes, selective lesions of the parvocellular system impair visual acuity, color vision, high spatial frequency (i.e., small size) and low temporal frequency (i.e., slow flicker) contrast sensitivity, brightness discrimination, pattern (shape and texture) discrimination, and stereopsis, whereas magnocellular lesions distort low spatial frequency contrast sensitivity, fast flicker, and low-contrast fast motion perception.2,23 In humans, the parvocellular system is affected by optic neuritis,24 and the magnocellular system is damaged preferentially in glaucoma.25
ON AND OFF PATHWAYS.
On and off pathways also remain morphologically segregated in the LGN. On-center ganglion cells are concentrated in layers 5 and 6, and off-center cells are concentrated in layers 3 and 4 of the parvocellular LGN.25 The magnocellular layers 1 and 2 have a mixture of both types of cells.
On and off pathways provide equal sensitivity and rapid information transfer for both light increments and decrements and facilitate the transmission of high-contrast sensitivity information,6 which is processed mainly by the magnocellular system. On and off pathways that subserve brightness are important contributors to color contrast perception, which is mediated mainly by the parvocellular pathway.26
Visual Cortex and Magnification Factor
The scale with which the visual field is mapped onto the striate cortex is dependent on eccentricity; the fovea is represented by a large area of visual cortex, and the periphery claims a relatively much smaller portion (see Chapter 4, Fig. 11).27 The central 10° field is represented by at least 60% of the occipital cortex. The cortical magnification factor (M) indicates the surface area of cortex associated with each unit area of visual field and is determined by the following relationship28:
M2 = mm2 cortex/degree2
VISUAL ACUITY
Visual acuity refers to the overall sensitivity of the visual system to spatial detail and is typically measured by determining the threshold for detecting a spatial component of a visual stimulus. This concept was introduced by Helmholtz,29 who first coined the term minimum separable to indicate the minimum spatial interval between two points of light sufficient to permit the visual system to perceive their duality. He thought that a distance just greater than one cone diameter should allow stimulation of two cones in the foveola, each with its own ganglion cell and “private line” into the central nervous system. In actual testing, however, the frequency with which subjects correctly identify dual lines increases gradually as the actual separation is increased (a frequency-of-seeing curve is used to represent this phenomenon),30 and the threshold separation often is specified as an arbitrary percentage, somewhat greater than 50%, of correct responses that an individual theoretically could achieve by random guessing. Clinically, however, the term visual acuity has come to describe standard measures of “minimal angle of resolution,” the threshold or minimal separation between two distinct visual stimuli (measured in degree of visual angle) that can be perceived visually under certain controlled operative conditions.31
Visual acuity measures both the optical quality of the retinal image and the functionality of the neural structures carrying the foveal projections to the striate cortex. Therefore, reduced visual acuity can be produced either by degrading the optical quality of the eye or a disruption of the fovea or its neural projections to the brain. The optical system of the eye is adversely affected by refraction (focus), light-scattering, diffraction, and absorption by the preretinal media. Among optical factors, diffraction causes spreading of light even in a perfectly focused system, and it varies inversely with pupil size.31 With pupil diameters of less than about 2.5 mm, “spread” of an optimally focused single point becomes progressively larger; thus, acuity decreases as pupil size is reduced below this diameter. For eyes with pupils between 2.5 and 6 mm in diameter, acuity remains relatively constant, whereas with pupils larger than 6 mm, optical aberration degrades acuity.31 Optical aberration occurs when light rays entering a large pupil do not converge precisely to a point.
Campbell and Green32 showed that the human visual system is capable of resolving a higher–spatial frequency (finer) grating if the optics of the eye are bypassed by producing the grating directly on the retina using laser-generated interference fringes. Diffraction in the eye lowers contrast of an optical image grating, but not the contrast of a laser-generated interference fringe grating. Improvement of performance (resolution of higher–spatial frequency gratings) obtained with increased contrast indicates, for the foveolar cones, that contrast sensitivity is a key factor determining the minimal angle of resolution (i.e., acuity). Another factor, the ultrastructure of the ocular media, can cause both backward and forward scattering of light that degrades the quality of the optical image. In addition, the ocular media are neither fully nor uniformly transparent to light, and some light is absorbed by these media. This absorption is wavelength dependent such that the shorter the wavelength of light entering the eye (i.e., toward the blue-violet), the greater the absorption.
Visual acuity also depends on the spatial arrangement and concentration of the photoreceptor mosaic in the foveola, which set an upper limit for spatial resolution. As Helmholtz first proposed, acuity is limited because of the finite size of the retinal receptors, but the neural connections among retinal cells may converge to produce larger summation areas less sensitive to fine detail.
The physical properties of the visual stimulus used to test acuity and the situation in which it is presented also influence discrimination. Most factors that affect light sensitivity influence visual acuity. Maximal acuity occurs in the range of photopic light levels at which the foveolar cones function optimally.33 These cone pathways have the highest light thresholds and operate poorly in dim (scotopic) light. Visual acuity falls off abruptly as light levels are reduced, principally because parafoveal cones and rods, which have greater light sensitivity, also have poorer spatial resolution.33 This is primarily a result of neural factors such as the larger summation area of the parafoveal receptor fields (greater numbers of cones and rods converging onto the same single ganglion cell). Visual acuity, maximal at the center of the fovea, decreases with eccentricity; for example, there is a 60% decrease in acuity at 1° off the foveola. Of course, adequate illumination is critical to cone function, and at very low light levels, when vision is dependent exclusively on rod function, acuity falls off abruptly. Maximal rod acuity is about 8 minutes of arc (20/160).33
Acuity is also dependent on background adapting luminance and stimulus contrast. The sensitivity of the eye for the detection of a stimulus varies with the level of adaptation to ambient light levels. The light and dark adaptation have two mechanisms, namely, a neural process that is completed in about 0.5 seconds and a slower photochemical process involving molecular changes in visual pigment that occurs in about 1 minute for light adaptation and 45 minutes for dark adaptation.34 Above the retinal illuminance level of 3.2 × 10⁻³ cd/m2, cones begin to contribute to visual sensitivity along with the rods (mesopic light level). Traditionally, rods are taken to be saturated at approximately 3 cd/m2, but above this level rods still contribute to color vision and pupil size.35 Nonetheless, the conventional adapting luminance used with the Goldmann perimeter, which is 10 cd/m2, is regarded as representative of the mesopic level.
The duration of stimulus presentation also influences measured acuity. For very brief presentations, acuity remains constant as long as the number of quanta absorbed remains constant (by increasing stimulus intensity in proportion to the decrease in the duration it is presented). For longer presentations, lasting 100 to 500 milliseconds, acuity improves with increasing duration, even though summation is no longer a factor.33
Finally, interactions between the stimulus used to test acuity and objects adjacent to it can also adversely affect acuity measures. This phenomenon often is referred to as “crowding” because visual acuity suffers when neighboring contours are too close (i.e., within a few minutes of arc).36
In clinical practice, visual acuity is expressed as the threshold value for which some aspect of the spatial dimension of the visual stimulus is the relevant variable. Typically, visual acuity is specified in terms of the visual angle defined by a particular spatial detail. The visual angle depends on the physical size of the stimulus and its distance from the observer. Because visual acuity is a sensory threshold, it is important to recognize that different subjective criteria will produce different types of acuity. The three most common acuity criteria are detection, resolution, and identification (recognition).31 Detection acuity is a measure of the smallest stimulus object or pattern of elements that can be discriminated from a uniform background or distinguished as a single feature. Consequently, detection acuity typically is specified as minimum angle of detection or minimum angle visible. Resolution acuity refers to the smallest amount of spatial detail necessary to distinguish a difference between patterns or identify features in a visible target. When resolution acuity is measured, the size of the stimulus is increased or decreased to determine the threshold size that elicits a correct response. Resolution acuity is specified as minimum angle of resolution, or MAR. Identification (or recognition) acuity is a measure of the minimum spatial detail necessary to recognize an object (e.g., an optotype) or identify the relative location of visible features in an object (e.g., the open segment of a ring). Identification acuity also is specified in terms of MAR.
Traditional Snellen charts and similar displays of letters, numbers, or symbols (optotypes) have been used to measure visual acuity clinically. These charts provide a high-contrast, clearly visible target and require that the patient identify or recognize the letters or symbols based on the spatial arrangement of their components. The size (minimum angle subtended by the components of the stimuli) varies; hence, the patient’s MAR is determined. However, as indicated, MAR can fluctuate depending on proximity or presence of adjacent stimuli. In order to control this effect, especially in clinical studies such as controlled trials, the standard types of acuity charts have been replaced by other types of charts, most notably the Bailey-Lovie logarithm of the minimum angle of resolution (logMAR) acuity chart,37 which was first widely used in the Early Treatment Diabetic Retinopathy Study (ETDRS).38 This system of acuity measurement addresses several key deficiencies of the standard clinical (Snellen-type) chart. It uses: (a) letters that are comparably difficult to identify, (b) an equal number of letters on each line, (c) proportional spacing between letters, and (d) logarithmic progression of size from line to line. These innovations adjust for the fact that not all letters of the alphabet are equally recognizable, and they attempt to standardize the effects of crowding while allowing proportional reductions of acuity to represent equivalent (logarithmic) decrements in resolution.
Other methods of evaluating visual acuity use letters or symbols of different contrast. The Pelli-Robson chart39 uses alphabetic letters of constant size that vary in contrast and measures the minimum contrast necessary for letter recognition. On the other hand, the chart devised by Regan and Neima40 resembles the Snellen and logMAR charts, with letters of decreasing size that are used as a measure of MAR. However, the Regan test provides a series of charts, each progressively decreasing in contrast (from black to medium to light gray optotypes on a white background) permitting measurement of low- as well as high-contrast acuity. Another sensitive index of visual–neural interactions is the measurement of hyperacuity, which refers to certain spatial distinctions that can be observed for which the thresholds are lower than even normal acuity.33 The best-known example of hyperacuity is Vernier alignment, in which the displacement of one linear element (line segment) relative to another element, within the same target, must be judged.33 Hyperacuity thresholds can even exceed the upper limit for discrimination that is implied by the spatial arrangement of the foveal cones, a finding indicating that such testing measures a different mechanism than resolution acuity.
Although many useful and sensitive tests of visual acuity have been developed, none has succeeded in displacing high-contrast character acuity as the standard. Because Snellen (optotype) acuity remains the most widely used measure of visual function in clinical practice, it is important to understand its nomenclature, value, and limitations. Snellen acuity generally is reported in a fractional notation (e.g., 20/20) in which the numerator refers to the distance at which an individual can successfully read the letters, and the denominator refers to the distance at which “a normal eye” should distinguish the same letters. Therefore, an eye with 20/40 vision is able to read at a distance of 20 ft the letters a normal eye could read at 40 ft, but it is unable to read smaller letters. The fractional notation used for character acuity must be interpreted with caution for several reasons. First, Snellen notation cannot be treated mathematically as a fraction. Instead, the Snellen notation must be converted to decimal form (20/20 = 1.0, 20/30 = 0.66, 20/40 = 0.5, etc.) for mathematical treatment. However, even when this is done it must be realized that Snellen acuity is a logarithmic measure and that equal increments in the decimal notation do not represent equivalent changes in acuity. For example, acuity of 20/50 (= 0.40) represents twice the resolution of 20/100 (= 0.2), and it is represented by an incremental change of 0.2, whereas the doubling of acuity represented by a change from 20/200 (= 0.1) to 20/100 (= 0.2) is represented by an incremental change of 0.1. Perhaps more importantly, nominal changes in acuity do not reflect comparable changes in the health of the optical or neural substrates. Abnormalities resulting in 20/80 vision are not necessarily twice as severe as those producing 20/40 vision.
Another limitation on the interpretation of character acuity is that 20/20 is an excessively lenient criterion for “normal” MAR. Frisén and Frisén,41 in a normative study of 100 individuals at various ages, found that average performance was considerably better than 20/15, even for the elderly groups. An average normal subject had a 10% probability of discriminating letters just larger than 20/10 (decimal acuity 1.9) and a 90% probability of discriminating letters just larger than 20/15 (1.3). However, rather than using the usual office practice of requiring almost 100% performance on a line of letters, these authors chose a 50% probability-of-seeing (discriminating) criterion and a 10-letter Sloan chart as most suitable for this study. Whether one agrees with this choice or not, it is necessary to recognize that the criterion used in that study produces higher (better) acuities compared with the more stringent (90% to 100%) performance criterion used routinely in clinical practice.
CONTRAST SENSITIVITY
Standard tests of visual acuity (e.g., Snellen optotypes) generally measure resolution of fine detail at high contrast (black on white). However, common everyday visual experience is not a high-contrast phenomenon. Most objects are seen against a variable background or with other objects at a moderate or intermediate level of contrast. The visual scene typically is made up of large and small objects with coarse outlines intermingled with fine detail and producing a mixture of stimuli that include gradual transitions between areas of light and dark, as well as abrupt transitions and sharp edges. This means that visual acuity as measured clinically does not begin to assess the capacity of our visual system to distinguish and identify a wide variety of different images. Selective loss of intermediate and low spatial frequencies may produce disturbing visual symptoms in patients with nominally “normal” visual acuity as measured with standard high-contrast, sharp-edged optotypes.
In visual physiology, contrast is defined as change in brightness across space or time. The change, whether spatial or temporal, may be gradual or abrupt (Fig. 1), single (only one transition) or repetitive (steady-state). If the visual stimulus consists of a repetitive pattern of varying luminance (e.g., a pattern of stripes or checks), then the pattern can be described in terms of spatial contrast. For most clinical and research purposes, the contrast of a visual stimulus is defined by the relationship between these intensities (I), such that
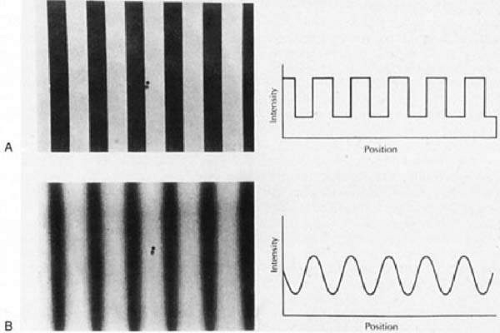 Fig. 1. Contrast sensitivity function. A. Sharp edge luminance change; square wave transition. B. Gradual luminance change; sine wave transition. (From Cornsweet, TN: Visual Perception. New York: Academic Press, 1970, with permission.) |
Contrast = (Imax – Imin) (Imax + Imin)
Thus, contrast can vary from a minimum of 0 to maximum of 1.0. Using stimuli of decreasing contrast, visual function can be assessed by determining the minimum contrast or contrast sensitivity at which a specific test pattern can be detected. On the other hand, visual resolution is more directly related to the degree of spatial detail (i.e., the spatial frequency) of the pattern. Thus, spatial contrast sensitivity is a measure of the ability to resolve diverse patterns with a more obvious relationship to the range of everyday visual experience of discrimination and identification than is provided by routine clinical tests of visual acuity.
The most common stimuli for clinical evaluation of spatial contrast sensitivity are repetitive patterns of alternating light and dark bars in which the luminance of the bars varies sinusoidally along a single axis. This pattern is known as a sine wave grating (see Fig. 1B). The periodicity of the pattern is referred to as its spatial frequency and generally is specified in cycles (pairs of light and dark bars) per degree of visual angle. The spatial frequency is used to represent the degree of spatial detail in the stimulus. Thus, a relatively broad wave with cycles subtending 2° has a spatial frequency of 0.5 cycles per degree (cpd), whereas a narrower wave subtending 0.2° has a spatial frequency of 5 cpd. A true sinusoidal grating can be described by a single frequency and the contrast between the brightest and dimmest parts of the wave. On the other hand, a square wave grating is a pattern with sharp edges such as a series of dark and light bars (see Fig. 1A). Square wave gratings are complex visual stimuli made up of mixed spatial frequency components (many different waves of low and high frequencies). Similarly, a complex visual image in the real world, characterized by abrupt transitions from bright to dark, is made of numerous high–spatial frequency components. In contrast, an image made up primarily of low–spatial frequency components should contain gradual transitions and little fine detail.
Human contrast sensitivity usually is tested using sine wave gratings of various frequencies. The contrast sensitivity for a particular spatial frequency grating is the inverse of the contrast threshold (i.e., the minimum contrast necessary for the pattern to be “just detectable”). The contrast sensitivity of the human visual systems varies with spatial frequency such that maximum sensitivity is normally for spatial frequencies of about 3 to 5 cpd; sensitivity falls off at both higher and lower spatial frequencies (Fig. 3). However, many factors affect the shape of the human contrast sensitivity curve (function), including background adaptation level, stimulus field size, retinal eccentricity, pattern orientation, pupil size, and defocus. Abnormalities of contrast sensitivity are known to occur in numerous retinal and optic nerve disorders as well as anterior segment disease, but the utility of contrast sensitivity testing for differentiating particular disorders remains an unresolved issue.
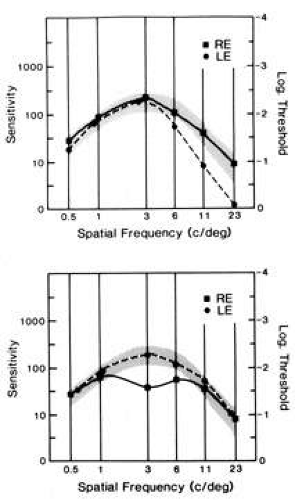 Fig. 3. Graphs of contrast sensitivity (ordinate) versus spatial frequency (abscissa). The normal range is shaded in gray. In the upper plot there is gradual fall-off of sensitivity at high spatial frequencies resulting from optical blur in the left eye. The lower plot illustrates selective loss of midspatial frequencies in a patient with optic neuritis of the right eye. (Courtesy Nicollet Co., Chicago.) |
Color Vision
Within the limits of the visible spectrum (approximately 400 to 700 nm), the human visual system has a remarkably good sensitivity to differences in color. Color is largely determined by the physical properties of light energy entering the eye. However, the eye and visual pathways also influence subjective color perception. The physical properties of light (and their corresponding perceptual attributes) that characterize color are: (a) wavelength (hue), (b) intensity (luminance), and (b) colorimetric purity (saturation).42 Significantly, the color perceived also depends on the chromatic properties of surrounding objects and background.
Normal human color vision is trichromatic; an individual with normal color vision can match the color appearance of any colored field by appropriately adjusting the relative intensity of three suitably chosen unique primary colors. Indeed, Thomas Young in 1802 speculated that only three individual color-sensitive mechanisms, each with broad spectral sensitivity, are necessary to account for all color perception. However, it was not until 1964 that color matching experiments performed by the Nobel laureate George Wald43 revealed that mixtures of three primary colors are sufficient to produce the entire spectrum of perceptible colors. The trichromatic nature of normal human color vision is based on three distinct types of photopigments, each found in the outer segments of the specific cone photoreceptors. Each of the three photopigments has a broadband spectral absorption function with peak absorption in a distinct region of the visual spectrum, but with considerable overlap. This overlap provides for the fact that any given wavelength of light stimulates all three photopigments, but the strength of the photoreceptor response is at different levels for each wavelength. Based on the unique absorption peak of the pigment in a particular cone photoreceptor, the designation of long- (L or red), medium- (M or green), and short- (S or blue) wavelength photoreceptors has become widely adopted. The population of cones with peak absorption close to the wavelength of a given light stimulus is activated most intensely, and the cones with peak sensitivity farthest from that wavelength respond least. It is the ratio of the activity generated by the three mechanisms that is specific for each wavelength of light. In this way, the retina can provide for discrimination of all wavelengths at each retinal locus by way of only three differentially sensitive cones at each locus.
The neural processing of color information is known to involve transformation of the signals from the three cone types such that, at the level of the optic nerve, color coding is not based on individual cone-specific responses, but it reflects excitatory (facilitatory) and inhibitory (opponent) interactions between the signals from the specific cone types. There are three color-opponent neural pathways that convey color information from the three classes of retinal cone photoreceptors: a red-green pathway that signals differences between L and M cone responses; a blue-yellow pathway that signals differences between S cone responses and a sum of L and M cone responses; and a luminance pathway that signals a sum of L and M cone responses. Functional magnetic resonance imaging suggests color-opponent encoding of cortical neurons with the strongest response to red-green stimuli in cortical areas V1 and V2.44 These concepts have implications on the nature of color deficits associated with optic nerve disease in which the photoreceptor response may be normal, but the interactions among the neural signals may be defective.
One of the major hurdles in understanding color vision is the obscure terminology that has evolved and persisted as physiologic concepts developed. For example, the three major types of congenital color defects were termed protan, deutan, and tritan, respectively, but these words mean only the “first, second, and third” defects and have nothing whatsoever to do with the pathology of the underlying color vision mechanisms. Color vision deficits (dyschromatopsias) are best understood in relation to the trichromacy of normal color vision. Dyschromatopsias are either congenital or acquired as a function of disease of the eye or visual pathways. Almost 10% of males and approximately 0.5% to 1.0% of females in the general population have congenital defects of color vision that impair their ability to make normal color discriminations. The least severe form is anomalous trichromacy, characterized technically by the ability match the color appearance of any colored field by adjusting three suitably chosen unique primary colors (similar to normal trichromats), but requiring significantly different relative radiances of the primary colors to do so. Such refined color sense is assessed on an anomaloscope, which permits variable combinations of two colored lights (usually red and green) that are adjusted subjectively to match a standardized yellow. Historically, anomalous trichromats are considered to have an abnormal photopigment in one of the three types of cone photoreceptors (L, M, or S). Consequently, anomalous trichromats typically are referred to as protanomalous, deuteranomalous, or tritanomalous depending on whether the abnormal photopigment is in L, M, or S wavelength photoreceptors, respectively. Depending on the extent of the anomaly in the photopigment absorption and the severity of the resulting color discrimination deficit, anomalous trichromats may be classified as having mild, moderate, or even severe deficiencies. Dichromats exhibit more pronounced color vision deficits than anomalous trichromats. Dichromasy is characterized by the ability to match the color appearance of any colored field by adjusting two, rather than three, primary colors. This feature suggests the failure, or perhaps absence, of one of the underlying photoreceptors types. Dichromats typically are referred to as protanomalous, deuteranomalous, or tritanomalous, depending on whether the defect is related to the response of L, M, or S wavelength photoreceptors, respectively. The smallest group of congenitally color-deficient individuals is the achromats. Achromacy is characterized by the ability to match the color appearance of any colored field by adjusting the radiance of any single primary color. Simplistically, these individuals may possess only a single cone photopigment or they may have no functioning cones at all. In the latter case, only rods are responsive and central vision also is reduced.
Acquired color vision deficits resulting from pathologic changes of the eye, retina, or visual pathways frequently are referred to as protan, deutan, or tritan defects. However, the use of this terminology, at least in part, has evolved from the application of tests originally designed to detect congenital color defects. It is important to recognize that, with the possible exception of diseases specifically affecting the cone photoreceptors, it is unlikely that similar mechanisms underlie acquired “protan, deutan, or tritan” defects. Other factors aid in differentiating congenital from acquired color vision defects. In particular, congenital anomalies are bilateral and symmetric, whereas acquired defects are rarely symmetric. Furthermore, congenital defects are nonprogressive, whereas acquired defects generally progress. Kollner45 originally proposed that acquired dyschromatopsia caused by optic nerve disease typically produces red-green deficits, whereas a loss of blue-yellow discrimination is more characteristic of retinal/macular disorders. There are numerous exceptions to this rule, and it should be considered no more than a casual guide. Indeed, some macular diseases may show red-green confusion deficits, whereas optic neuropathies have blue-yellow deficits early in their pathogenesis. In either instance, both red-green and blue-yellow deficits usually evolve as the disease progresses. Finally, in considering acquired color vision deficiencies, it is important to recognize that changes in the optical properties of the preretinal media (in particular, wavelength-specific changes in the absorption properties of the lens) can produce significant color discrimination defects. In addition, the normal aging process can contribute to a reduction in color discrimination that can confound the interpretation of color test results.
NEURO-OPHTHALMOLOGIC EVALUATION OF VISUAL FUNCTION
The neuro-ophthalmologic examination of the sensory visual system employs various strategies and examination techniques for the dual purpose of: (a) determining the probable cause or at least the topographic localization of the lesions causing a visual disturbance or symptom, and (b) documenting the character and extent of the visual disturbance. Frequently, these two objectives are so closely linked that they cannot truly be separated. By evaluating the character and extent of a visual deficit, the site of the lesion and the probable cause often can be deduced. A trivial example will suffice. If a patient’s visual symptoms are found to be associated with a true bitemporal hemianopia, the disorder certainly is situated at the chiasm and the cause is most likely a tumor in or close to the sella turcica. The neuro-ophthalmologic examination of patients with occult visual problems or with otherwise unexplained visual disturbances must use this goal-directed approach.
Frequently, the neuro-ophthalmologic approach involves considerable “detective work,” namely, collecting evidence and assembling clues that can identify the origin and nature of the visual disturbance with increasing certainty. The more supporting evidence that can be accumulated, the stronger is the likelihood of a correct diagnosis. Information that does not fit must first be rechecked, reconfirmed, modified, or discarded. All genuine findings should be explained and, if possible, reconciled. Failure to account for observations that appear incompatible with a diagnosis can be perilous.
The principles, examination procedures, and techniques described here are not restricted to the patient with a suspected neuro-ophthalmologic disorder. They are useful in localizing and diagnosing any disturbance of vision, and particularly those involving occult processes, because the systematic approach used in neuro-ophthalmology frequently results in the accurate diagnosis of optical, retinal, and anterior segment disorders. However, the emphasis here is on the basic maneuvers and techniques essential in the elucidation of neuro-ophthalmologic problems. Consequently, measurements of foveal and optic nerve function, sensitivity to color and brightness, and the visual field examination are of major importance and receive special attention.
The technology available to assess visual function and evaluate the sensory visual system is increasing dramatically from year to year. In addition to traditional Snellen and more recent logMAR optotype acuity, foveal function also can be scrutinized using various types of contrast sensitivity testing, suprathreshold contrast matching tests, spatial frequency-filtered acuity tests, and a variety of electrophysiologic tests, including focal, multifocal, and pattern electroretinography (ERG) and visual evoked potentials (VEPs). Visual fields now can be evaluated by a selection of computerized tests, performed using several different instruments, as well as by the more traditional methods. However, as always, the diagnostic process begins with history taking. The characteristics of visual symptoms, their evolution, and their associated neurologic and systemic problems provide important, often unique, clues to localization and etiology of visual pathway lesions, and they are arguably more critical for the accurate and timely diagnosis of lesions involving the sensory visual pathway than for diseases involving other parts of the visual apparatus.
Symptoms
Blurring is the most common complaint of patients with vision problems; unfortunately, it is also the most nonspecific. Blurring or indistinctness of boundaries and lines is produced by degradation of the optical image on the retina in refractive disorders and by opacities of the ocular media. These optical causes of blur must be distinguished from similar symptoms of neurologic lesions. Associated symptoms such as color loss or dyschromatopsia (hue desaturation) or dimness of vision should be sought to make this distinction.
The word scotoma implies a circumscribed area of darkness or dimness in the visual field. However, some patients refer to a scotomatous area as blurred rather than dark. Localized blur or otherwise degraded vision in the center of the visual field may indicate either macular changes or optic nerve disease with predominant involvement of the papillomacular nerve fiber bundle. Pronounced central field depression is not indicative of refractive errors or ocular media opacities, which rather produce diffuse or nonlocalized blurring of vision.
The sensory visual system is organized operationally into a series of neural channels having specific functions (see the discussion of parallel pathways). There are even separate channels for contrast perception of coarse, as opposed to fine, detail and there may be diminished sensitivity for one stimulus category and not for others. For instance, specific loss of sensitivity for medium spatial frequency visual information is a common residual dysfunction following recovery from optic neuritis. When viewed with the affected eye, objects appear faded or washed out, even though the contours still appear sharp. The latter aspect correlates with relatively normal function of high-spatial frequency channels that are responsible for encoding fine detail (see the preceding discussion of contrast sensitivity).
The term ghost image is used to describe a form of monocular diplopia in which an image appears to be edged or outlined by a secondary, usually dimmer, image; or the ghosting may appear as a line faintly duplicated in a second superimposed image. This type of symptom almost always is a result of irregularities in the optical media of the eye, often attributable to cataracts and even to uncorrected astigmatism. Ghost images always are visible monocularly, although they may be present for each eye, and they almost always are eliminated by the use of a pinhole aperture. Ghost images must be distinguished from small-angle diplopia, in which the second image disappears on occlusion of either eye. In addition, for true binocular diplopia resulting from muscle imbalance or paresis, the two images have equal visual density or clarity if vision in the two eyes is good. However, it should be noted that the combination of diplopia and reduced contrast sensitivity in one eye may mimic the faded ghost image seen with monocular diplopia.
Curvilinear distortion of straight lines or patterns is called metamorphopsia, and indicates the presence of macular edema, submacular fluid, epimacular membrane, retinochoroidal folds, or other retinal distortion that results in alteration of photoreceptor orientation. Objects may seem too large (macropsia) or too small (micropsia) as a result of abnormal compression or separation of photoreceptor elements in the fovea. Metamorphopsia usually is monocular, or at least asymmetric, and it cannot be a result of retrobulbar optic neuropathy.
A sense of darkness or dimmed light often accompanies optic neuropathy, even when central vision is relatively preserved. It seems as if the visual pathway has separate channels encoding brightness information that may be altered selectively in optic nerve disease. A sense of darkness is more strongly associated with depression of the entire field, rather than with small central scotomas. In addition, persons with central scotomas note relatively better vision in dim lighting46 because the paracentral and peripheral rod photoreceptors operate better at low light levels (scotopic conditions).
A dynamic sensation of continuous dimming or darkening of vision can be attributed more readily to retinal disease and can occur when retinal or choroidal perfusion is insufficient to meet the retina’s metabolic demands. In such cases, an interval in darkness promotes temporary improvement, and an abnormal photostress test (see the following) confirms the diagnosis. Dimness also may be the principal complaint with hemianopia, particularly when the lesion involves the chiasm or optic tract.
Acquired disorders of the afferent visual pathways commonly disrupt color perception. Patients may report a sense of reduced vividness of colors, or they may state that colors are washed out (desaturated) or dull when they are questioned. Although red seems disproportionately susceptible to this subjective alteration, patients usually agree that all colors are less vivid. Some patients characterize the altered shades of color as darker—red is shifted toward amber or brown, whereas others say colors appear faded or lighter—red is shifted toward pink, orange, or yellow. This subjective variability may result from the degree to which the associated brightness channels in the afferent visual system are involved. Central dyschromatopsia can occur rarely with lesions of the inferior occipital cortex. These lesions may produce color vision defects that are quite distinctive and always bilateral (see Chapter 7). Patients complain that color sensation is absent and the world appears to be black and white. Inability to name colors, but with intact color discrimination, characterizes alexia without agraphia (see the following) because color discrimination is a function of the right hemisphere, but naming requires transfer of visual information to the left hemisphere, which is blocked in this condition.
Reading, like walking, is a refined skill that requires complex sensory, perceptual, and motor coordination. Scrutinizing how a patient reads can be as useful as observing a patient’s gait; it can provide the physician with a wealth of information on visual system function. Reading requires coordinated participation of the sensory visual system and the ocular motor apparatus. Patients with simple hemianopias that split fixation (i.e., that pass through the fovea) may complain of difficulty reading, particularly with the loss of the right hemifield, because they cannot scan forward adequately on the printed page. Patients with left hemianopia may read a line of text fluently, but they have difficulty finding the left-hand margin and the beginning of the next line. Hemifield loss may be evident when testing acuity as the patient may fail to see letters toward the side of the chart corresponding to the side of the hemianopia (Fig. 2).
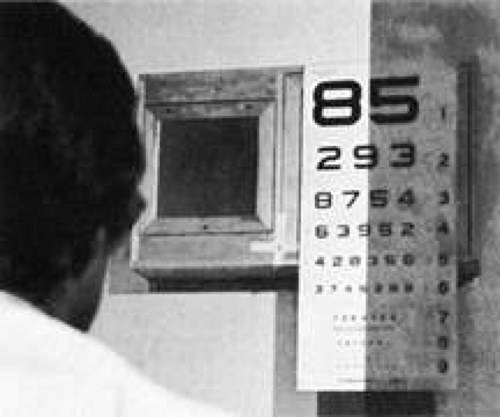 Fig. 2. A patient with hemianopia may ignore half of the reading chart. Such defects can be asymptomatic. |
Reading difficulties resulting from hemianopic field loss occur when there is loss of the macular representation in the hemianopic field and usually are not present when the central portion of the hemianopic field is preserved, as occurs with macular sparing (see the following). Conversely, patients with partial hemianopias involving only the paracentral region adjacent to fixation (i.e., half the macula) often complain of difficulty reading, and they may read the eye chart in the selective manner previously described, leaving out letters on the side of their hemianopic field defect (see Fig. 2). Patients who read the chart selectively in this way provide a strong clue to the nature of their field defect. This behavior may be critical in suggesting the correct diagnosis in patients with normal peripheral fields and a small, occult, central hemianopic defect. This type of limited central homonymous hemianopia can occur when the lesion is confined to the occipital pole of the visual cortex, or it can occur in one or both eyes in cases of chiasmal dysfunction.
Migraine frequently affects reading because visual auras at or close to fixation, with shifting patches of mixed negative and bright positive scotomas, can obscure one or two letters at a time. This transient hemianopic scotoma must be distinguished from the common running together of print as occurs with insidious presbyopia, and that is relieved with appropriate refractive correction for near vision.
Alexia without agraphia (see Chapter 7) is an extreme and specific reading disorder in which the right occipital cortex is disconnected from the language mechanism in the left hemisphere because of a lesion involving the splenium of the corpus callosum, where an extensive bundle of commissural fibers links the right and left visual association cortices. A second lesion, most commonly involving the left calcarine cortex, produces a dense right homonymous hemianopia, so that visual information enters only the right occipital cortex from the left hemifield. The written word is perceived accurately as a complex form in the right occiput, but linguistic analysis of the words, which requires participation of the left hemisphere in most individuals, is blocked by the callosal lesion. Auditory and tactile input to the language mechanism is intact, so the patient is not aphasic and can write spontaneously or in response to spoken dictation. This was one of the first disconnection syndromes to be demonstrated adequately in clinical neurology.
TESTS OF MACULAR AND FOVEAL FUNCTION
Visual Acuity
Visual acuity must be recorded each time a patient is examined. Standard acuity measures can be extremely helpful in diagnosing lesions of the visual pathway. However, paradoxically they may be relatively insensitive to pathologic processes involving the optic nerves, chiasm, and retro-chiasmal pathways. When a lesion of the optic nerve or chiasm reduces acuity by more than a few lines, there is also diminished color sense, a relative afferent pupillary defect (RAPD), and a significant field defect. Ocular disease, on the other hand, including most occult processes involving the macula, can reduce acuity substantially without necessarily producing dramatic deficits in color perception, pupillary response, or visual field.
Snellen letter visual acuity testing is firmly entrenched in clinical ophthalmology. It is measured using printed “eye charts” or facsimiles of these charts on projection slides, computer-generated displays, and light boxes. The individual characters (letters or numbers) on the acuity chart are called optotypes. Standards for the printing of charts and projection slides dictate that letters be high in contrast (usually >85% to 90%). Block characters (sans serif or Gothic fonts) and overall letter width and height should be nearly equal. By definition, the 20/20 letter subtends 5 minutes of visual angle at the retina, and each component stroke of the letter is 1 minute wide. Thus, 20/20 vision could be interpreted as the ability to resolve images with details subtending as little as 1 minute of arc. However, as discussed in the following, this is a gross oversimplification. The usual fractional notation (20/20), although easily recognized, is not a particularly useful designation because it is awkward to manipulate arithmetically and statistically (see Visual Acuity in the preceding section on Anatomy and Physiology). The numerator refers to the distance from which the patient reads the letters, and the denominator is the distance at which a “normal” eye could identify the same letters. As an observer moves from a viewing distance of 40 to one of 20 feet, the retinal image becomes twice as large. In a sense then, acuity of 20/40 is half as good as 20/20. Similarly, 20/80 can be considered half as good again as 20/40, but what is not clear is whether a pathologic process producing 20/80 vision is twice as severe as that which results in 20/40 vision. As discussed in the preceding, measured acuity depends greatly on the conditions under which the subject is tested, the criteria applied to subject performance on reading an eye chart, and the construction of the chart itself.
Because acuity can vary with environment and exposure to light, it should be measured under controlled conditions. Abnormalities of the ocular media and macular disease may adversely affect visual acuity depending on current and recent exposure to light, if such exposure can result in glare or prolonged recovery after bleaching of retinal photoreceptors (as occurs in macular edema, serous detachment, and photoreceptor degenerations). Thus, patients with vague visual complaints that may result from glare or dazzle may have normal acuity in a dim room or after resting their eyes. When the symptoms occur under certain specific environmental conditions, the astute clinician is advised to test acuity and visual function under lighting conditions mimicking those prevailing during the offending situations. In this way, the circumstances that induce or aggravate visual disturbances can be used advantageously to help localize the cause of the visual disturbance (e.g., see Photostress Test, later).
When testing acuity or other aspects of visual sensory function, there is a tendency to be limited by the equipment at hand. This is an artificial constraint. A patient who cannot read the Snellen or equivalent distance chart needs to be evaluated further, and quantitative measures of acuity should still be sought. Some patients may be able to identify the large numbers or symbols on a reading card, especially at close range. Patients with central scotomas can often identify single letters presented within their paracentral field. Tests designed to evaluate acuity in children such as the Sheridan-Gardner, HOTV tests or a simple E card can be very useful. The most sensitive portion of the visual field can be identified at close range, and then the distance from the smallest symbol that can be reliably identified should be recorded. Thus, a patient who can see a 20/100 E card at 5 ft, fixing eccentrically with the superior nasal quadrant, should have acuity recorded as follows: “5/100 S(upra)N(asal) with single E card.” When presenting this type of stimulus at close range, appropriate near correction must be used with patients older than 40 years, and it may even be helpful in younger patients. These cards also are useful with the occasional patient who has a central disorder (e.g., dyslexia, aphasia, or agnosia) that limits the ability to name characters, although these characters can be seen and recognized. Anyone who can count fingers should be able to identify large single letters, but those patients who cannot should have acuity recorded as “counts fingers,” “hand movements,” or “perceives light” in a particular quadrant at a specified distance. Some patients who cannot see well enough to count fingers can see movement of just the fingers, so that “finger movement” can be used as an intermediate grade between count fingers and hand movements. When testing perception of movement or light, care must be taken to interrupt the stimulation and ask that the patient identify when, and not just if, he or she detects the stimulus. With hand movements, one can also inquire about the direction of movement. Many of these methods are also useful when testing acuity at the bedside and whenever a patient cannot be brought to an examining room. Specific techniques available for testing visual acuity in infants and children are addressed in Chapter 13.
Additional clues as to the nature of a visual disturbance can be derived from the actual process of obtaining a patient’s acuity. Most practitioners recognize that the failure to see characters on the right or left side of an acuity chart should arouse suspicion of a hemianopia. However, patients frequently state that certain portions of a line of characters appear blurred, absent, distorted, doubled, or deviated. This information can be useful in determining the site of the disturbance. Diseases of the optic nerves, chiasm, and tracts, as well the posterior visual pathway, do not produce monocular metamorphopsia, whether it is described as distortion, doubling, or deviation of images. On the other hand, central lesions occasionally generate distorted images and visual illusions that mimic true metamorphopsia, but they are seen with either eye. Thus, unilateral metamorphopsia certainly is ocular in origin. Of course, ocular diseases include disturbances of the optic disc, such as papilledema, which can distort the retina and can cause metamorphopsia.
Depending on a patient’s symptoms, it may be advisable to determine best corrected visual acuity at distance and near, and both monocularly and binocularly, because some symptoms may appear only under selected circumstances. Any unexplained discrepancy in visual function should arouse concern. For example, a patient with latent nystagmus may have substantially better acuity when using both eyes as compared to the monocular acuity of each eye when the other is covered. Moreover, there may be significant inconsistencies in the findings when the visual problem is factitious or “functional,” thus providing a clue to its origin (see the following).
Contrast Sensitivity
The measurement of contrast sensitivity in a clinical setting has been simplified by the appearance of a variety of new charts and electronic devices. The scientific method for determining contrast sensitivity is to measure sensitivity thresholds at a series of different spatial frequencies using sine wave gratings (see Fig. 1B) displayed on a video monitor. The gratings are displayed while the contrast is varied, and the patient signals when the pattern is first detected. The mean and standard deviation of this threshold are calculated for various spatial frequencies, typically ranging from 0.5 to 23 cpd, and the graphic representation of these data determines the contrast sensitivity function or curve. In humans, there is a contrast sensitivity peak around 4 cpd (see Fig. 3). Although commercially designed equipment that simplifies this process is now available, determining contrast sensitivity functions is time consuming and impractical in most clinical settings. However, research studies39 using this method have led to the detection of four basic patterns of selective loss in pathologic states: (a) high-frequency loss, (b) broad or generalized loss at all frequencies, (c) mid-frequency (notch) defects, and (d) low mid-frequency loss. Thus, in practice, only two measurements are needed in order to detect all patterns of loss: (a) visual acuity, which is a measure of high-frequency contrast; and (b) an intermediate spatial frequency contrast threshold. Concentrating on developing a simplified test of contrast sensitivity in the intermediate-frequency range, Regan and Neima40 and Pelli et al39,47 developed charts using familiar optotypes, varying in contrast (black to light gray letters on a white background).
The Pelli-Robson chart was designed using optotypes of fixed size, but varying contrast (gray to black) to test for mid-range spatial-frequency loss.47 This technique reliably discriminates normal from abnormal peak contrast sensitivity.39 Regan and Neima40 also developed a set of low-contrast optotype acuity charts aimed at testing discrimination that depends on mid-range spatial frequencies. The charts are at least equal to sine wave grating tests in detecting spatial frequency loss in the mid-range of the contrast sensitivity function in patients with diabetes, glaucoma, ocular hypertension, and Parkinson’s disease. Both tests offer the clinician a familiar, practical method of measuring contrast sensitivity at mid-spatial frequencies.
In contrast, the Vistech wall chart48 differs from the Pelli-Robson and Regan charts because it uses sine wave gratings presented at different orientations and contrasts. In place of individual letters, each grating is displayed as a small, circular spot on the chart, which consists of five rows, each with nine spots. The spatial frequency of the gratings in a particular row is constant, but it increases toward the bottom. The contrast of the individual grating decreases from left to right along each row. Subjects are asked to identify the orientation of the individual gratings. Rubin49 compared the Pelli-Robson, Regan, and Vistech charts and reported that the Pelli-Robson charts were the most sensitive in detecting loss of peak contrast sensitivity (at midrange spatial frequencies) and gave the most reproducible results. He found that measurement of peak contrast sensitivity alone was extremely effective in detecting pathologic states and concluded that, in clinical testing, it is not necessary to measure sensitivity to individual spatial frequencies using different sine wave gratings. The Optic Neuritis Treatment Trial found that Pelli-Robson contrast sensitivity testing is the most sensitive indicator of visual dysfunction in the setting of normal visual acuity,50 but this study did not compare Pelli-Robson with other tests of contrast sensitivity (see Chapter 5).
Color Vision
The subjective appreciation of color saturation or brightness is one of the most useful clinical components of the sensory neuro-ophthalmologic examination. As indicated, color sensitivity is typically reduced dramatically in inflammatory, infiltrative, and compressive optic and chiasmal neuropathies, even when acuity is relatively well preserved. Color sensitivity is depressed in ischemic optic neuropathy if both superior and inferior portions of the central field are involved. The effect of optic neuropathies on color is in marked contrast to the relatively well preserved color sensitivity in most acquired macular and ocular disease, in which acuity usually is more disturbed than is color vision.
Color vision can be evaluated clinical using a variety of simple or complex tests. Booklets of color plates such as the Hardy-Rand-Rittler (HRR) series (reissued in a new edition) or various versions of Ishihara’s pseudoisochromatic plates, as well as a number of imitators, are simple to use and readily available. Because the neuro-ophthalmic color evaluation is concerned primarily with topical diagnosis and semiqualitative assessment of color sense rather than the determination of congenital color vision deficiencies, standardized lighting and viewing distances are less strictly enforced. The number of characters identified correctly is recorded (“16 of 25 digits”), so that credit is given when either one or two characters on a plate are recognized. It is important to note the ease and rapidity with which patients identify characters. Some patients may identify characters only after tracing them. (The patient preferably should point or use an artist’s soft paintbrush because actually touching the color plates eventually produces damage.)
Patients may be asked to simply describe the color of different objects (e.g., bottle caps or colored sheets of paper) and the degree of color saturation of the objects should be noted. If one eye has normal or substantially better vision, comparison of gross color saturation between the two eyes and between paired quadrants of the visual field can be assessed (see Visual Fields and Perimetry). During such comparison testing, care must be taken to keep constant the size of the colored stimulus, the distance from the eyes, eccentricity in the visual field, and incident illumination. Overhead fluorescent lighting usually is sufficient. The patient must understand, however, that the task is to compare the relative intensity, color saturation, or brightness (e.g., “redness” of an object) when the stimulus is presented alternately to each eye, or at two positions in the visual field, usually to either side of the vertical meridian (Fig. 15). Inconsistent responses can occur, for example, when the subjective sensation of a darker, less saturated red, as seen with an impaired eye, is identified as “redder” than the brightly saturated hue of the stimulus seen with the normal, or less impaired, eye.
Exposure to bright light (pupil light reactions or ophthalmoscopy) or any significant asymmetry in the ocular media (e.g., the presence of unilateral pseudophakia, aphakia, cataract, or other opacity) may falsely diminish the subjective perception of hue and saturation of colors. In these situations, objective tests, such as the pupillary responses, are more reliable indicators of anterior pathway dysfunction.
Special mention must be made of patients who have congenital color deficiencies. Red-green color confusion affects approximately 10% of the male population, and many mildly and moderately affected patients unaware of their deficiency score poorly on the Ishihara series of plates. Therefore, patients should be asked about difficulty discriminating colors or whether color sense was tested previously (e.g., in the military service). If color vision in both eyes is symmetrically depressed, and there is no other reason to account for dyschromatopsia, a congenital deficit should be suspected. The HRR plates are very useful in these cases, because six of the 20 plates are designed to test non-red-green types of congenital color deficiency. Some symbols on these six plates are missed by patients with acquired anterior visual pathway disease affecting central vision, but they are easily identified by patients who have congenital red-green dyschromatopsia, whose vision is otherwise normal, and who have much greater difficulty with some of the more brightly saturated characters on the remaining 14 plates.
Formal testing of color vision with more complex tests usually is not required to diagnose neuro-ophthalmologic visual impairment. The Farnsworth D-15, Lanthony desaturated D-15, and Farnsworth-Munsell 100-hue (F-M 100) tests are primarily used to categorize (type) and determine severity of color deficits in patients with congenital dyschromatopsias. However, these tests can be useful in detecting subtle, central color defects in patients with optic neuropathies.51 The F-M 100, which actually consists of only 85 color caps that must be arranged in sequence according by color matching, is the most thorough test of color vision, but its clinical use is limited because it is lengthy and tedious. Nichols and co-workers52 found that testing with a subset of F-M 100, consisting of chips 22 to 42, had nearly the same sensitivity and specificity for detecting optic neuropathies as the standard F-M 100. These workers found that most of the clinical value of the standard test can be achieved in one-fourth of the time required for the standard F-M 100 test protocol.
Stay updated, free articles. Join our Telegram channel

Full access? Get Clinical Tree


